.jpg)


Restaurant Inventory KPIs: What Multi-Site Groups Should Track
Why Multi-Site Inventory KPIs Are Different
Multi-site inventory KPIs are the stock and cost metrics a restaurant group tracks both per location and as a group: theoretical versus actual food cost, inventory variance, wastage cost, turnover, stock-on-hand value, and inter-branch transfer accuracy. The multi-site part is what makes them hard, because a single blended group number hides which branch is actually off, so every KPI has to stay readable per site.
Track the right KPIs per site and a group stops flying blind between month-end closes. You can see which branch is drifting on food cost while there is still time to act, instead of finding out weeks later when the accounts are reconciled. That is the whole point of an inventory KPI set built for more than one location: it turns a pile of stock movements into a small number of signals a manager can actually steer by.
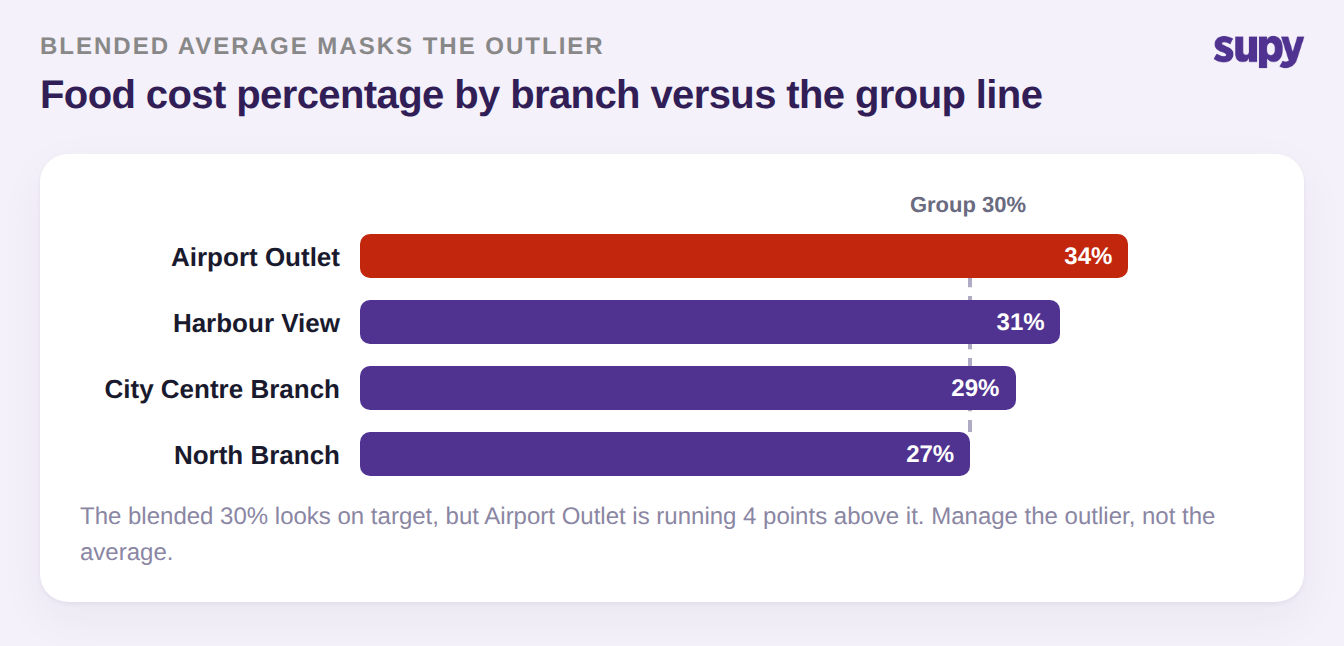
The trap is the group average. A blended food cost percentage that looks healthy can sit on top of one site running several points high and another running low, and the two cancel out on the dashboard. Theoretical cost is available daily while actual cost only lands after the month-end close, so without a per-site view a group manages the whole estate on a number that is both late and averaged. The KPIs below are chosen to break that open: each one is defined, tied to why it bites at multi-site scale, and matched to how you can see it per location.
The Inventory KPIs to Track Across Every Site
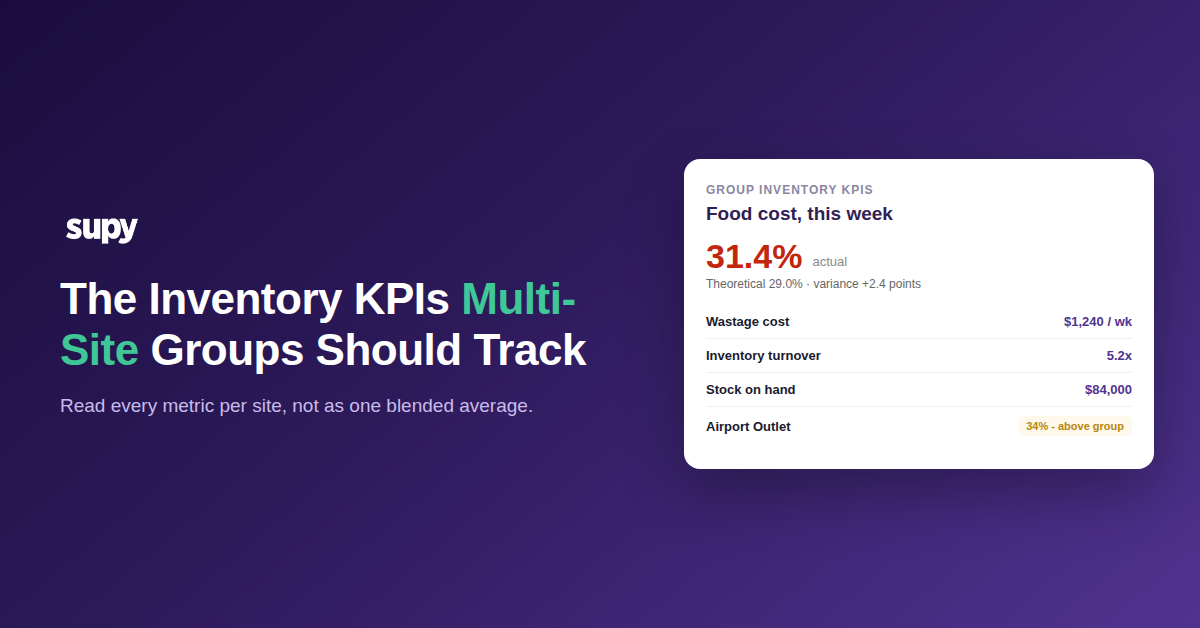
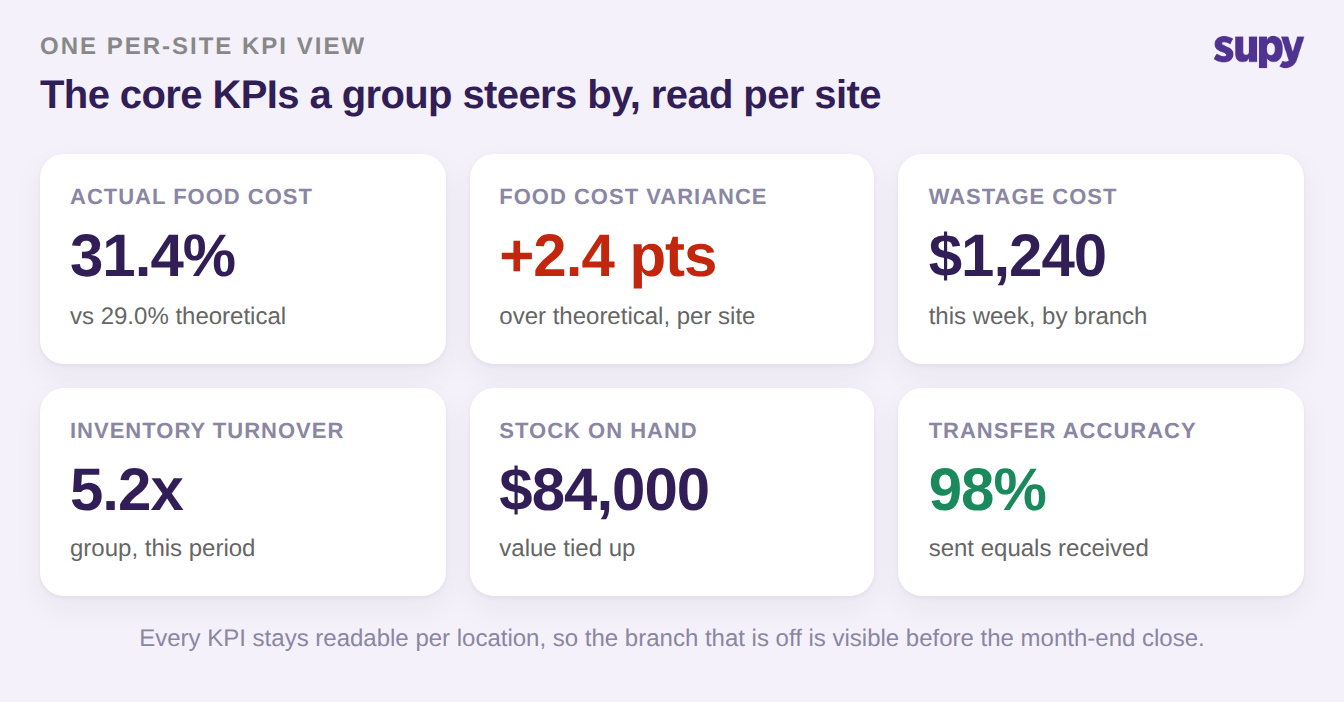
Seven KPIs cover what a multi-site group needs to run inventory well. A single per-site view of them, like the one below, is enough to spot the branch that is off before the close.
1. Theoretical versus actual food cost, per site
Theoretical food cost is what your recipes say a dish should cost; actual food cost is built from the real prices on your goods-received records. The gap between them is the single most useful inventory signal you have. Track it per site, never only as a group figure, because the branch with the widest gap is where recipes are stale, portions are drifting, or waste is going unlogged. Supy's analytics compare theoretical against actual cost for each location, and you can set a target food cost percentage per recipe per location so the system flags a site the moment it breaches.
2. Blended versus per-branch food cost percentage
The group average is a reporting convenience, not a management tool. A blended food cost percentage that looks on target can hide one outlet well above the line and another below it. Watch the spread, not just the mean: the KPI that matters is how far each branch sits from the group. Break the number down per location so the outlier is visible, then manage the outlier rather than the average.
3. Inventory variance between theoretical and counted stock
Inventory variance is the difference between the stock your system expects and the stock a count actually finds. At multi-site scale it tells you which locations are losing product to theft, spoilage, over-portioning, or receiving errors. The catch is that a variance report is only as trustworthy as the data underneath it, so confirm goods-received capture is complete before you act on a number, then compare variance per site to find where control is slipping.
4. Wastage cost by branch and category
Wastage is easy to track as a vague total and useless that way. The KPI worth tracking is wastage cost split by branch and by category, so spoilage, over-production, and prep waste are separated and comparable across sites. Supy quantifies wastage cost for both items and recipes per branch, which turns "we throw a lot away" into a specific, rankable cost you can attack at the site and category that is worst.
5. Inventory turnover
Inventory turnover measures how quickly a site sells through the stock it holds. Track it per location because the same menu turns over differently in a high-street cafe and an airport outlet, and slow turnover is cash sitting on a shelf. Read it against sales rather than in isolation: a falling turnover at one site usually means par levels set too high for that location's real demand.
6. Stock-on-hand value
Stock-on-hand value is the money tied up in inventory right now. A group needs it per site and read against each site's sales run rate, not as one lump sum, because a location holding far more stock than its sales justify is quietly absorbing working capital and increasing spoilage risk. A location-level cost overview makes it obvious which sites are carrying too much.
7. Inter-branch transfer accuracy
This one is unique to multi-site groups and almost always missing from a KPI set. When a central kitchen or warehouse distributes stock to branches, what one site records as sent must equal what the other records as received. Unreconciled transfers quietly corrupt every downstream KPI, because stock that left one location but was never received shows up as variance or loss somewhere it never happened. Track transfer accuracy as its own KPI and reconcile it weekly, using transfer analytics that show both ends of each movement.
Turning the KPIs Into Action
A KPI set only earns its place if it changes what you do on Monday. Run the seven as a weekly review rather than a month-end autopsy: pull each one per site, find the branch that is furthest from where it should be, and take the one move that KPI points to. The table below pairs each KPI with what good looks like and the first thing to check when it is off.
| KPI | What good looks like | First move if it is off |
|---|---|---|
| Theoretical vs actual food cost | Gap under about 2 points, per site | Re-check recipes and unlogged waste on the worst site |
| Blended vs per-branch food cost | No site far from the group line | Open the outlier branch before touching the average |
| Inventory variance | Small and explainable per count | Confirm goods-received capture is complete first |
| Wastage cost by branch | Trending down and categorised | Set wastage categories where they are missing |
| Inventory turnover | Steady and matched to the menu | Cut par levels on slow-moving stock |
| Stock-on-hand value | In line with each site's sales | Investigate sites holding well above their run rate |
| Inter-branch transfer accuracy | Sent equals received | Reconcile transfers weekly, not at month-end |
Start where the leverage is. If theoretical versus actual food cost is your widest gap, that is almost always the highest-value fix, so open the worst site first and work down. If your numbers look clean but you cannot trust them, the problem is usually upstream data quality, which is why stocktake accuracy across sites is worth fixing before you chase any single KPI. And if you want to sanity-check a single site's food cost before building the full picture, a quick food cost calculator gets you a baseline number in a couple of minutes. The goal is not more dashboards; it is a short, per-site KPI set your managers actually act on before the close.