.jpg)


Multi-Unit Restaurant Management: Why Most Groups Hit a Wall at Three Locations
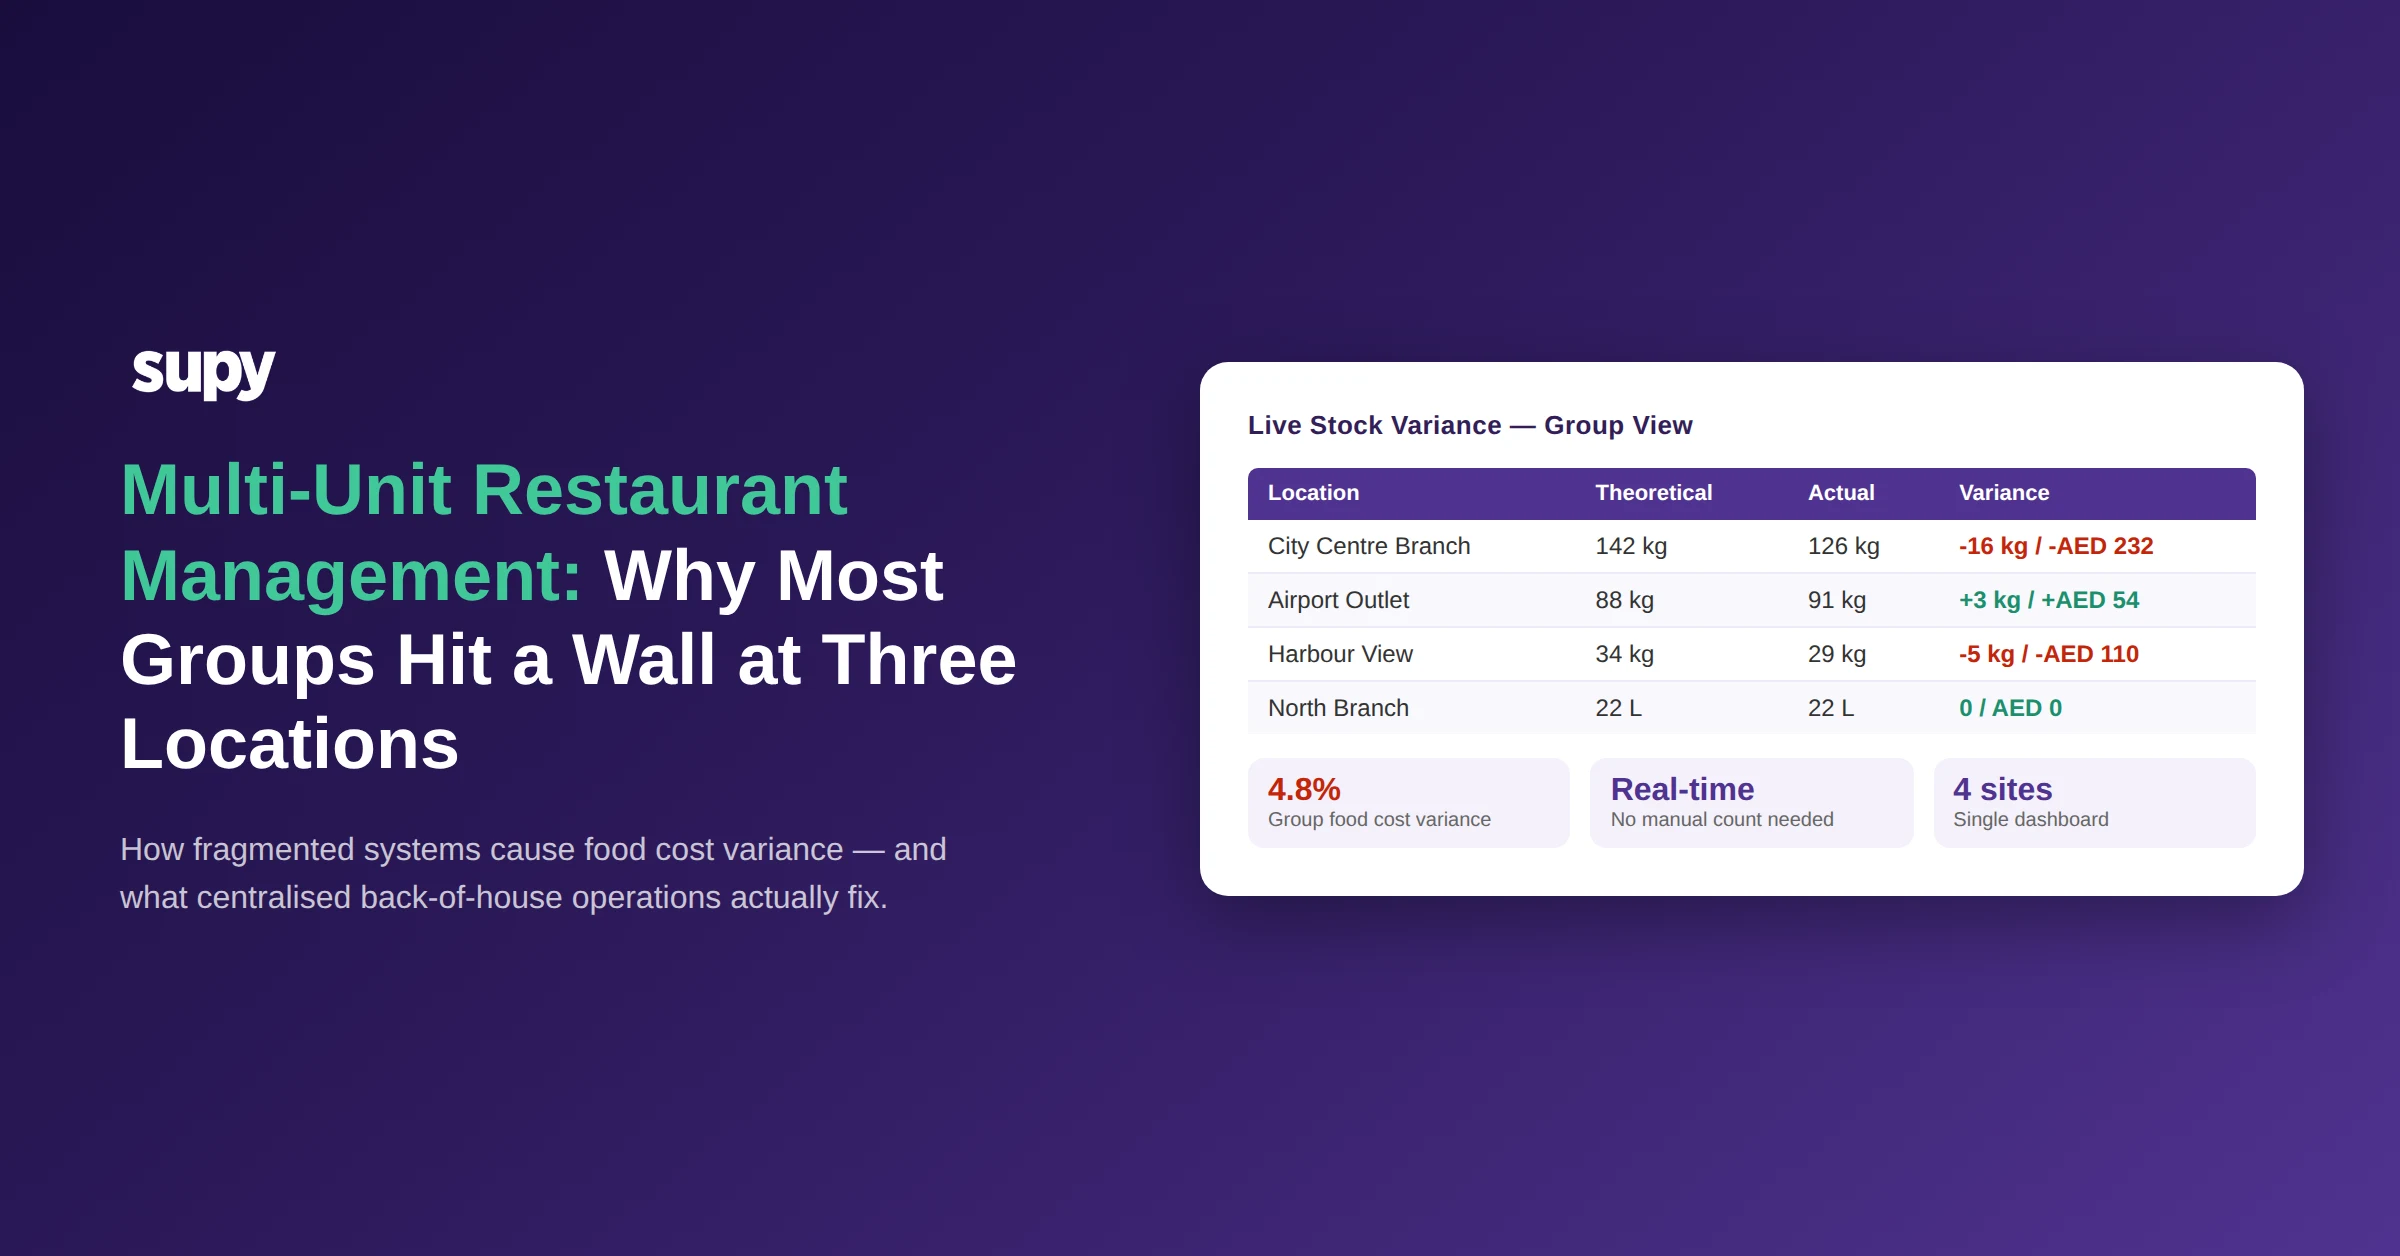
Why Fragmented Systems Break Multi-Site Operations
The problems that emerge as restaurant groups scale share a common cause: no single source of truth. Each location has its own data, held in its own tools, managed by its own staff. The consequences are predictable.
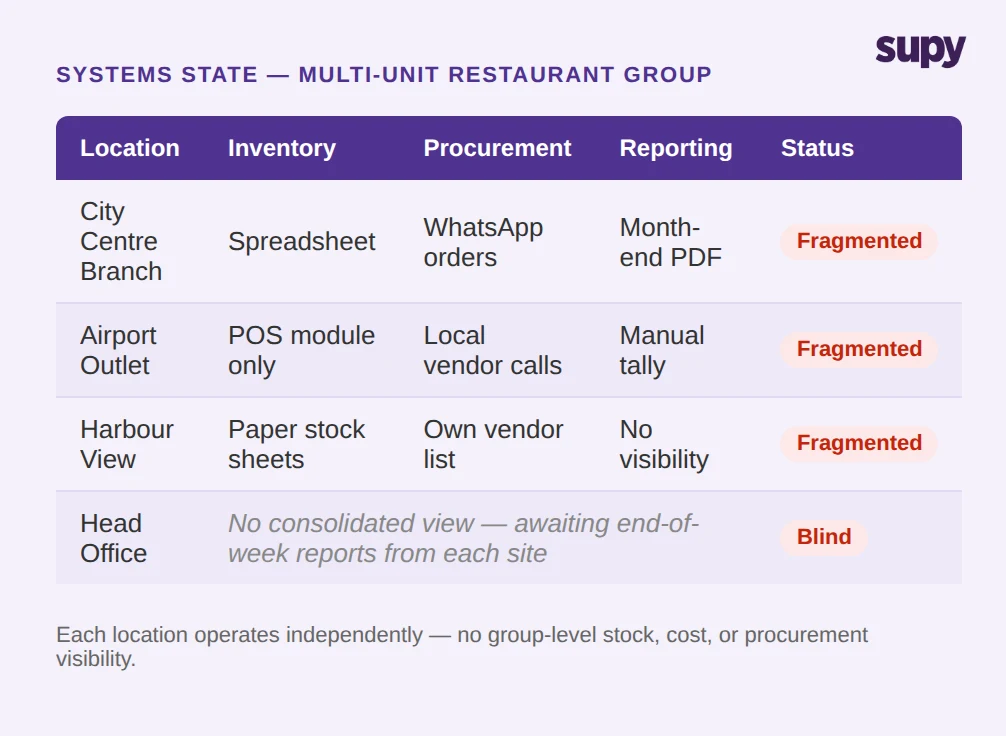
Inventory visibility disappears at head office. Multi-branch operators using branch-level spreadsheets leave the group with no real-time view of stock across locations. Ordering decisions are made at the branch level, without visibility into whether adjacent locations are overstocked or whether a central kitchen could redistribute.
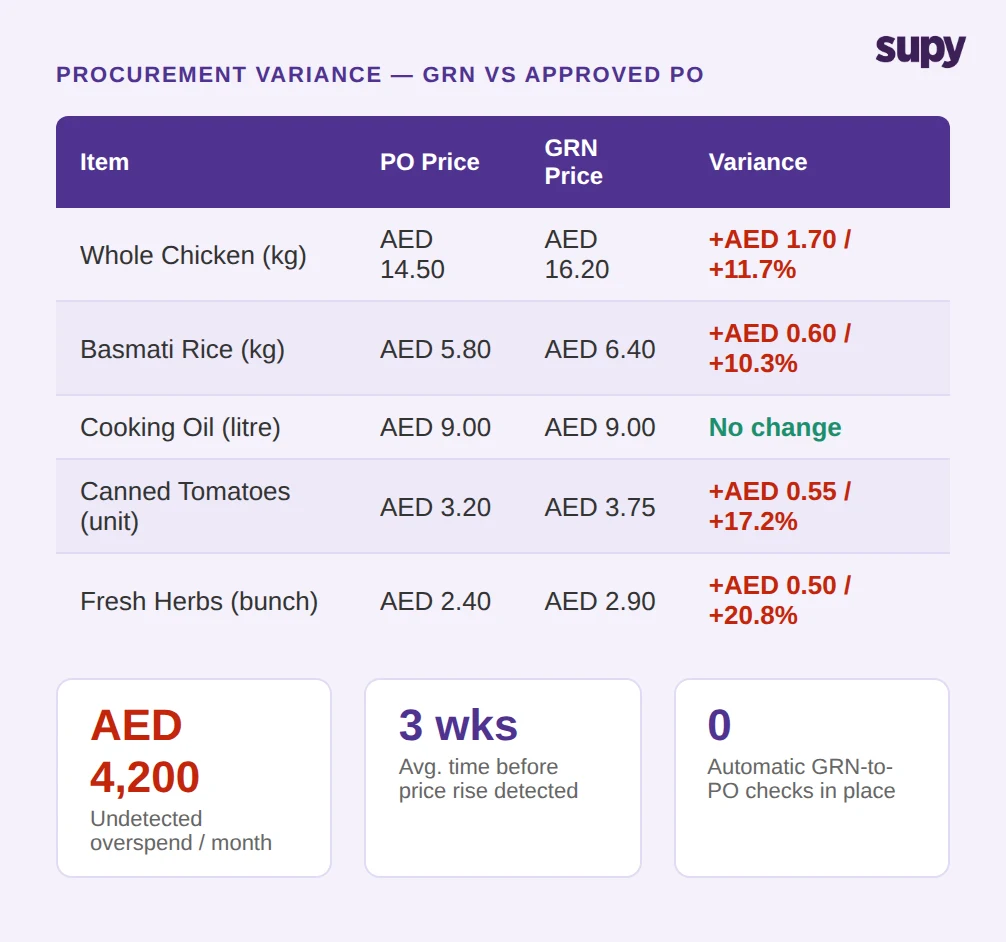
Procurement costs leak undetected. A Saudi Arabia-based F&B group running a paper-based goods-received process found that when a key protein supplier raised prices mid-contract, the increases passed through receiving undetected for weeks. By the time finance reconciled actual invoices against the purchase budget, the food cost versus budget gap had reached 8–12%.
Recipe adherence drifts by location. Without a centralised recipe library, kitchen teams make micro-adjustments — slightly different portion sizes, different trim ratios, different yield assumptions. Cross-site food cost comparison becomes meaningless because the underlying recipe data is not consistent.
Reporting lags behind reality. When data arrives via email spreadsheets, finance teams spend days reconciling before any analysis can begin. A food cost problem that started a month ago gets discovered at month-end.
What to ask before selecting a system: Can you see the food cost position across all locations today, not at the end of the month?
The Five Systems That Hold Multi-Site Operations Together
Effective multi-unit restaurant management requires five interconnected systems that share data with one another.
1. Centralised Inventory and Real-Time Stock Visibility
The foundation is stock data that updates automatically from three inputs: goods received, recipe production (depletion from sales), and waste logging. A multi-location QSR group discovered that manual counting was generating a 4–6% food cost variance every month. Managers spent 5–10 hours per site per week on counting — still arriving at inaccurate results. Automated receiving via AI-scanned GRNs and real-time depletion from POS sales eliminated the counting overhead and brought variances within tolerance.
2. Centralised Procurement and GRN Matching
Every received delivery must be matched against the corresponding purchase order: price variances, quantity differences, and substitutions flagged before the invoice is approved and stock is updated. Without this matching step, price increases pass through silently. Restaurant procurement software that handles GRN-to-PO matching removes the manual reconciliation layer entirely.
3. Centralised Recipe Library and Food Cost Tracking
A recipe library shared across all locations means a recipe updated at head office applies everywhere simultaneously. When ingredient prices update from invoices, every recipe in every location recalculates its food cost automatically. This makes cross-location comparison meaningful — a 4% food cost difference between sites reflects actual operational variance, not different recipe assumptions.
Food costing software that links the recipe library to live invoice prices and stock depletion produces real-time theoretical food cost per location.
4. Waste Tracking and Variance Analysis
Waste is where multi-site operations lose control silently. Without structured waste logging, kitchen teams do not record trim loss, prep waste, or spoilage from an over-order. That unrecorded waste shows up as unexplained variance at the next count. A system that connects waste logs to inventory depletion separates actual consumption from recipe-expected consumption, telling you whether variance is from over-portioning, short-shipments, or receiving errors.
5. Cross-Site Reporting and AI Forecasting
Top-performing multi-unit operators detect operational drift in hours rather than weeks by using AI-driven demand forecasting per site. A 14-day forecast per location allows procurement to adjust order quantities before an over-order becomes waste and before a stockout becomes a service gap. Food and beverage inventory software that integrates with POS data per location closes the loop between forecast, procurement, and actual consumption.
What to Look For in Multi-Unit Restaurant Management Software
Centralised recipe library: one library that all locations read from simultaneously, with change propagation applying updates everywhere at once. Recipe costs should recalculate automatically when invoice prices update.
Real-time inventory visibility across all locations: stock positions that update from POS depletion, GRN receipts, and waste logs — not from manual counts submitted on a schedule.
GRN-to-PO matching: automatic comparison of received prices against approved purchase orders, with variances flagged before invoices are approved.
Consolidated reporting by location: food cost percentage, waste, and procurement data viewable at group level with drill-down per site.
AI demand forecasting: per-location order suggestions based on historical sales and forecasted demand, reducing over-ordering and stockouts.
75+ integrations: a platform that connects to your existing POS, accounting, and supplier systems avoids the double-entry that undermines live data. Platforms with 75+ native integrations cover most POS and accounting tools without custom development.