.jpg)


4-Wall EBITDA for Multi-Site Restaurants: Compare Every Site Fairly
What 4-Wall EBITDA Shows Across Your Restaurants
4-wall EBITDA is the profit a single restaurant makes inside its own four walls, before head-office costs, interest, tax and depreciation. It starts from that site's sales and subtracts only the lines the site controls: cost of goods sold, labour, and the other store-level running costs. The result tells you how the location itself performs, not how the group looks on average.
That per-site view is what makes 4-wall EBITDA useful to a multi-site group. A blended group number can look healthy while one location quietly loses money. When each restaurant reports its own 4-wall EBITDA, you can rank locations on the same basis and see where the real unit economics are strong.
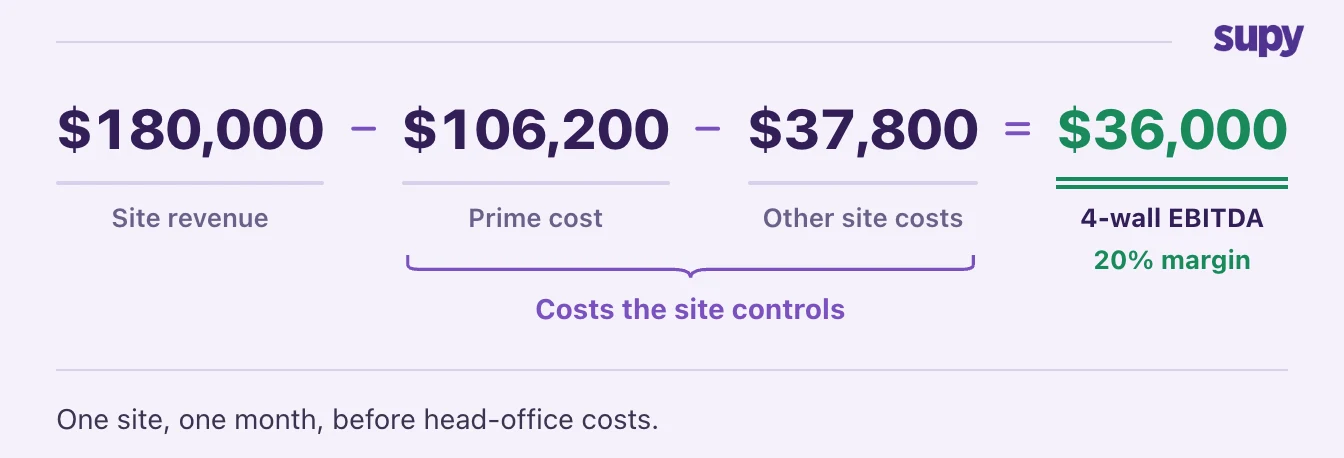
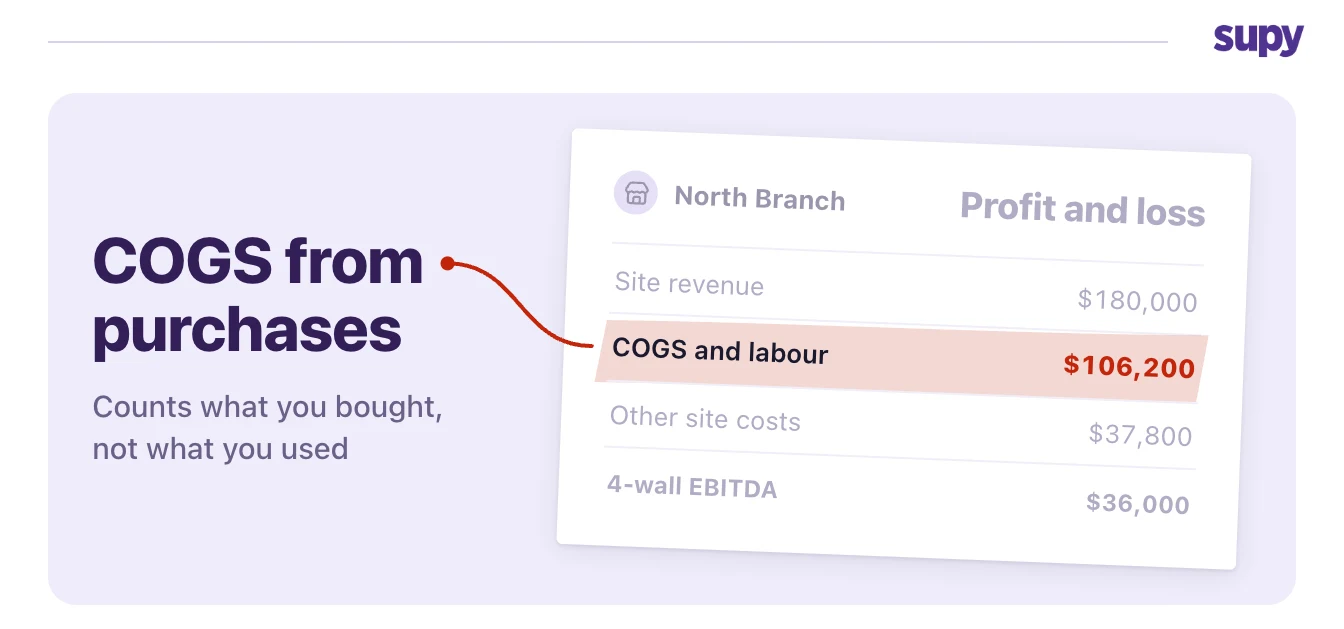
The build-up is short. Take store revenue of $180,000 for the month. Subtract prime cost, the combined COGS and labour, of $106,200. Subtract the other store costs, $37,800 for occupancy, utilities and running expenses. What is left, $36,000, is the site's 4-wall EBITDA, a 20% margin.
Why a Group Average Hides a Site's Real 4-Wall EBITDA
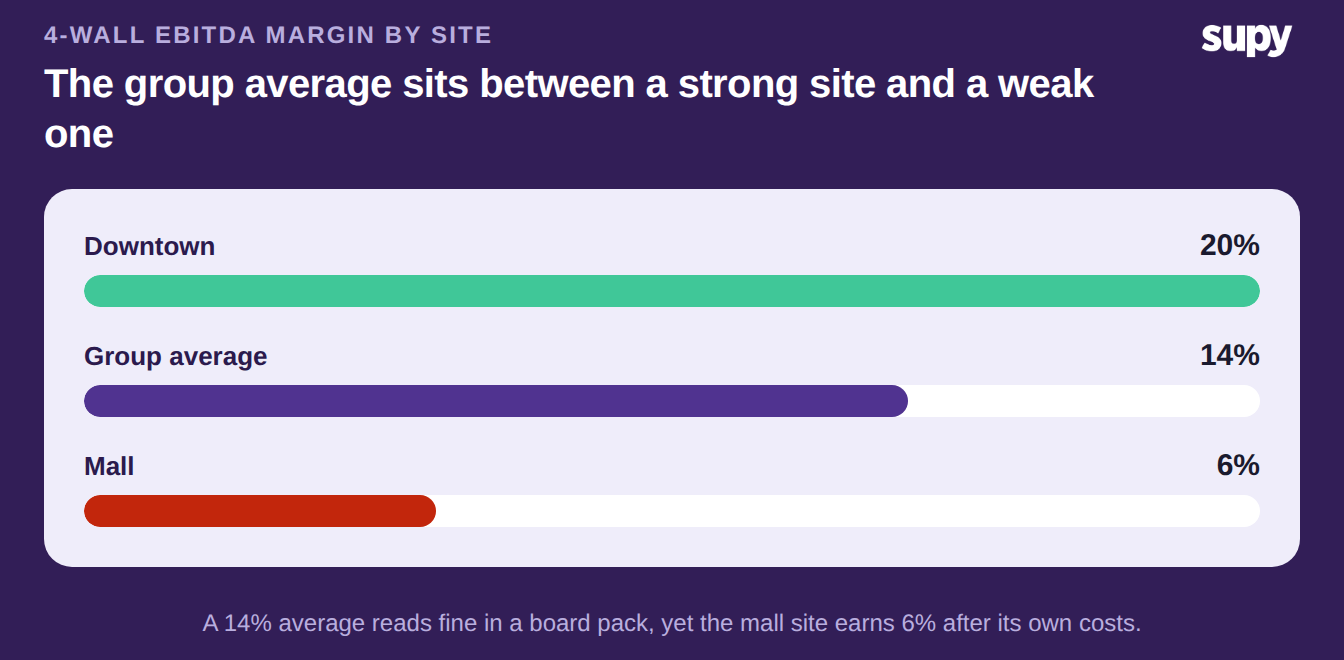
Group reporting usually lands as one blended margin. That single figure averages a strong site and a weak one together, so the weak site never shows up. Two restaurants with the same badge can sit far apart on 4-wall EBITDA, and the average sits comfortably in the middle of both.
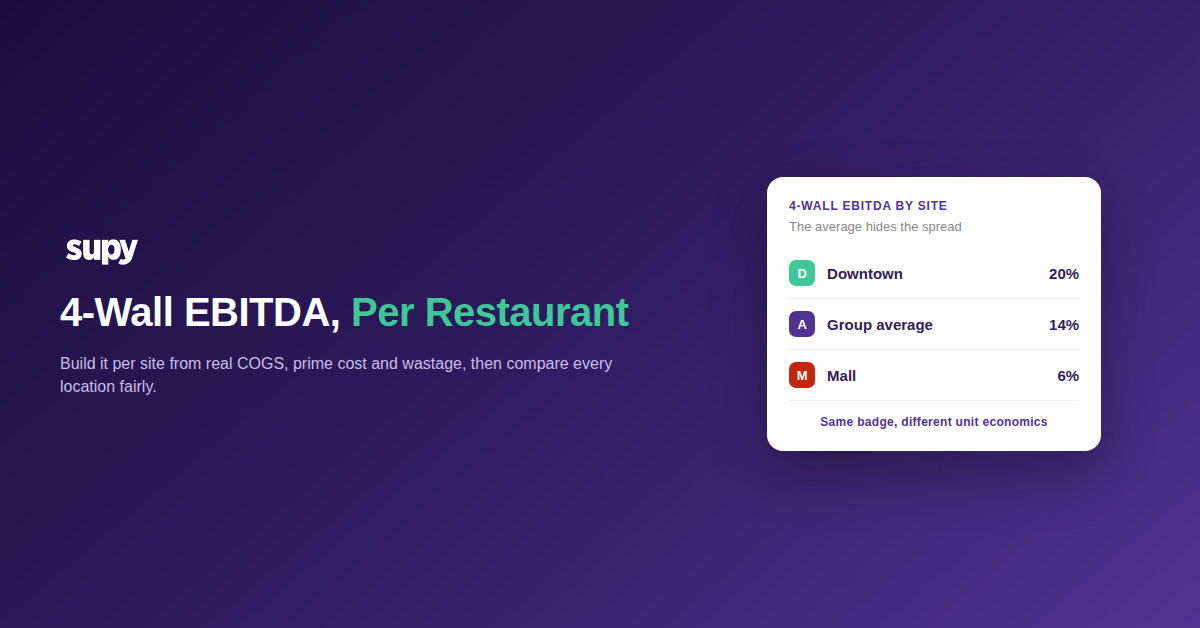
Here is the pattern. Your downtown site runs a 20% 4-wall EBITDA margin. Your mall site runs 6%. The group average lands near 14%, which reads as a solid number in a board pack. Nobody looking at 14% would guess one location is barely breaking even after its own costs.
Per-site 4-wall EBITDA is what pulls that mall site out of hiding. Once each location carries its own margin, the comparison points you straight at where to spend management attention. The weak site is not a surprise at year end. It is a line you can see every month.
Get the Controllable Inputs Right First
A 4-wall EBITDA comparison is only as trustworthy as the numbers feeding it. The metric is simple arithmetic. The hard part is that each input has to be real and measured the same way at every site, or the comparison quietly breaks.
Three inputs do most of the damage when they are wrong. COGS pulled from purchase totals counts what you bought, not what you used. A site that over-ordered then looks cheaper than it really is. Untracked wastage and inconsistent stock counts move a site's margin by several points from month to month. And the same dish can cost around 8% more at one location when its supplier pricing differs, which a single group average never reveals.
Supy is built to supply those inputs accurately, per site. It prices each recipe using the purchase prices at that specific branch. The same dish then carries its real food cost at each location, not a group average. Its interactive dashboards show live COGS and food-cost percentage at group, site and menu-category level, alongside theoretical-versus-actual variance and wastage by type and site. One-click spreadsheet reports export sales and COGS per site, so your finance team can drop clean, comparable numbers straight into the 4-wall EBITDA model. Supy supplies the controllable-cost inputs; it does not calculate EBITDA for you.
If your COGS still comes off purchase totals rather than actual consumption, fix that first. We cover why in why your multi-location COGS number is wrong. The prime cost line deserves the same scrutiny, which the restaurant prime cost formula walks through in full.
Which Input Is Distorting Your Comparison?
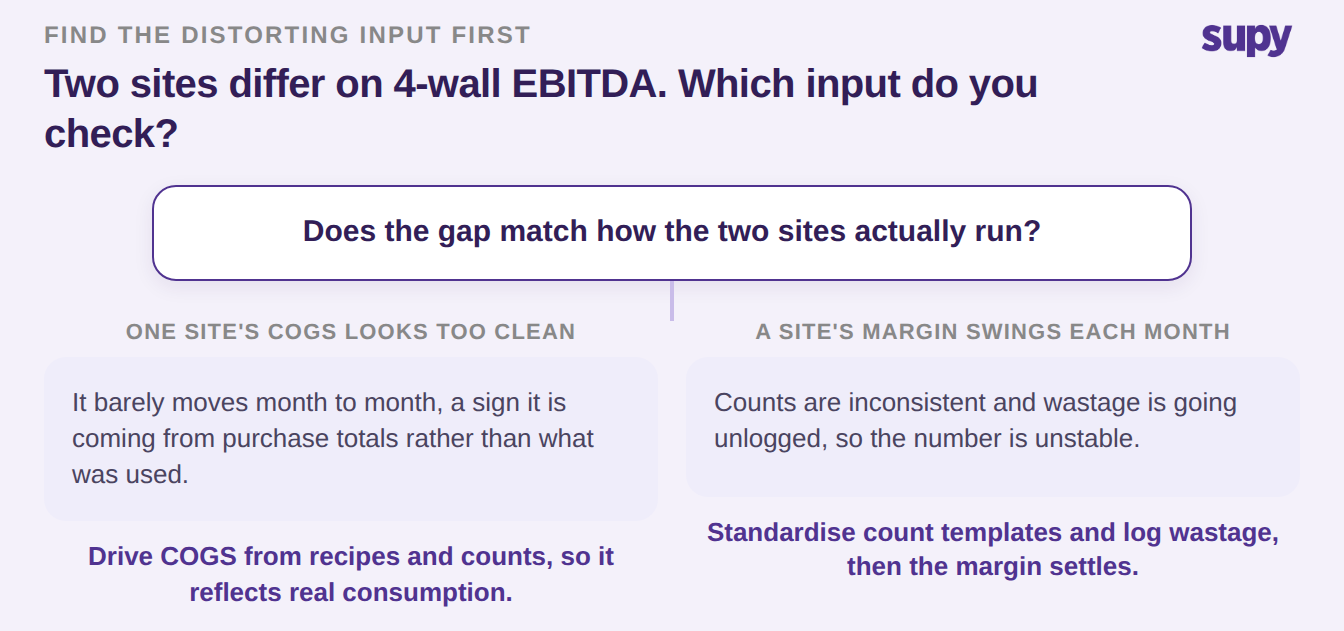
When two sites show very different 4-wall EBITDA, the gap is usually an input problem before it is a management problem. Work out which situation you are in, then fix that input first. The branches below cover the common cases.
If one site's COGS looks suspiciously stable month after month, it is probably coming from purchase totals rather than actual consumption. Drive COGS from recipes and regular stock counts so it reflects what was really used. If the same dish costs more at one location, the cause is per-site supplier pricing, and each recipe needs to be priced at that branch's real purchase prices. If a single site's margin swings from month to month, counts are inconsistent and wastage is going unlogged, so standard count templates and quick wastage logging will settle it.
Once the inputs are clean, the comparison holds. You will be comparing locations, not comparing the quality of your data.
So pick the location whose 4-wall EBITDA you trust least, and name the branch you are in from the section above. If its COGS looks too clean, switch that site to consumption-based COGS before next month's close. If its margin swings, tighten the count and wastage routine there first. Fix the input on that one site, watch the number settle, then roll the same fix across the group so every restaurant is finally measured on the same basis.