Food cost
Inventory

Restaurant COGS Calculation Mistakes: 8 Reasons Your Multi-Location Cost of Goods Sold Number Is Wrong

Why a multi-location restaurant COGS number comes out wrong

How a Multi-Location COGS Number Goes Wrong

A multi-location COGS number goes wrong when bad data reaches the calculation, not when the maths fails. Cost of goods sold (COGS) is opening stock, plus purchases received, minus closing stock, bounded by two counts, but across many sites every branch count, every transfer, and every recipe feeds that one figure. So a single unlogged transfer or mistimed count in one outlet quietly moves the whole group number.

That is why the reported number so often disagrees with itself. One multi-venue group traced a stubborn margin gap to stocktakes that never landed on month-end; once they bounded the calculation strictly between two count dates, their actual food cost came in at 39%, not the 41% the loose report had been showing. A large multi-site group found a single branch had logged producing 622 kg of a sauce base from only 470 kg of supply, a 152 kg gap, because a central-kitchen transfer was never recorded on the receiving end. In both cases the recipes were fine. The calculation was fed bad data.

The reliable figure is the actual-cost method: opening stock plus purchases minus closing stock, between two real counts. The recipe-driven theoretical figure is useful insight, but it can never be your actuals source, even with perfect recipes. If you have not separated the two, start with theoretical vs actual food cost variance before working through the list below.

Flow showing the actual-cost method: opening stock plus purchases minus closing stock bounded by two counts equals a trustworthy 39% COGS, versus the purchase-totals shortcut that tracks buying not usage

8 Reasons Your COGS Number Is Wrong (and How to Catch Each One)

Each of the causes below came from a real multi-site operation, and each has a fast check you can run before you trust another month's number.

  1. A unit-entry typo inflates recipe cost. A quantity keyed in the wrong unit, grams entered as kilos, can turn a $6 recipe into $48 overnight with no other change. Add a sell price to every recipe so an implausible margin flags itself immediately.
  2. Unlogged transfers between central kitchen and branch. Stock recorded as sent but never confirmed received creates phantom stock on one side and unexplained variance on the other, the kind of gap that showed up as a 152 kg shortfall at one branch. Require receiver-accepted transfers so both ends agree before the movement posts.
  3. Duplicate items split one ingredient's cost in two. Case-sensitivity or naming variants create two records for what should be a single ingredient, so its true cost is never visible in one place. Keep one base item per ingredient.
  4. An uncontrolled price edit propagates group-wide. A single receiver correcting an invoice line can silently update that ingredient's cost across every location. Lock price-base edits to a named role with a specific permission.
  5. COGS calculated from purchase totals, not consumption. The figure then tracks buying patterns instead of what was actually used, masking whether items are hitting target for a full buying cycle. Switch to consumption-based costing tied to POS sales.
  6. Stocktakes not bounded to month-end. A count landing a few days early or late pulls stock from the wrong period into the figure - one operator's true 39% read as 41% until counts were bound strictly between two dates.
  7. Variable-weight items averaged into one recipe. Costing a whole steak cut as a single average understates some portions and overstates others. Split variable-weight items into size-specific recipes.
  8. Modifier and swap recipes duplicated instead of linked. Swapping an ingredient, gluten-free bread for standard, in a duplicated recipe never returns the removed item to stock, distorting margin at the dish level. Tie modifier recipes to POS modifiers so swaps update stock correctly.
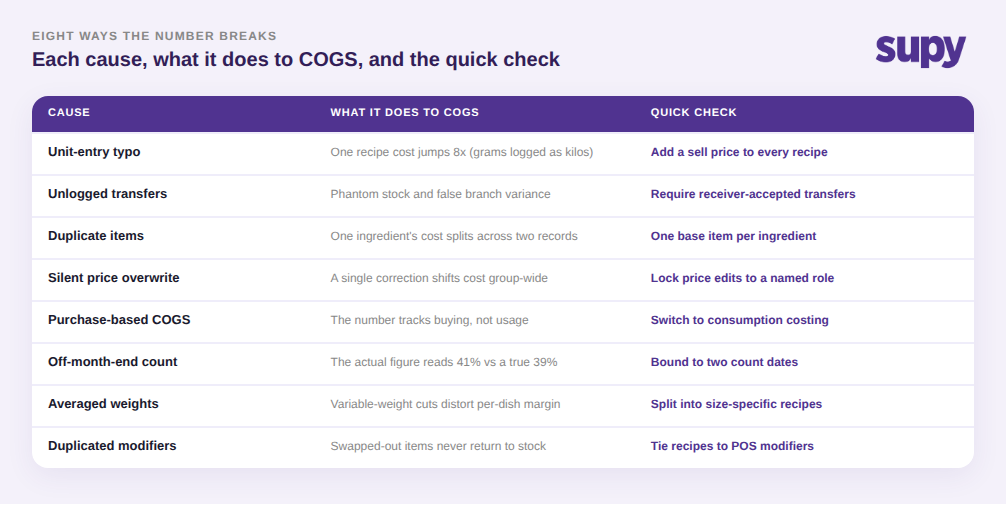
Table of eight COGS calculation mistakes, what each does to the number, and the quick check for each: unit typos, unlogged transfers, duplicate items, silent price overwrites, purchase-based COGS, off-month-end counts, averaged weights, and duplicated modifiers

How to Find Which Cause Is Hitting You

When a branch number looks wrong, you do not have to guess which of the eight it is. Work three reports in order. Start with the item's transaction history to find the exact entry where the balance first went negative. Then use a production report by ingredient to confirm whether logged consumption matches the size of the variance. Finally, compare theoretical against actual cost per location to see whether the gap is isolated to one site or spread across the group. In sequence, those three narrow a vague monthly discrepancy down to a single entry: a transfer, a recipe, or a count error.

This is where a purpose-built inventory platform earns its place. Supy keeps theoretical stock updated continuously from every goods-received note and recipe consumption event, captures the latest recipe cost per location on each count date so variance shows its food-cost impact per site, and flags a recipe breaching its target the moment a purchase or recipe change causes it, rather than a month later. Operators run these checks across live COGS and variance dashboards and reusable stock-counting templates that bound every period cleanly.

Three-step diagnostic to isolate a wrong COGS figure: item transaction history, then production report by ingredient, then cost per location, narrowing the cause to a transfer, recipe, or count error

Before you sign off on next month's number, run the eight checks as a quick self-audit and mark which ones your operation cannot currently pass. Most groups find two or three. Fix the one that touches the most sites first, usually unlogged transfers or purchase-based costing, because it is corrupting every branch's figure at once. Get that single input clean and the group COGS number stops arguing with your finance report.

Book a Demo with Supy - fix restaurant COGS calculation mistakes across locations

Ready to optimize your restaurant operations?

Blog

Our operational insights

No items found.

Your questions 
answered

Everything you need to know about Supy — from setup to integrations, pricing, and daily use. If it’s not covered here, just ask.

What Is COGS for a Restaurant, and How Is It Calculated?
+

Cost of goods sold (COGS) is what your food and beverage actually cost over a period. The reliable method is opening stock, plus purchases received, minus closing stock, measured strictly between two stock counts. That result, divided by revenue, gives your food cost percentage. It differs from the theoretical figure your recipes predict, which assumes every portion is made exactly to spec. For a single site the calculation is simple; across multiple locations, each branch count, transfer, and recipe feeds the same number, so one bad input anywhere moves the whole group figure.

Why Is My COGS Number Different at Each Location?
+

Because each location supplies its own inputs to the calculation, and any of them can be wrong. A branch might count stock a few days off period-end, receive a transfer it never logged, or carry a duplicate item that splits an ingredient cost. A price correction made at one outlet can also propagate group-wide if permissions are loose. None of these are recipe problems; they are data problems that surface as location-level variance. The fix is to standardise how every site counts, transfers, and edits prices, then compare theoretical against actual cost per location to see where the gap sits.

What Is the Difference Between Theoretical and Actual Food Cost?
+

Theoretical food cost is what your food should cost if every dish were made exactly to recipe, with no waste beyond yield allowances. It is calculated from recipe cost times units sold, tied to POS sales. Actual food cost is what you really spent: opening stock, plus purchases, minus closing stock, bounded by two counts. The theoretical figure is useful insight for spotting drift, but it can never be your actuals source, even with perfect recipes. Trouble starts when teams read the theoretical report as if it were the real number. Keep both, and know which one finance should trust.

How Often Should I Count Stock to Get an Accurate COGS?
+

Count on a consistent schedule that bounds each reporting period, and get the count as close to true month-end as practical. COGS is only accurate when the calculation runs strictly between two count dates; a count that lands days early or late pulls stock from another period into the figure, which is how a true 39% can read as 41%. Many groups count monthly for reporting and spot-count high-value or high-variance items weekly. What matters more than raw frequency is that the opening and closing counts actually bracket the period you are measuring.

Why Does Calculating COGS From Purchase Totals Give the Wrong Number?
+

Because purchases are what you bought, not what you used. If you pull COGS from purchase totals in accounting software, the number moves with buying patterns: it looks low in a light buying week and high when you stock up, regardless of actual consumption. That masks whether menu items are hitting target until a full stock cycle exposes the gap. Consumption-based costing fixes this by depleting actual ingredients as recipes are produced and sold through the POS, giving a theoretical-versus-actual split with variance you can act on rather than a figure that only reflects the timing of your orders.

How Do Unlogged Transfers Between a Central Kitchen and Branches Distort COGS?
+

When stock moves from a central kitchen to a branch but is only recorded on one end, both figures go wrong: the sending site shows stock it no longer has, and the receiving site shows usage it cannot explain. That creates phantom variance, like a branch appearing to produce more than its raw supply could allow. It also hides real problems inside noise. Requiring receiver-accepted transfers fixes it: stock only moves when both ends confirm, and the adjustment posts automatically to variance and usage on each side, so the audit trail shows exactly where every unit went.

How Can I Tell Which Mistake Is Causing My Wrong COGS Number?
+

Work three reports in order. Start with the item transaction history to find the exact entry where the on-hand balance first went negative or jumped. Then check a production report by ingredient to see whether logged consumption matches the size of the variance. Finally, compare theoretical against actual cost per location to learn whether the gap is isolated to one site or spread across the group. In sequence, those three narrow a vague monthly discrepancy to a single cause: a transfer, a recipe, or a count error. Fix the one that touches the most sites first.

Ready to transform your operations?

Join 3500+ restaurant operators cutting costs, streamlining operations and making smarter decisions with Supy.