.jpg)


Restaurant COGS Calculation Mistakes: 8 Reasons Your Multi-Location Cost of Goods Sold Number Is Wrong

How a Multi-Location COGS Number Goes Wrong
Cost of goods sold (COGS) is what your food actually cost in a period: opening stock, plus purchases received, minus closing stock, bounded by two counts. Across multiple locations those inputs multiply, because every branch count, every transfer, and every recipe feeds the same figure. So one bad entry in one outlet quietly moves the whole group number.
That is why the reported number so often disagrees with itself. One multi-venue group traced a stubborn margin gap to stocktakes that never landed on month-end; once they bounded the calculation strictly between two count dates, their actual food cost came in at 39%, not the 41% the loose report had been showing. A large multi-site group found a single branch had logged producing 622 kg of a sauce base from only 470 kg of supply, a 152 kg gap, because a central-kitchen transfer was never recorded on the receiving end. In both cases the recipes were fine. The calculation was fed bad data.
The reliable figure is the actual-cost method: opening stock plus purchases minus closing stock, between two real counts. The recipe-driven theoretical figure is useful insight, but it can never be your actuals source, even with perfect recipes. If you have not separated the two, start with theoretical vs actual food cost variance before working through the list below.

8 Reasons Your COGS Number Is Wrong (and How to Catch Each One)
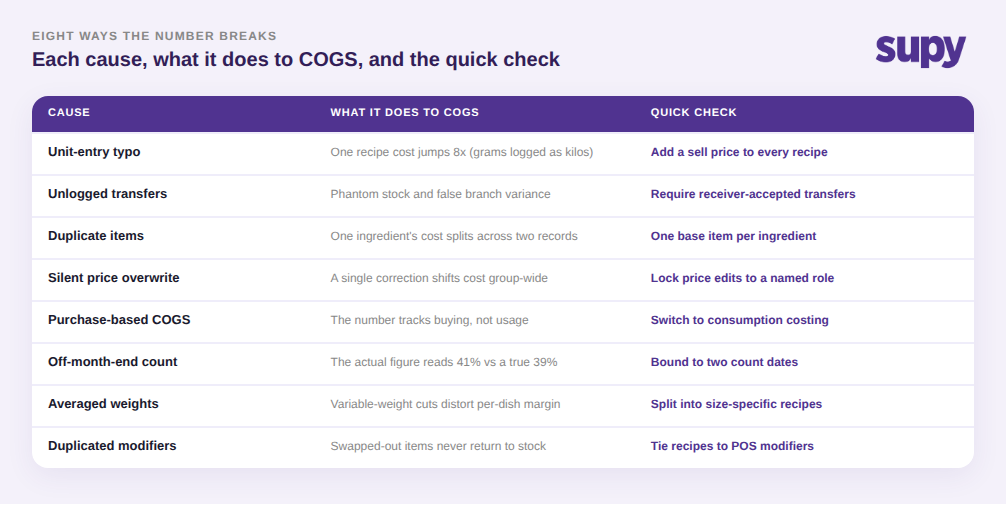
Each of the causes below came from a real multi-site operation, and each has a fast check you can run before you trust another month's number.
- A unit-entry typo inflates one recipe. A single ingredient logged as 3 kg instead of 3 g turned a recipe that should cost $6 into one costing $48, an 8x error that dragged the whole menu-category cost with it. The catch: put a selling price on every recipe as a validation step, so an impossible food-cost percentage flags the typo the moment it is entered.
- Central-kitchen transfers go unlogged. When stock moves between a central kitchen and a branch but is only recorded on one end, you get phantom stock and false variance, like the 152 kg gap above. The catch: require receiver-accepted transfers, so stock only moves when both ends confirm it and the adjustment posts to variance and usage automatically.
- Modifier and swap recipes are duplicated. Managing every egg style, bread swap, and add-on by copying whole recipes means a swapped-out ingredient never returns to stock, so margin drifts silently. One group only saw a breakfast item's true 11% food cost on a $16.50 plate after mapping it correctly. The catch: tie recipes to POS modifiers so swaps return the removed item to stock.
- Duplicate items split one ingredient's cost. Case-sensitivity and inconsistent naming create two records for the same ingredient, so its cost and usage scatter across both and never reconcile. The catch: keep one base item per ingredient with every supplier SKU and pack size linked to it.
- A price correction overwrites the group. When any receiver fixing an invoice line can update that ingredient's price everywhere, one outlet's correction silently changes COGS across every site. The catch: lock price-base changes to a named role, and make a receipt correction apply to that single purchase unless someone explicitly promotes it.
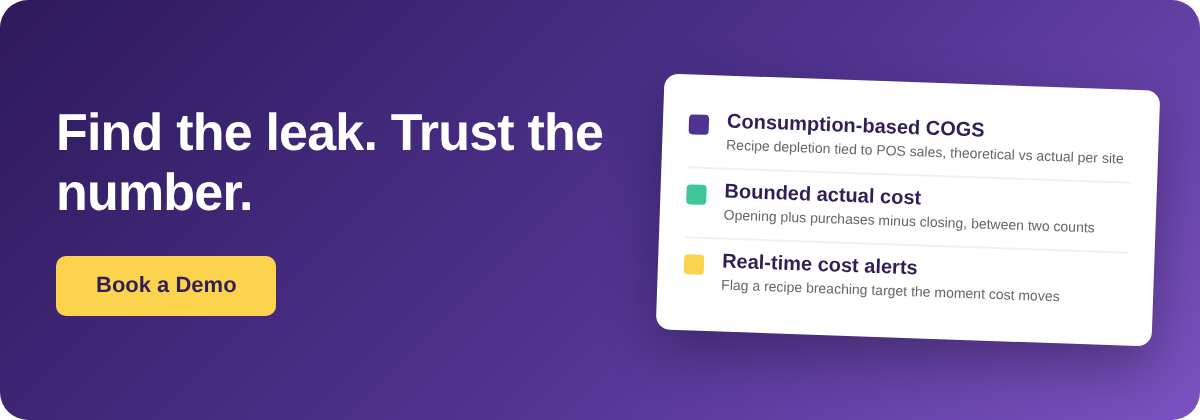
- COGS is calculated from purchases, not consumption. Pulling the number from purchase totals in accounting software makes it track buying patterns rather than what was actually used, masking whether items hit target until a stock cycle exposes it. The catch: use consumption-based costing, where recipe production depletes actual ingredients and ties to POS sales for a theoretical-vs-actual split.
- Stocktakes miss month-end. If counts do not bound the period, the actual figure is contaminated by stock that belongs to another month, which is how a true 39% reads as 41%. The catch: count as close to true period-end as practical, and bound the calculation strictly between two count dates.
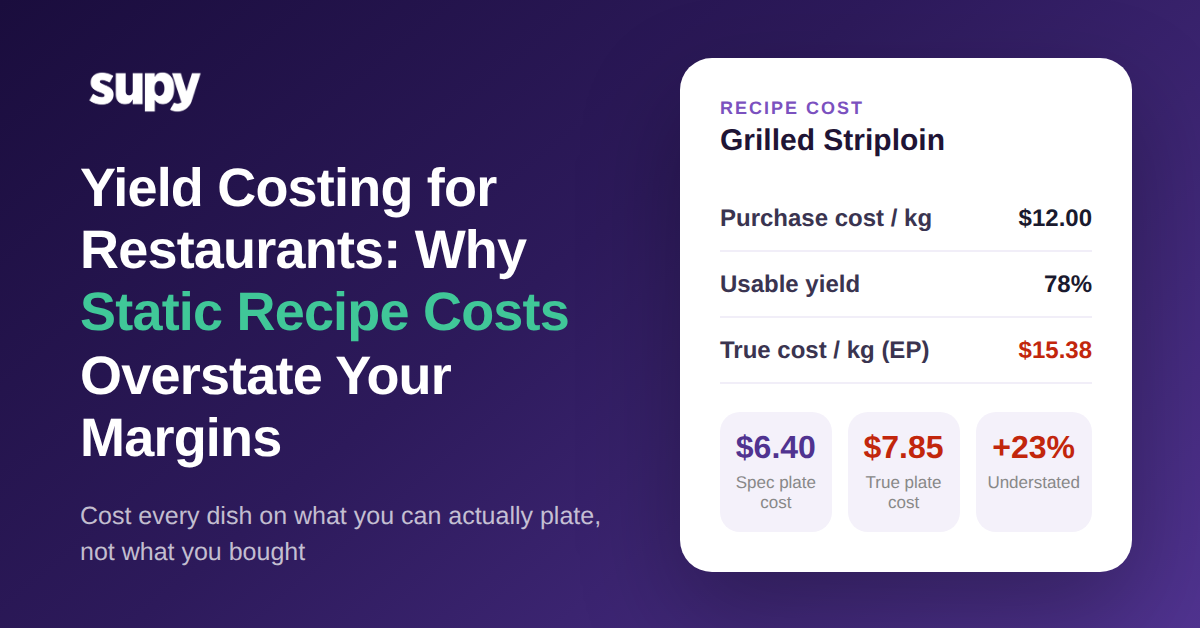
- Variable-weight items are averaged. Rolling a whole steak cut or any variable-weight item into one averaged recipe builds error straight into the cost. The catch: split it into size-specific recipes instead of a single blended one.
How to Find Which Cause Is Hitting You
When a branch number looks wrong, you do not have to guess which of the eight it is. Work three reports in order. Start with the item's transaction history to find the exact entry where the balance first went negative. Then use a production report by ingredient to confirm whether logged consumption matches the size of the variance. Finally, compare theoretical against actual cost per location to see whether the gap is isolated to one site or spread across the group. In sequence, those three narrow a vague monthly discrepancy down to a single entry: a transfer, a recipe, or a count error.
This is where a purpose-built inventory platform earns its place. Supy keeps theoretical stock updated continuously from every goods-received note and recipe consumption event, captures the latest recipe cost per location on each count date so variance shows its food-cost impact per site, and flags a recipe breaching its target the moment a purchase or recipe change causes it, rather than a month later. Operators run these checks across live COGS and variance dashboards and reusable stock-counting templates that bound every period cleanly.

Before you sign off on next month's number, run the eight checks as a quick self-audit and mark which ones your operation cannot currently pass. Most groups find two or three. Fix the one that touches the most sites first, usually unlogged transfers or purchase-based costing, because it is corrupting every branch's figure at once. Get that single input clean and the group COGS number stops arguing with your finance report.