تكلفة الغذاء
المخزون

أخطاء حساب COGS في المطاعم: 8 أسباب تجعل رقم تكلفة البضاعة المباعة لمجموعتك متعددة المواقع غير دقيق

Why a multi-location restaurant COGS number comes out wrong

كيف يخطئ رقم COGS لمجموعة متعددة المواقع

يخطئ رقم COGS لمجموعة متعددة المواقع عندما تصل بيانات خاطئة إلى الحساب، لا عندما تفشل العملية الحسابية نفسها. تكلفة البضاعة المباعة (COGS) هي المخزون الافتتاحي، زائداً المشتريات المستلمة، ناقصاً المخزون الختامي، محدودةً بجردتين، لكن عبر مواقع متعددة يغذّي كل جرد فرع وكل نقل وكل وصفة هذا الرقم الواحد. لذا، يحرّك نقل واحد غير مسجّل أو جرد في توقيت خاطئ بأحد المنافذ الرقمَ الإجمالي للمجموعة بصمت.

هذا هو السبب في أن الرقم المُبلَّغ عنه يتعارض مع نفسه كثيرًا. تتبّعت إحدى مجموعات المطاعم متعددة المواقع فجوةً ثابتة في هامش الربح الإجمالي إلى جردات مخزون لم تُطابق نهاية الشهر قط؛ حين قيّدت الحساب بصرامة بين تاريخَي جرد محدّدين، جاءت تكلفة الغذاء الفعلية 39%، لا 41% التي كان التقرير المفتوح يُظهرها. واكتشفت مجموعة كبيرة متعددة المواقع أن فرعاً واحداً سجّل إنتاج 622 كيلوغرام من قاعدة صلصة من 470 كيلوغرام فقط من المورد، وهو فارق 152 كيلوغرام، لأن نقلاً من المطبخ المركزي لم يُسجَّل على طرف الاستلام. في كلتا الحالتين كانت الوصفات سليمة. المشكلة في البيانات التي أُطعمت إلى الحساب.

الرقم الموثوق هو طريقة التكلفة الفعلية: المخزون الافتتاحي زائداً المشتريات ناقصاً المخزون الختامي، بين جردتين حقيقيتين. الرقم النظري المستند إلى الوصفات رؤية مفيدة، لكنه لا يمكن أبداً أن يكون مصدر أرقامك الفعلية، حتى مع وجود وصفات مثالية. إن لم تفصل بين الاثنين، ابدأ بـ التباين بين تكلفة الغذاء النظرية والفعلية قبل استعراض القائمة أدناه.

Flow showing the actual-cost method: opening stock plus purchases minus closing stock bounded by two counts equals a trustworthy 39% COGS, versus the purchase-totals shortcut that tracks buying not usage

8 أسباب تجعل رقم COGS الخاص بك خاطئًا (وكيف تكتشف كل واحد)

كل سبب من الأسباب أدناه مستمَد من عملية متعددة المواقع حقيقية، ولكل منه تحقق سريع يمكنك إجراؤه قبل أن تثق بأرقام شهر آخر.

  1. خطأ إدخال وحدة القياس يرفع تكلفة الوصفة. كمية تُدخَل بوحدة خاطئة، جرامات تُدخَل بوصفها كيلوجرامات، يمكن أن تحوّل وصفة بـ 6 دولارات إلى 48 دولارًا بين عشية وضحاها دون أي تغيير آخر. أضف سعر بيع لكل وصفة حتى يلفت الانتباه أي هامش ربح إجمالي غير منطقي على الفور.
  2. نقل غير مسجّل بين المطبخ المركزي والفرع. المخزون المسجّل كمُرسَل لكنه لم يؤكَّد استلامه يخلق مخزونًا وهميًا في طرف وتباينًا غير مفسَّر في الطرف الآخر — نوع الفجوة التي ظهرت كعجز 152 كيلوغرام في أحد الفروع. اشترط نقولاً يقبلها المستلم حتى يتفق الطرفان قبل تسجيل الحركة.
  3. تكرار الأصناف يُقسّم تكلفة مكوّن واحد إلى اثنتين. حساسية الأحرف أو اختلاف أسماء الأصناف تُنشئ سجلَّين لما يجب أن يكون مكونًا واحدًا، فلا تكون تكلفته الحقيقية مرئية في مكان واحد. احتفظ بصنف أساسي واحد لكل مكوّن.
  4. تعديل سعر غير مُتحكَّم فيه ينتشر على مستوى المجموعة. مستلم واحد يصحح سطرًا في فاتورة يمكن أن يُحدّث تكلفة ذلك المكوّن بصمت عبر كل المواقع. اقصر تعديلات السعر الأساسي على دور محدد بصلاحية بعينها.
  5. COGS مُحسَب من إجماليات المشتريات لا من الاستهلاك. الرقم حينئذٍ يتتبع أنماط الشراء عوض ما استُهلك فعلاً، مما يحجب ما إذا كانت الأصناف تحقق المستهدف خلال دورة شراء كاملة. انتقل إلى التكلفة القائمة على الاستهلاك المرتبطة بمبيعات نقاط البيع.
  6. جردات مخزون لا تتقيّد بنهاية الشهر. جرد يقع قبل أو بعد الموعد بأيام قليلة يسحب مخزونًا من فترة أخرى إلى الرقم — قرأ مشغّل واحد نسبته الفعلية 39% على أنها 41% حتى قيّد الجرد بصرامة بين تاريخين.
  7. أصناف ذات وزن متغيّر مُجمَّعة في وصفة واحدة. تكلفة قطعة لحم كاملة كمتوسط واحد تُقلّل تكلفة بعض الحصص وتُبالغ في غيرها. قسّم الأصناف ذات الوزن المتغيّر إلى وصفات خاصة بكل حجم.
  8. وصفات المُعدِّلات والاستبدالات مُكرَّرة بدلاً من مرتبطة. استبدال مكوّن — خبز خالٍ من الغلوتين عوض العادي — في وصفة مكرّرة لا يُعيد الصنف المُزال إلى المخزون أبدًا، مما يُشوّه هامش الربح على مستوى الطبق. اربط وصفات المُعدِّلات بمُعدِّلات نقاط البيع حتى تُحدِّث المبادلات المخزون بصورة صحيحة.
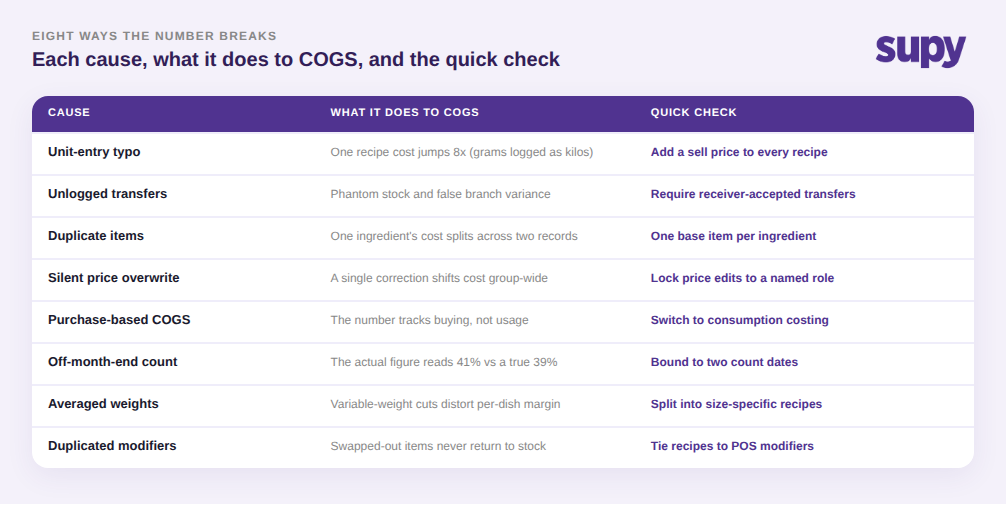
Table of eight COGS calculation mistakes, what each does to the number, and the quick check for each: unit typos, unlogged transfers, duplicate items, silent price overwrites, purchase-based COGS, off-month-end counts, averaged weights, and duplicated modifiers

كيف تعرف السبب الذي يؤثر عليك

حين يبدو رقم الفرع خاطئًا، لا داعي للتخمين بأيّ الأسباب الثمانية يتعلق الأمر. شغّل التقارير الثلاثة بالترتيب. ابدأ بسجل معاملات الصنف لإيجاد الإدخال الذي انخفض فيه الرصيد لأول مرة إلى ما دون الصفر. ثم استخدم تقرير الإنتاج حسب المكوّن للتحقق مما إذا كان الاستهلاك المسجّل يتطابق مع حجم التباين. أخيرًا، قارن التكلفة النظرية بالتكلفة الفعلية لكل موقع لمعرفة ما إذا كانت الفجوة محصورة في موقع واحد أم منتشرة عبر المجموعة. هذه الخطوات الثلاث بالتتابع تُضيّق تناقضًا شهريًا مبهمًا إلى إدخال واحد: نقل، أو وصفة، أو خطأ جرد.

هنا تُثبت منصة المخزون المتخصصة قيمتها. تُبقي Supy المخزون النظري محدَّثًا باستمرار من كل مذكرة استلام بضاعة وحدث استهلاك في الوصفات، وتلتقط أحدث تكلفة للوصفة لكل موقع في كل تاريخ جرد حتى يُظهر التباين تأثيره على تكلفة الغذاء لكل موقع، وتُنبّه فور اختراق وصفة لمستهدفها بسبب تغيير في الشراء أو الوصفة، لا بعد شهر. يجري المشغّلون هذه التحققات عبر لوحات معلومات COGS والتباين الفورية وقوالب جرد المخزون القابلة لإعادة الاستخدام التي تُحدّد كل فترة بوضوح.

Three-step diagnostic to isolate a wrong COGS figure: item transaction history, then production report by ingredient, then cost per location, narrowing the cause to a transfer, recipe, or count error

قبل أن توقّع على أرقام الشهر المقبل، أجرِ التحققات الثمانية كمراجعة ذاتية سريعة وحدّد أيًا منها لا تستطيع عمليتك اجتيازه حاليًا. تجد معظم المجموعات سببَين أو ثلاثة. أصلح أوّلاً السبب الذي يمسّ أكبر عدد من المواقع، وعادةً ما يكون النقولات غير المسجّلة أو التكلفة القائمة على الشراء، لأنه يُفسد رقم كل فرع في آنٍ واحد. نظّف هذا الإدخال الواحد ويتوقف رقم COGS الإجمالي للمجموعة عن التعارض مع تقرير المالية.

Book a Demo with Supy - fix restaurant COGS calculation mistakes across locations

Ready to optimize your restaurant operations?

مدونة

رؤيتنا التشغيلية

Your questions 
answered

Everything you need to know about Supy — from setup to integrations, pricing, and daily use. If it’s not covered here, just ask.

What Is COGS for a Restaurant, and How Is It Calculated?
+

Cost of goods sold (COGS) is what your food and beverage actually cost over a period. The reliable method is opening stock, plus purchases received, minus closing stock, measured strictly between two stock counts. That result, divided by revenue, gives your food cost percentage. It differs from the theoretical figure your recipes predict, which assumes every portion is made exactly to spec. For a single site the calculation is simple; across multiple locations, each branch count, transfer, and recipe feeds the same number, so one bad input anywhere moves the whole group figure.

Why Is My COGS Number Different at Each Location?
+

Because each location supplies its own inputs to the calculation, and any of them can be wrong. A branch might count stock a few days off period-end, receive a transfer it never logged, or carry a duplicate item that splits an ingredient cost. A price correction made at one outlet can also propagate group-wide if permissions are loose. None of these are recipe problems; they are data problems that surface as location-level variance. The fix is to standardise how every site counts, transfers, and edits prices, then compare theoretical against actual cost per location to see where the gap sits.

What Is the Difference Between Theoretical and Actual Food Cost?
+

Theoretical food cost is what your food should cost if every dish were made exactly to recipe, with no waste beyond yield allowances. It is calculated from recipe cost times units sold, tied to POS sales. Actual food cost is what you really spent: opening stock, plus purchases, minus closing stock, bounded by two counts. The theoretical figure is useful insight for spotting drift, but it can never be your actuals source, even with perfect recipes. Trouble starts when teams read the theoretical report as if it were the real number. Keep both, and know which one finance should trust.

How Often Should I Count Stock to Get an Accurate COGS?
+

Count on a consistent schedule that bounds each reporting period, and get the count as close to true month-end as practical. COGS is only accurate when the calculation runs strictly between two count dates; a count that lands days early or late pulls stock from another period into the figure, which is how a true 39% can read as 41%. Many groups count monthly for reporting and spot-count high-value or high-variance items weekly. What matters more than raw frequency is that the opening and closing counts actually bracket the period you are measuring.

Why Does Calculating COGS From Purchase Totals Give the Wrong Number?
+

Because purchases are what you bought, not what you used. If you pull COGS from purchase totals in accounting software, the number moves with buying patterns: it looks low in a light buying week and high when you stock up, regardless of actual consumption. That masks whether menu items are hitting target until a full stock cycle exposes the gap. Consumption-based costing fixes this by depleting actual ingredients as recipes are produced and sold through the POS, giving a theoretical-versus-actual split with variance you can act on rather than a figure that only reflects the timing of your orders.

How Do Unlogged Transfers Between a Central Kitchen and Branches Distort COGS?
+

When stock moves from a central kitchen to a branch but is only recorded on one end, both figures go wrong: the sending site shows stock it no longer has, and the receiving site shows usage it cannot explain. That creates phantom variance, like a branch appearing to produce more than its raw supply could allow. It also hides real problems inside noise. Requiring receiver-accepted transfers fixes it: stock only moves when both ends confirm, and the adjustment posts automatically to variance and usage on each side, so the audit trail shows exactly where every unit went.

How Can I Tell Which Mistake Is Causing My Wrong COGS Number?
+

Work three reports in order. Start with the item transaction history to find the exact entry where the on-hand balance first went negative or jumped. Then check a production report by ingredient to see whether logged consumption matches the size of the variance. Finally, compare theoretical against actual cost per location to learn whether the gap is isolated to one site or spread across the group. In sequence, those three narrow a vague monthly discrepancy to a single cause: a transfer, a recipe, or a count error. Fix the one that touches the most sites first.

هل أنت مستعد لتطوير عملياتك؟

انضم إلى أكثر من 3500 مُشغلي مطاعم يخفضون التكاليف، ويبسطون العمليات، ويتخذون قرارات أكثر ذكاءً مع Supy