

Restaurant Sales Analytics : How To Increase Sales Using Data
In the dynamic world of the food and beverage industry, making data-driven decisions can put you ahead, especially when it comes to restaurant sales analytics. In its Restaurant Industry 2030 report, the National Restaurant Association found that restaurants using data & analytics saw an average increase in sales of up to 10%. As a restaurant owner, you're constantly faced with challenges, from optimizing your menu to managing your restaurant finances effectively, and how you choose to use data could mean the end, or the boom, of your business.
In this article, we'll explore how restaurant sales analytics empower restaurant operators with valuable insights into their sales data, helping them identify which menu items are thriving and which ones might need a revamp.
Table Of Contents
- Why Are Restaurant Sales Analytics Important?
- The Metrics Of Restaurant Sales Analytics
- Visualizing Restaurant Sales Analytics - Best Practices To Build A Clear Dashboard
- Ensuring Sustainable Sales Analytics
- Conclusion
1. Why Are Restaurant Sales Analytics Important?
Restaurant sales analytics (a subcategory of Restaurant Analytics) are more than some pretty numbers on some colored charts and daunting tables. If they are well-interpreted, they can be the key to unlocking the true potential of your restaurant business as they help to achieve :
- Data-Driven Decision-Making: Restaurant sales metrics empower you to make informed, strategic decisions. They guide you in understanding what's working and what isn't in your restaurant.
- Menu Optimization: By analyzing sales data, you can identify top-performing menu items and customer favorites. This information allows you to optimize your menu, removing underperforming items and promoting those that drive profitability.
- Profit Margin Management: With a clear understanding of your average profit margins, you can set prices that maximize profits without alienating customers. You'll also identify items with room for margin improvement.
- Marketing & Promotion: Data on sales mix percentages informs your marketing and promotional efforts. You'll know which items have the most significant impact on your revenue and can develop strategies to boost their sales.
- Performance Tracking: Historical data allows you to track your restaurant's performance and recipe performance over time, making it easier to identify trends, seasonal variations, and areas for improvement.
On the contrary, in the absence of sales analytics, restaurants are essentially navigating their operations without the critical compass of data-driven insights. This means they may overlook pivotal opportunities to optimize their revenue and manage costs more efficiently.

Recommended Reading
The 21 Must-Know Restaurant Metrics
& How To Improve Them
For instance, without the ability to analyze menu item performance, a restaurant might continue offering menu items with low profit margins while disregarding high-margin, customer-favorite dishes. This oversight in restaurant analytics can lead to missed revenue potential. Furthermore, without a detailed understanding of ingredient costs, a key component of restaurant analytics, they may inadvertently overspend on expensive ingredients, affecting their overall profitability. Meanwhile, competitors who harness the power of sales analytics can readily adapt to changing customer preferences, leading to enhanced customer satisfaction and a stronger competitive edge in the ever-evolving restaurant landscape.
2. The Metrics Of Restaurant Sales Analytics
While most point-of-sale (POS) software systems offer some level of reporting, their primary focus tends to revolve around revenue-related information, a critical aspect of restaurant analytics. This includes details like the quantity of specific menu items sold, the day and time of sale, and the corresponding prices, all of which are integral to effective restaurant analytics.
While revenue data is valuable for understanding what drives income, it often falls short in providing a holistic view of profitability. It becomes imperative to marry this revenue data with cost-related information to gain a comprehensive perspective on how a menu is truly performing and influencing the restaurant's overall financial health.
Recommended Reading
Restaurant Software : All-in-One or Best-in-Class ?
Hear from a Head of Sales
To make the most of restaurant sales analytics, let's dive into the following metrics, what makes them tick, how to make sense of them, and how to get better results :
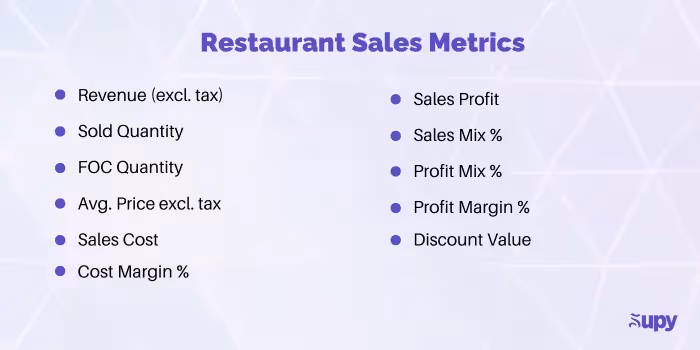
- Revenue (excl. tax): Driven by customer demand, pricing, and menu item popularity. Interpretation involves recognizing which items are most profitable. To improve, promote high-revenue items and consider pricing adjustments.
- Sold Quantity: Customer preferences, marketing, and portion sizes are key drivers. High sales quantities indicate popularity. Interpret trends and consider optimizing portion sizes or running promotions for lower-performing items.
- FOC Quantity: Influenced by promotions and customer service. Excessive free items can be detrimental. Carefully monitor FOC numbers and ensure they don't negatively impact profitability.
- Avg. Price excl. tax: Determined by pricing strategies and consumer willingness to pay. To improve, consider adjusting prices to maximize profit without deterring customers.
- Sales Cost: Ingredient costs, portion sizes, and procurement efficiency drive sales cost. Control ingredient costs by analyzing suppliers and ingredient quality to reduce costs without sacrificing quality.
- Cost Margin %: High cost margin percentages indicate costly ingredients. Identify these cost drivers and seek alternatives or menu adjustments to reduce costs.
- Sales Profit: The difference between revenue and sales cost, influenced by pricing and ingredient costs. To improve, increase revenue through menu item promotions or pricing adjustments, and optimize ingredient procurement to lower costs.
- Sales Mix %: High sales mix percentages indicate menu item popularity. Use this data to guide menu optimization efforts and focus on promoting top-performing items.
- Profit Mix %: Reflects the contribution of a menu item to overall profit. Focus on promoting high-profit margin items to enhance profitability.
- Profit Margin %: Determines menu item profitability. High-profit margin items generate more profit. To improve, enhance profitability through pricing strategies, portion size adjustments, and ingredient cost management.
- Discount Value: Influences overall revenue. While promotions attract customers, excessive discounts may negatively impact profits. Review discount data regularly to balance customer attraction and profitability.
Take Informed Decisions Using Supy's Built-In Restaurant Performance Dashboards


3. Visualizing Restaurant Sales Analytics - Best Practices To Build A Clear Dashboard
In the previous section, we looked at which metrics should be included in a restaurant sales dashboard. But how do we make these metrics visually appealing and easy to understand ? Should we stick with simple tables filled with numbers, or should we go all out with colorful graphs and pie charts?
Here are some practical tips on how to visualize these metrics in a way that makes them not just informative but also actionable.
Filtering
Before you immerse yourself in the wealth of data within your restaurant sales analytics, it's crucial not to let the numbers overwhelm you. The key is to remain focused on your objectives. To do this effectively, consider utilizing the following filters strategically:
- Date Range: The period you choose to examine is critical. Whether you're interested in the past week, the last month, or a more extended timeframe like a quarter can significantly impact the insights you gain. A broader date range might help identify trends or seasonal variations, while a narrow focus on a specific day can highlight daily fluctuations.
- Restaurant Branches: For multi-location restaurant groups, the decision to analyze sales data aggregated across all branches or branch by branch is essential. Assess whether you want a broad overview of your entire operation or if you're seeking insights specific to particular locations. This choice can uncover disparities in branch performance and allow for targeted improvements.
- Menu Categories: Your data can be examined in a more granular fashion by exploring specific menu categories. For instance, you may choose to dive into sales data related to main courses, starters, or desserts individually. This level of detail enables a deeper understanding of which menu categories are thriving and which may require attention, helping you refine your menu offerings to cater to customer preferences effectively.
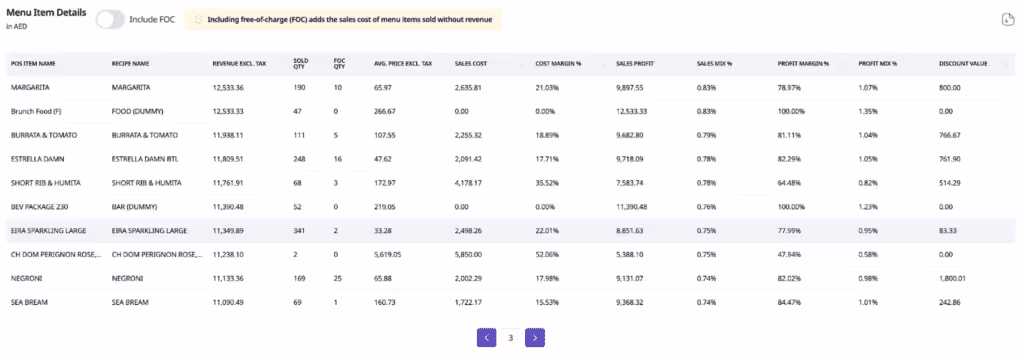
Menu Items Table
The "Menu Items Table" is a powerful tool for comprehensive side-by-side comparisons of individual menu items across various crucial data points, offering detailed insights into how they each drive revenue and costs. While it enables informed decision-making, it's important to note that this granular approach may occasionally lead to complexities. A potential downside is that the abundance of data could be overwhelming if not well-organized, making it critical to strike a balance between granularity and simplicity in data analysis.
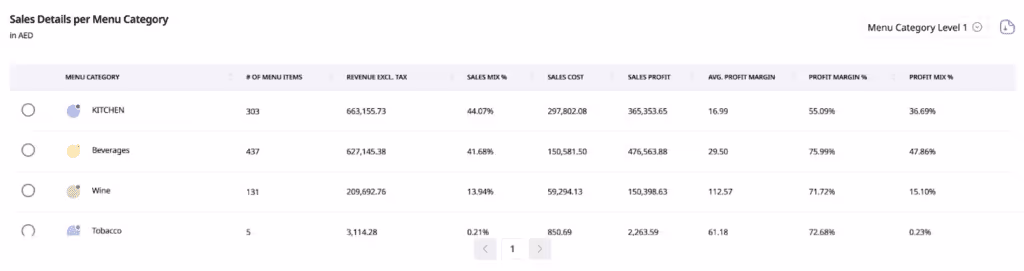
Menu Categories Table
The menu categories table is a valuable asset, particularly suited for restaurants with well-organized and uniform menu categories. This table simplifies the analysis of sales data by aggregating information within these categories, allowing for an efficient evaluation of the collective performance of related menu items. This level of grouping streamlines the decision-making process, as it provides high-level insights into the revenue and profitability of specific sections of the menu. However, it's important to note that this approach may lead to incorrect insights if menu categories are not well-structured or lack homogeneity. It's crucial to ensure that the categories accurately reflect the characteristics of the items they encompass to derive meaningful and accurate conclusions about performance.
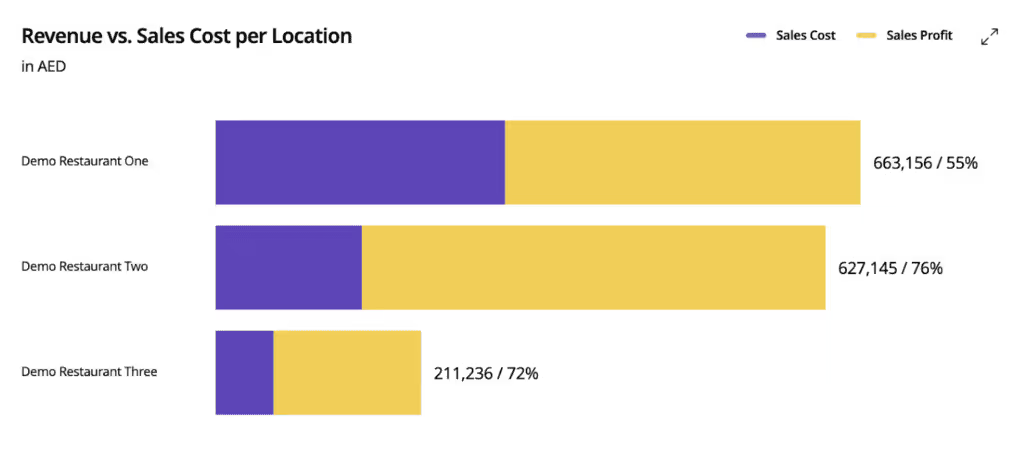
Location Comparison Chart
The location comparison chart is a valuable resource for multi-location restaurant groups, enabling straightforward side-by-side assessments of revenue, sales cost, and sales profit for each location. Its benefits include quick identification of top-performing locations and trend recognition over time, facilitating informed decision-making. However, it's crucial to remember that this high-level analysis may oversimplify complex factors that influence location performance, such as local competition and customer demographics. Therefore, it should be used in conjunction with supplementary data and a consideration of nuanced external factors for a more comprehensive perspective on location success and improvement strategies.
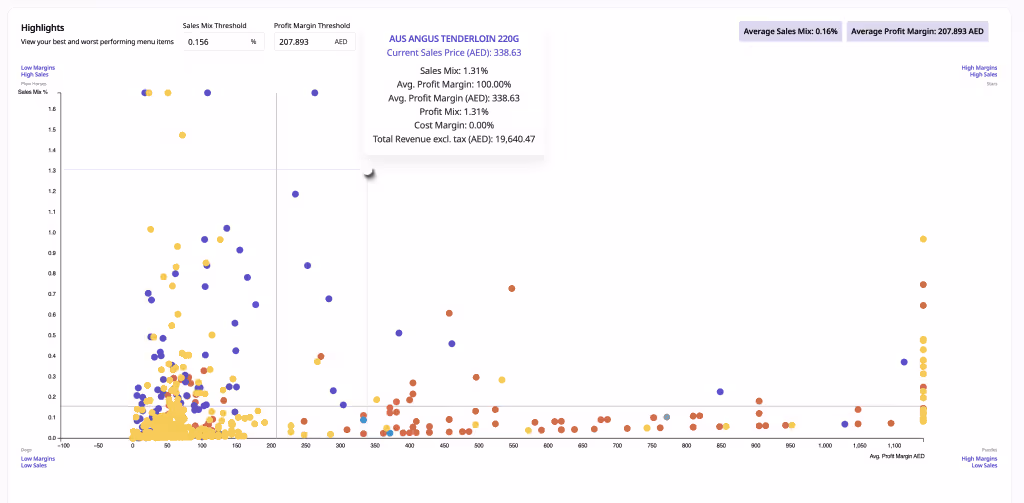
Menu Engineering Chart
The menu engineering chart stands as a true marvel within the realm of restaurant analytics, offering a sophisticated tool for assessing and optimizing menu performance. By categorizing all menu items into four distinct quadrants based on two critical criteria - average profit margin and sales mix percentage - this chart, a cornerstone of restaurant analytics, provides a host of benefits. These criteria help restaurant owners and managers evaluate and strategically position each menu item in relation to the others, making it easier to identify opportunities for improvement and growth. Let's break down the four quadrants:
- Stars: Menu items in this quadrant are the high performers. They boast both a high average profit margin and a significant sales mix percentage. These items are your restaurant's shining stars, and it's essential to nurture and promote them further to maximize profits.
- Plow Horses: Plow horse items have a high sales mix percentage but a lower average profit margin. These items may be popular with customers but may not be as profitable. Strategies for plow horses may include price adjustments, cost reductions, or promoting complementary items to boost overall profitability.
- Puzzles: Menu items in this quadrant have a high average profit margin but a low sales mix percentage. While they are profitable, they might not be receiving the attention they deserve from customers. Consider marketing or promotional efforts to increase their sales and overall contribution to your revenue.
- Dogs: Dogs are menu items with both a low average profit margin and a low sales mix percentage. These items are underperforming and may be dragging down your profitability. It's often wise to assess whether they should remain on the menu, be repositioned, or have their recipes adjusted to become more profitable.
4. Ensuring Sustainable Sales Analytics
In this section, we delve into data hygiene principles and red flags to ensure that your restaurant's data remains reliable and your decision-making maintains unwavering precision, thus safeguarding the enduring value of your sales analytics. Overall, it is important to look out for :
- Consistent Categorization: Start by ensuring that your menu items are consistently categorized. Accurate categorization is vital for meaningful comparisons and accurate insights. Without consistency, your data could become muddled, leading to incorrect conclusions.
- Data Cleaning and Verification: Periodically review data accuracy, including sales figures, ingredient costs, and other crucial data points. Also, ensure that recipes are correctly built and that mappings between inventory and POS systems are accurate.
- External Factors: Stay mindful of external factors like local events, economic conditions, and competitor actions, as they can significantly influence customer behavior and as a result the sales analytics for a given period.
- Data Security: Ensure data security to protect sensitive information, preventing data breaches and maintaining trust with customers and partners.
5. Customer Complaints: An increase in customer complaints about pricing, menu item availability, or bills can reveal discrepancies between sales analytics and customer experiences. A reduction in quality or portion sizes of a certain menu item may not impact profitability in the short term but in the long run it may hurt the restaurant’s reputation and as a result its profitability.
By paying attention to these key considerations, you can safeguard the accuracy and reliability of your sales analytics. Maintaining data hygiene is a critical aspect of ensuring that your insights continue to provide sustainable value, allowing you to make informed decisions that enhance your restaurant's performance and profitability.
5. Conclusion
In the world of restaurant management, mastering sales analytics is your ticket to success. It's about understanding your data, optimizing your menu, and making informed decisions. But it doesn't stop there. Data hygiene is key. Consistent categorization, data updates, cleaning, and vigilance for red flags are your allies in maintaining data accuracy. With this knowledge and vigilance, you're well-equipped to extract long-term value from sales analytics. The power of data-driven insights is your guide to culinary triumph. Keep analyzing, keep optimizing, and keep succeeding.
About Supy
In today's culinary world, precision and efficiency are more vital than ever, making Supy's restaurant inventory management system indispensable.
Supy, a tailored restaurant inventory management software, offers an intuitive interface that transforms inventory tracking from a chore to a breeze, suitable for both seasoned managers and newcomers. Its real-time analytics shine a spotlight on inventory statuses and sales trends, empowering timely, data-driven decisions.
Beyond tracking, Supy enhances supplier interactions, from ordering to delivery monitoring all whilst ensuring optimal restaurant inventory management. Its predictive analytics stand out, helping forecast ingredient needs and reducing wastage. And with cloud integration, every stakeholder stays connected to the inventory data, anywhere and anytime.
Supy's adaptability, offering reports from daily stock views to yearly analyses, signifies it's not just another system, but a cornerstone for modern restaurant inventory management, promoting profitability with sustainability.
FAQ
What is restaurant sales analytics?
Restaurant sales analytics involves analyzing data to track sales trends, customer preferences, and revenue streams, helping restaurant operators make data-driven decisions to boost profitability.
(Explore more about Improving Restaurant Operations Management for broader insights).
How does sales analytics benefit restaurants?
Sales analytics helps identify top-selling items, optimize pricing, and refine marketing strategies, ultimately enhancing customer satisfaction and profitability.
(Check out our Restaurant Marketing Strategy guide for related strategies).
What tools can be used for restaurant sales analytics?
Tools include point-of-sale (POS) systems, customer relationship management (CRM) software, and inventory management systems, which together provide comprehensive sales data.
(Read more on our Free Restaurant Inventory Management Template for a free tool to get started).
How can sales analytics improve menu engineering?
By analyzing item popularity and profitability, restaurants can adjust their menus to emphasize high-profit items and remove underperformers.
(Learn more about Menu Engineering and its impact on profitability).
What role does inventory management play in sales analytics?
Inventory management aligns with sales analytics by tracking ingredient usage and costs, allowing restaurants to maintain optimal stock levels.
(Visit our Inventory Management page to learn about managing inventory effectively).
How does customer behavior data enhance sales analytics?
Tracking customer preferences helps customize promotions, improve service, and increase loyalty, directly boosting sales and profitability.
(Discover how to improve customer engagement with our Restaurant Marketing Strategy guide).
How can predictive analytics be applied in restaurants?
Predictive analytics forecast demand, allowing for better inventory planning, labor scheduling, and targeted promotions based on expected sales.
(Explore our Central Kitchen Management post for predictive applications in kitchen operations).
What are key performance indicators (KPIs) in restaurant sales analytics?
Common KPIs include average order value, customer acquisition cost, sales per labor hour, and table turnover rate. These metrics provide actionable insights for business improvement.
(Learn more about Improving Operational Efficiency in restaurants).
Can sales analytics help reduce food costs?
Yes, by identifying high-cost, low-profit items, restaurants can make informed menu adjustments and reduce waste, lowering overall food costs.
(Visit 10 Ways to Reduce Food Costs for additional strategies).
How do POS systems contribute to restaurant sales analytics?
POS systems collect and track transaction data, giving insights into popular items, peak times, and seasonal trends for better sales management.
(Check out our POS Integration features for integrated solutions).
How does real-time data impact sales analytics?
Real-time data allows restaurants to respond quickly to changes in demand, adapt menus, and avoid stockouts, enhancing customer satisfaction.
(Learn more on our Live Inventory Tracking page for insights on managing stock).
What is the importance of sales trend analysis?
Analyzing sales trends helps restaurants understand customer preferences, predict demand, and plan accordingly for peak seasons and menu changes.
(Explore our Menu Engineering guide for menu planning based on trends).
Can sales analytics improve labor management?
Yes, analyzing sales data by time periods allows for optimized labor scheduling, ensuring staff is available during peak times without overstaffing during slow periods.
(Read our Restaurant Operations Guide for more insights on labor management).
How can sales data help refine marketing efforts?
By understanding customer purchasing patterns, restaurants can tailor promotions, loyalty programs, and advertisements to increase foot traffic and sales.
(Check out our Marketing Strategy Guide for detailed tips on targeted marketing).
What is customer lifetime value (CLV) and how is it measured?
CLV estimates the total revenue a customer is expected to generate over their lifetime, helping restaurants make strategic decisions about marketing and customer retention.
(Discover retention strategies in our Marketing Strategy Guide).
How does product mix analysis aid restaurant profitability?
Product mix analysis reveals the performance of each item, allowing operators to spotlight best-sellers and remove or improve low-performing dishes.
(Learn about Menu Engineering for Profit).
How can restaurants use seasonal sales data effectively?
Restaurants can adjust menus and promotions based on seasonal trends, offering timely items that increase sales and satisfy customer expectations.
(Find seasonal menu tips in our Central Kitchen Management Guide).
What are top reporting features to look for in sales analytics software?
Look for features like real-time sales tracking, automated reporting, customizable dashboards, and inventory integration to maximize insights and simplify decisions.
(Visit our Inventory Management Solutions page to learn more about essential tools).
How does sales analytics support financial forecasting?
Accurate sales data allows for more precise revenue forecasting, budgeting, and financial planning, essential for sustainable growth.
(Learn about Predictive Analytics for financial forecasting).
Why is data centralization important in sales analytics?
Centralizing data from multiple locations helps restaurant chains maintain consistency in reporting, track overall performance, and make faster, informed decisions.
(Read about the benefits of Centralized Procurement).