.jpg)


Restaurant Labour Cost: How to Calculate, Benchmark, and Reduce It

Most operators obsess over food cost percentage and let labour drift above 35% unnoticed. It is easier to see a supplier invoice than a creeping overtime pattern or a misclassified staff-meal spend. The operators who consistently hold prime cost below 60% treat labour cost percentage the same way they treat food cost - as a weekly number tracked by location, not a quarterly line on the P&L. This guide covers the formula, format-specific benchmarks, five strategies to bring it down, and the hidden costs that inflate the number without an obvious explanation.
Restaurant labour cost percentage is total labour spend divided by total revenue, expressed as a percentage. For most restaurant formats, the healthy range is 28-35%. If yours is above 38%, you are likely absorbing hidden costs - staff meal misclassification, commissary overhead, or overtime - that push the number up without an obvious explanation.
What is Restaurant Labour Cost Percentage?
Labour cost percentage measures how much of every dollar of revenue goes towards employing your team. It is not just wages. The full calculation includes:
- Hourly and salaried wages across all staff
- Payroll taxes and employer contributions
- Employee benefits (health cover, paid leave, pensions)
- Manager and supervisor salaries
- Recruitment and training costs
- Staff meals - though these are frequently misclassified (more on this below)
The reason finance directors and owners track this as a percentage rather than a flat dollar amount is that it adjusts for revenue. A location generating $80,000 per month with a $28,000 payroll is running at 35% - exactly the same as a location generating $120,000 with a $42,000 payroll. The absolute number hides the efficiency story; the percentage reveals it.
Labour cost percentage also sits at the heart of prime cost - the combined measure of food cost and labour cost as a proportion of revenue. To understand prime cost, you need an accurate food cost percentage formula alongside your labour figure. Without both, you are managing half the picture.
The Labour Cost Formula
Labour cost percentage = (Total labour cost / Total revenue) × 100
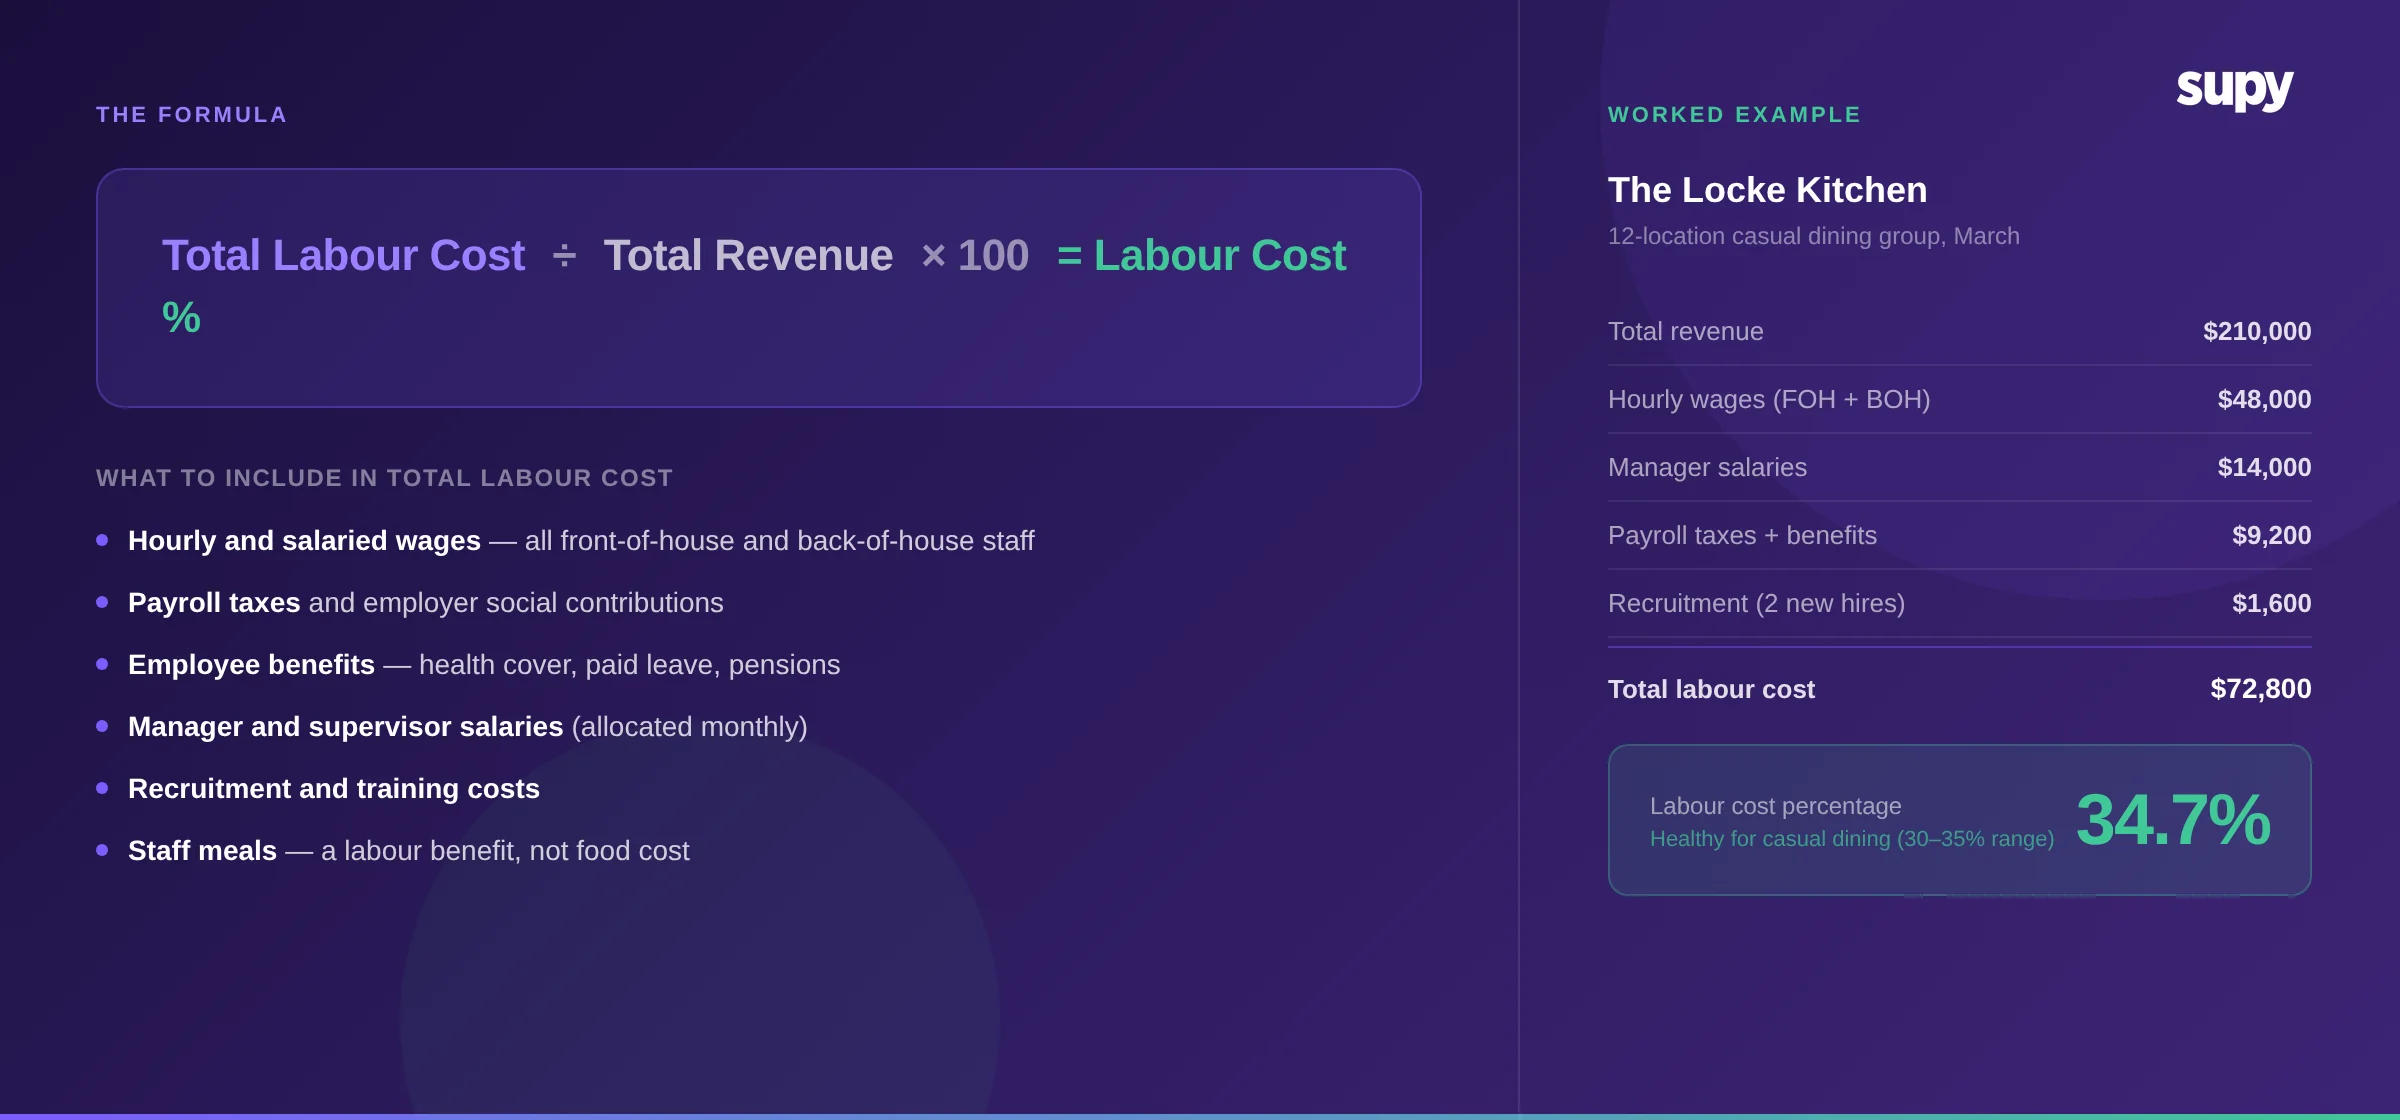
Worked example:
The Locke Kitchen is a 12-location casual dining group. In March, one of its busiest sites recorded:
- Total revenue: $210,000
- Hourly wages (kitchen and front of house): $48,000
- Manager salaries (allocated monthly): $14,000
- Employer payroll taxes and benefits: $9,200
- Recruitment costs (two new hires): $1,600
$72,800
That is within healthy range for casual dining. If overtime had not been managed that month and payroll had been $76,000, the percentage would have climbed to 36.2% - not a crisis, but a signal worth investigating before it becomes a trend.
Industry Benchmarks by Format
Labour cost percentage varies significantly by restaurant type. The ranges below reflect what well-run operations typically achieve. These are not aspirational figures - they are the working range for groups that track labour by location and manage scheduling against demand data.
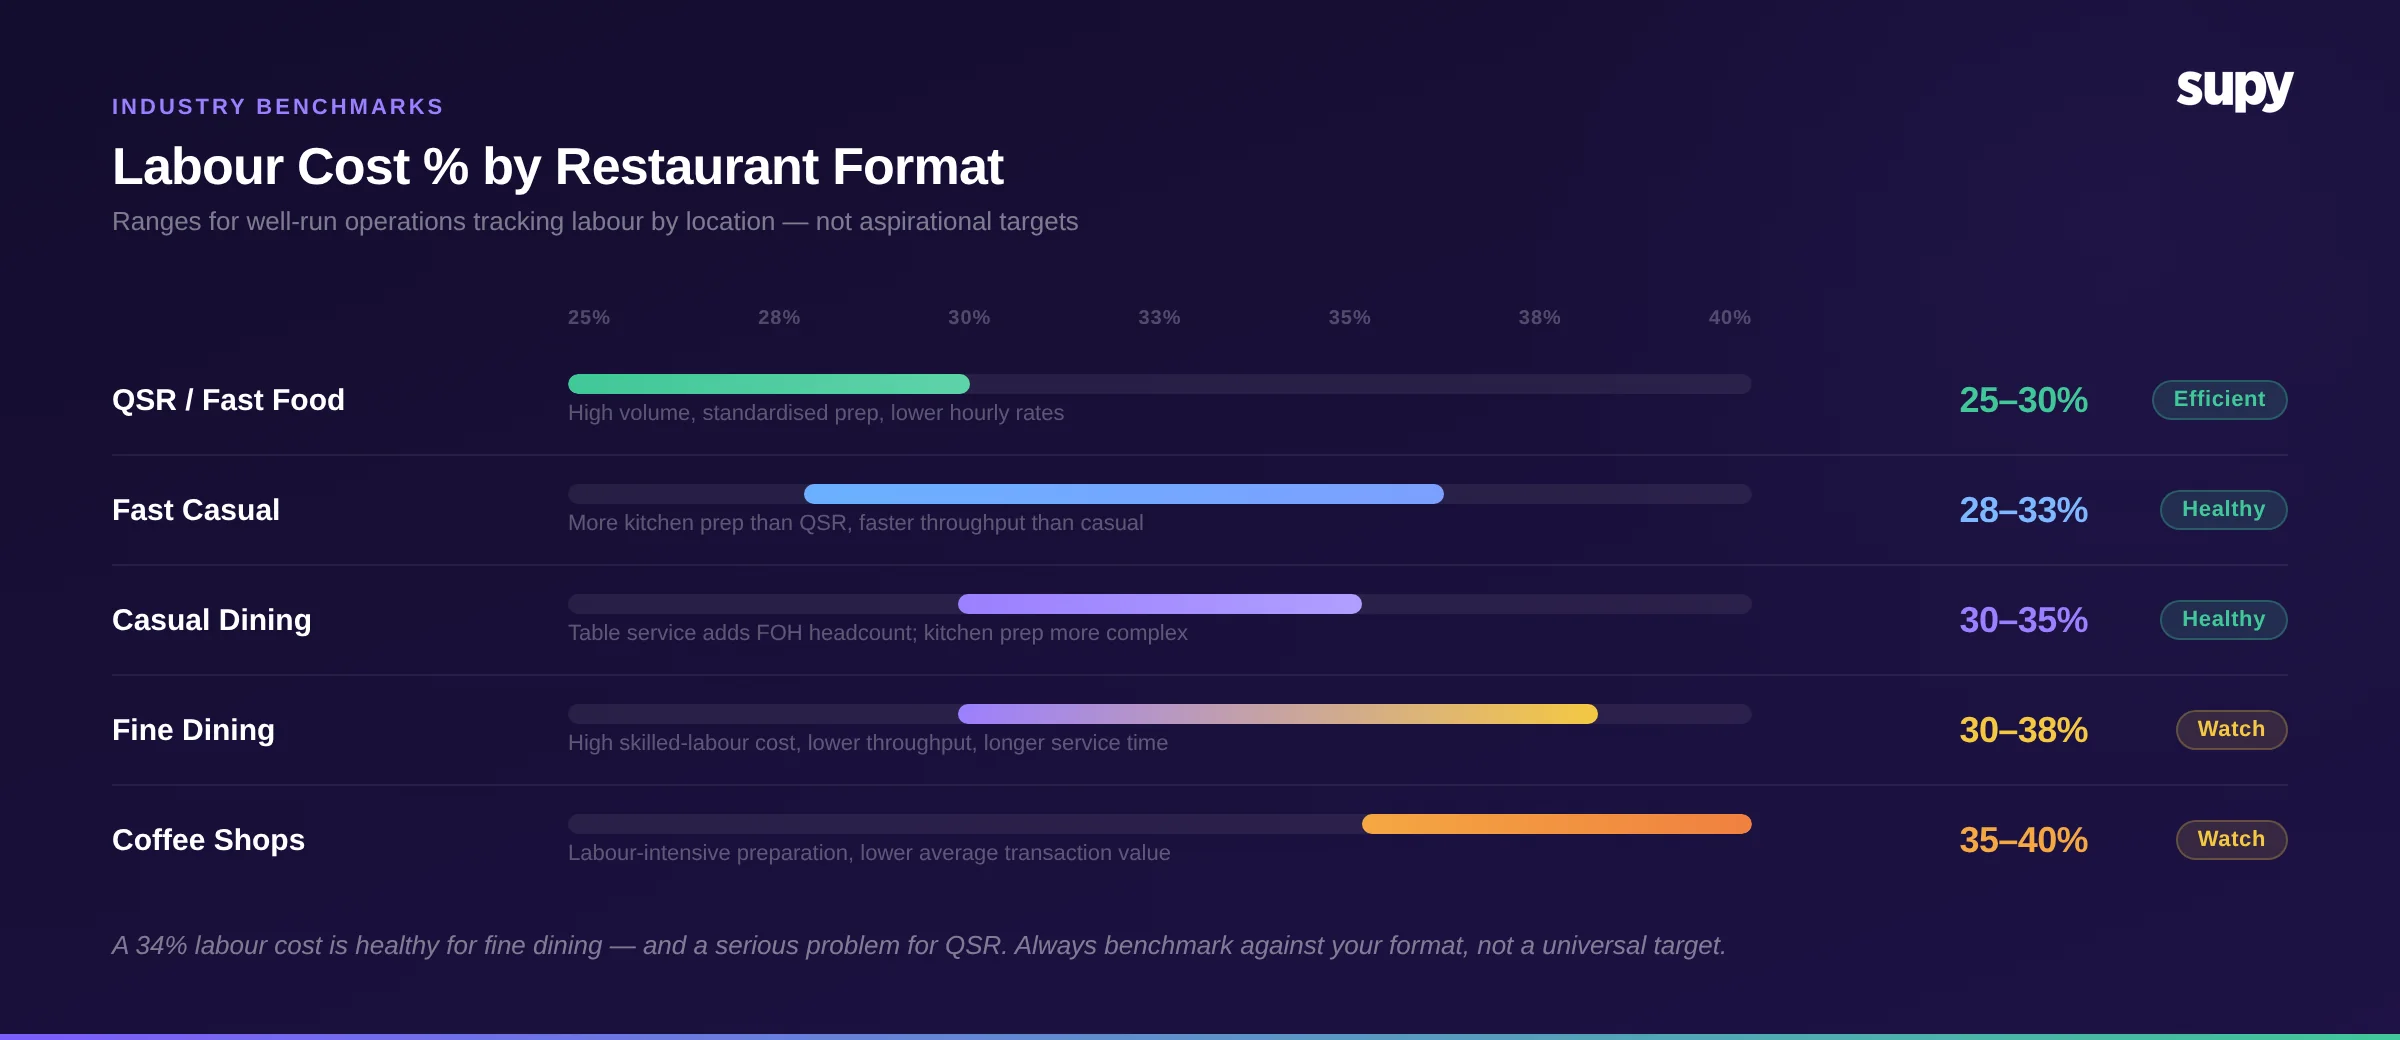
Operators who benchmark by format rather than against a single universal target find outliers faster. A 34% labour cost at a QSR location is a serious problem. The same number at a fine dining site is healthy. Without format-specific context, the number tells you nothing.
Five Strategies to Reduce Labour Cost Percentage
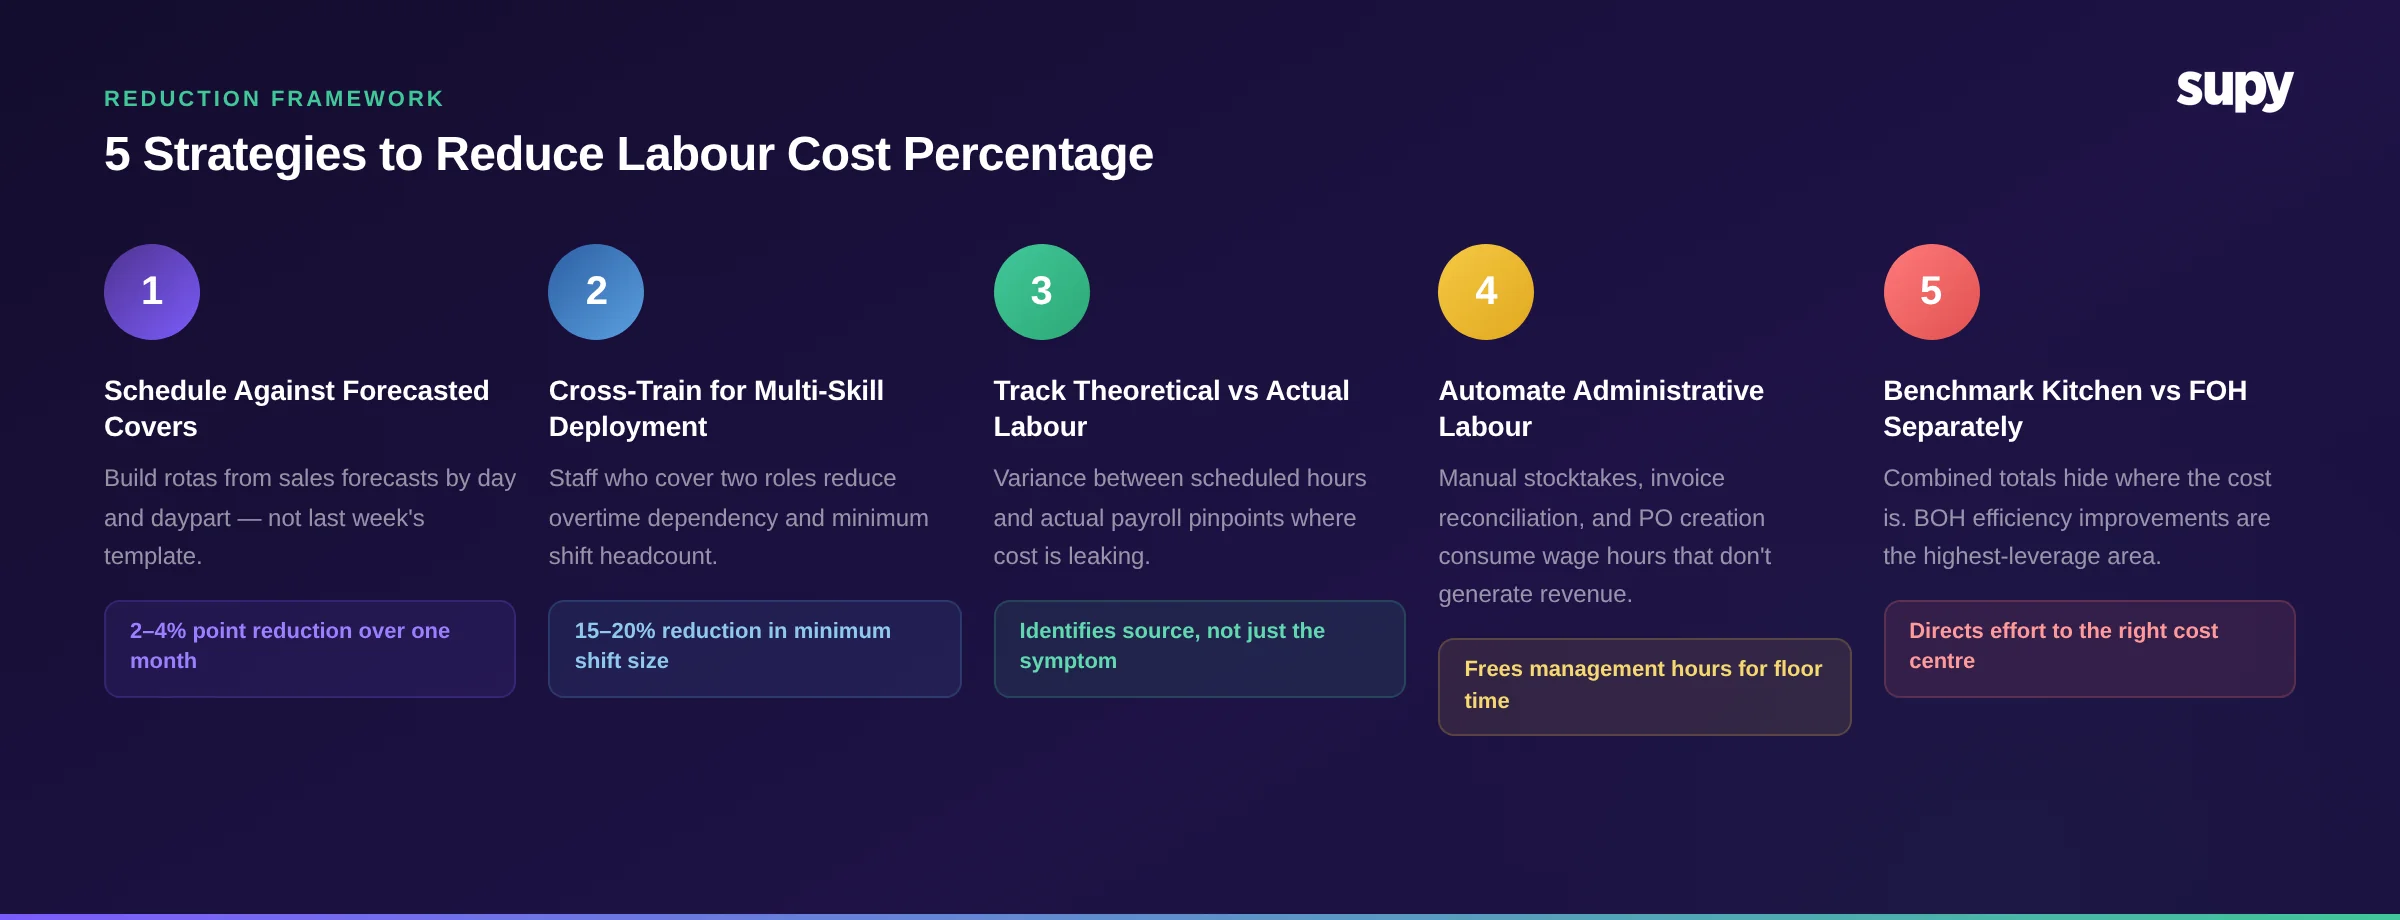
1. Schedule Against Forecasted Covers, Not Last Week's Rota
The most direct lever on labour cost is matching staffing levels to expected demand. Operators who schedule based on historical averages (or the same rota every week) consistently overstaff during slow periods and understaff during surges.
When scheduling is built on a sales forecast by day and daypart, the question changes from “how many people do we usually have on a Tuesday?” to “how many covers are we forecasting this Tuesday, and how many people do we need for that volume?” The difference in labour cost between these two approaches can be 2-4 percentage points over a month.
2. Cross-Train for Multi-Skill Deployment
A team where every member can cover two roles costs significantly less per cover than one built around single-skill specialists. Cross-training is an upfront investment in training time - but it pays back in scheduling flexibility, reduced overtime when someone calls in sick, and lower recruitment dependency for niche roles.
Operators who introduce cross-training systematically (tracked against a skills matrix by location, not informally assumed) typically reduce minimum headcount requirements per shift by 15-20% at sites where it is fully implemented.
3. Track Theoretical vs Actual Labour Per Location
The same logic that drives food cost variance tracking applies to labour. If a location is consistently running above its theoretical labour cost - based on its scheduled hours and role mix - the variance points to a specific cause. Common sources: unauthorised overtime, shift hand-overs running long, or management hours not allocated to the right cost centre.
One multi-site operator identified that their reported COGS was “all over the place” in part because there was no standardised way to separate labour cost components between locations. With no way to isolate labour by site, they could not benchmark or identify which branches were driving cost. Establishing that baseline is the first step in reducing it.
4. Reduce Administrative Labour With Automation
Operational software does not only reduce food cost. Inventory counting, purchase order creation, invoice reconciliation, and stock transfer logging are all labour-intensive tasks when done manually. The staff hours spent on these processes do not show up on the labour cost benchmark charts - but they are real wage spend that does not directly generate revenue.
Reducing food costs is not only about ingredients. Removing manual reconciliation steps from procurement and inventory workflows frees up kitchen management time for higher-value work - and reduces the administrative labour that inflates the percentage without improving the guest experience.
5. Benchmark Kitchen Labour Separately
Front-of-house and back-of-house have very different labour cost structures. Combining them into a single percentage masks the operational story inside each. A location where front-of-house is running efficiently but the kitchen is over-staffed for its prep volume looks average in aggregate - until you separate the two.
Operators who track kitchen labour cost as a percentage of kitchen revenue (or as a ratio to covers prepared) find that kitchen efficiency improvements are the highest-leverage area in the labour cost equation. This is particularly true for groups with central kitchen operations, where the commissary labour cost needs to be accounted for separately from branch kitchen labour.
The Hidden Labour Costs Most Operators Miss
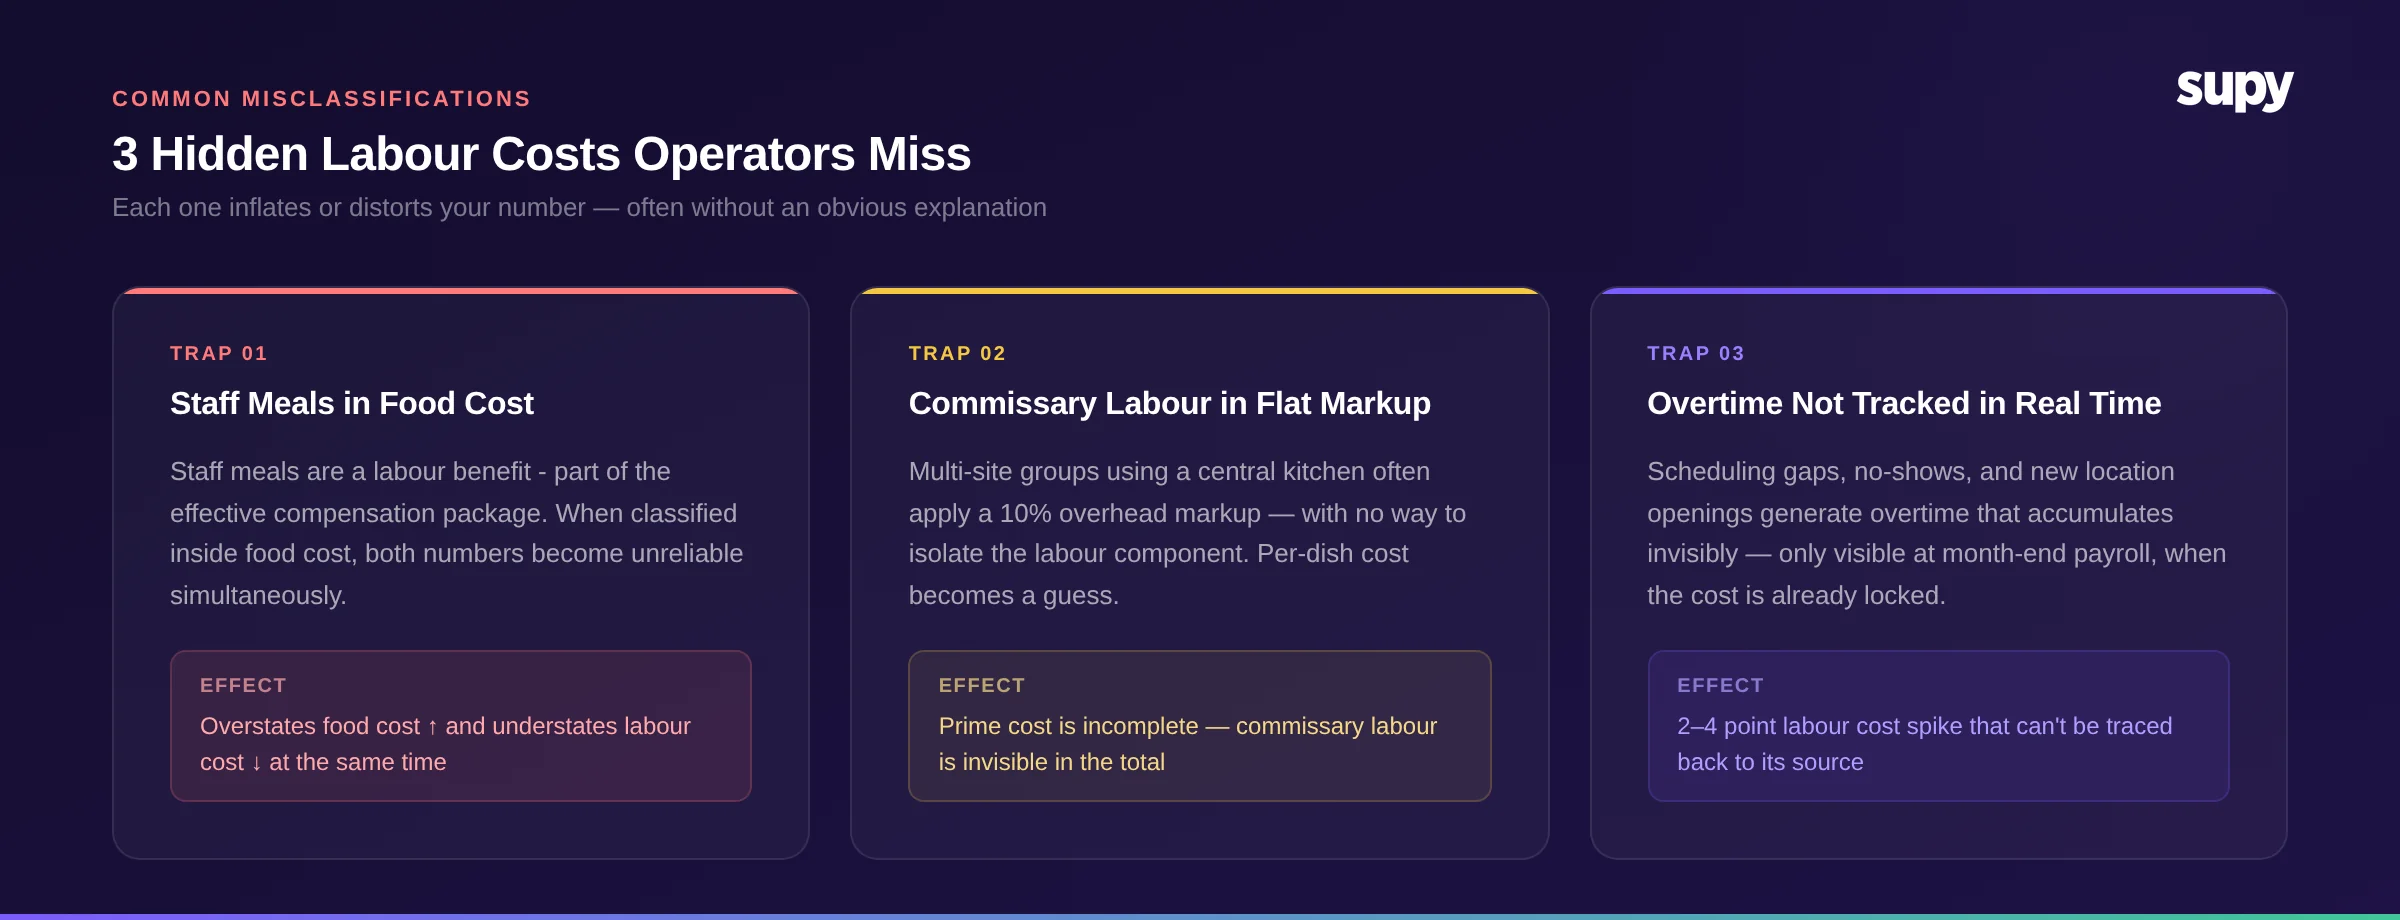
1. Staff Meals Classified as Food Cost
This is the most common misclassification in the industry - and it distorts both numbers simultaneously.
Staff meals are a labour benefit. They represent part of the effective compensation package for your team. When operators include staff meal spend inside the food cost line, they overstate food cost and understate labour cost. Both figures become unreliable for benchmarking or strategic decisions.
Across multiple training and onboarding calls, this pattern appears repeatedly. One operator's team had been including all staff meal spend in their food cost calculation for several months, inflating their reported food cost percentage by an amount they could not quantify until they ran the numbers separately. The training session showed that this is not an edge case - most operators who have not explicitly set up their accounts to separate these lines will default to food cost treatment.
The correct approach: staff meals sit inside labour cost as an employee benefit. If a $12 staff meal per shift replaces $3 in wages (because team members factor this in when deciding where to work), it is compensation, not food spend.
2. Commissary and Central Kitchen Labour
Multi-location groups with a central kitchen face a specific blind spot: the labour cost of producing items in the commissary is often buried inside a flat markup rather than tracked as a labour line.
A common pattern observed across operators is applying a 10% markup on commissary output to offset the overhead of labour, rent, and utilities in the production facility. Neither the operator nor their finance team had a way to calculate the labour component of that markup separately - they were using a flat percentage because the underlying data was not available in their systems. The result: their per-dish cost at branch level was an approximation, not a calculation.
If your group runs a central kitchen, the labour cost of commissary production belongs inside your total labour figure. If it does not appear there, your prime cost is incomplete.
3. Overtime Not Tracked in Real Time
Overtime is the most predictable surprise in restaurant payroll. Scheduling gaps during peak periods, unexpected no-shows, or new location openings without adequate trained headcount all generate overtime that accumulates invisibly until the payroll run.
The operators who manage overtime best see it against forecasted covers in real time - not at month end. When labour cost is tracked by location alongside revenue, overtime risk is visible at the shift planning stage rather than locked into payroll by the time it is discovered. At month end is already too late to act.
Managing Cost Visibility at Multi-Location Scale
A single-site operator can walk the floor and sense whether the team is overstaffed for the volume. At five sites, that intuition stops working. At fifteen, it is impossible.
The operators who benchmark cost by location consistently find one or two sites running significantly above group average - often for reasons that are fixable once visible. Common culprits: a site manager who defaults to overstaffing as risk management, a new location still absorbing the elevated labour cost of training a new team, or a location with a higher proportion of skilled roles that has never been rebenchmarked against its actual revenue contribution.
A 31-location operator pushed back on adopting operational process changes because they could not quantify the return on the staff time the processes required. The exact concern raised was whether the labour invested in new workflows would generate a measurable return. Without location-level cost visibility, they had no baseline to measure against. The question was not unreasonable - it was unanswerable with the data they had.
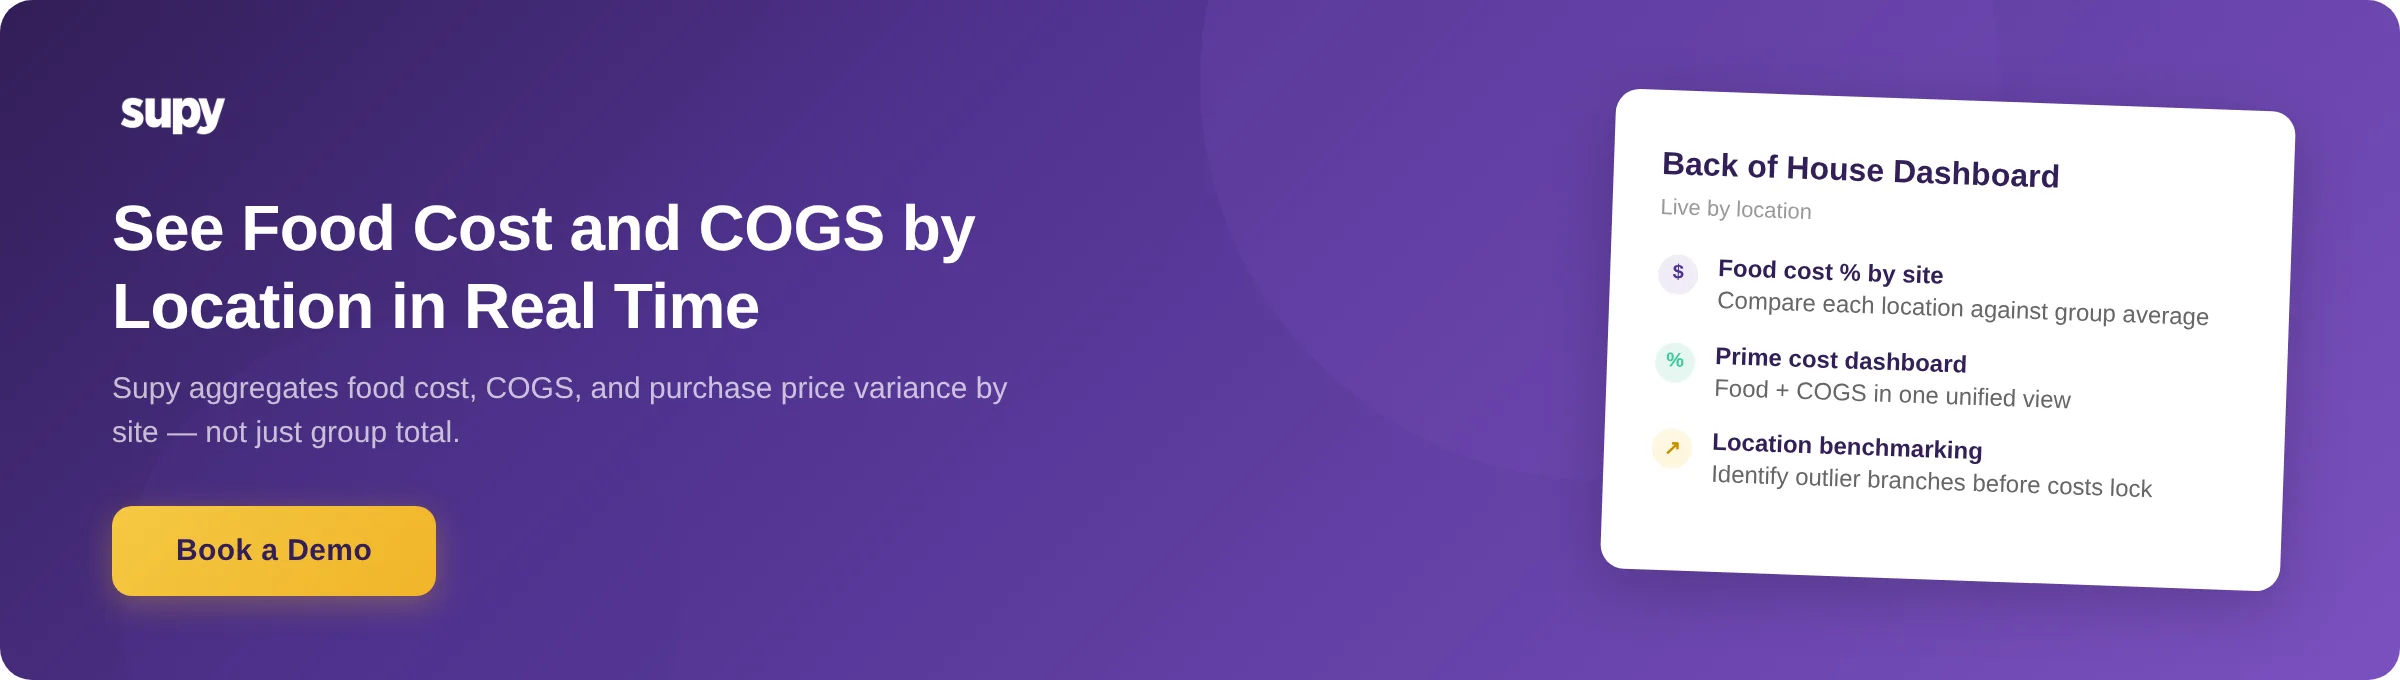
Getting Food Cost and COGS Visibility at Location Level
Food cost and COGS tracking in most restaurant groups sits in systems that do not connect operational data across locations. Finance directors see the monthly totals, but cannot see them by location, or alongside purchase price variance and recipe costs in a single view.
Supy's BI module aggregates operational cost data - food cost, COGS, and purchase price variance - by location. It provides a unified view of procurement and inventory cost that makes food cost percentage and prime cost visible at location level in real time, not at month end. Operators with 10 or more locations consistently report that the ability to see which sites are running above group average on combined cost is the first step towards understanding why - and fixing it.
See how Supy gives your finance team food cost and COGS visibility by location without spreadsheets or manual consolidation.