.jpg)


Food Service Inventory Software: What Multi-Site Operators Actually Need

What Food Service Inventory Software Has to Do To Provide Value
Food service inventory software tracks what stock a hospitality business holds, what it is worth, and how it moves, across every location, in near real time. At a single site a spreadsheet can manage most of this. Across several sites it cannot: the moment you run more than one kitchen, the software has to hold one accurate picture that every branch updates and everyone trusts.
Most buyer guides reduce the category to a feature checklist: barcode scanning, low-stock alerts, a mobile count app. Those are table stakes, and almost every product on your shortlist will tick them. They are not what separates a tool that works for a group from one that only ever worked for a single restaurant. The real test is the governance layer that only appears once stock, counts, and orders are spread across locations, and that is where most inventory management software for restaurants quietly falls short.
The five capabilities below are the ones worth weighting heavily when you evaluate. If a product is thin on these, it does not matter how polished the count screen looks.
Five capabilities that only matter once you run more than one site
| What to require | Why it matters at scale |
|---|---|
| Live stock across every site | Decisions run on current data, not yesterday's export |
| Theoretical vs actual you can investigate | Find and close the gap, not just print a report |
| Outlet ownership of shared stock | Accountability when stock is co-mingled in one store |
| Par levels that flex by day | Orders match real demand, not one flat number |
| Invoice and GRN push to accounting | Removes admin instead of adding re-entry |
Why a Live Stock Picture Beats a Spreadsheet You Trust for an Hour
A stock figure is only useful while it is still true. A count exported to a spreadsheet is accurate at the second it is produced and drifts from that moment on, as items get used, transferred, and received. By the time a regional manager opens the sheet, decisions are being made on a number that has already moved.
The capability to demand is a live picture rather than a snapshot: stock-on-hand quantities, their value, and the movement history behind them, visible across every site without anyone exporting anything. Supy, for example, shows stock across six live views and flags items that fall below minimum or climb above par, so the picture is current when you look at it, not current as of whenever a branch last had time to update a sheet.

When Theoretical and Actual Stop Matching Across Your Sites
Theoretical stock is what the system says you should have, based on what you bought minus what your recipes say you sold. Actual stock is what a physical count finds on the shelf. The gap between the two is variance, and at scale it is the single most revealing number in the whole system.
Reporting the gap is easy. Investigating it is the hard part, and it is what you should be testing for. One multi-site group's operations team runs daily, weekly, and monthly counts with structured action plans purely to keep this gap closed, because a variance you cannot drill into is just an alarm with no off switch. The software has to let you see variance by item, by site, and over time, and trace it back to a miscount, a bad recipe mapping, or genuine loss. If you want the mechanics of why the two numbers diverge, we cover it in depth in theoretical vs actual food cost variance.
Where theoretical and actual stop matching
| Item | Theoretical | Actual | Variance |
|---|---|---|---|
| Chicken Breast | 42 kg | 38 kg | -4 kg / -$34 |
| Mozzarella | 25 kg | 22 kg | -3 kg / -$41 |
| Olive Oil 5L | 18 | 17 | -1 / -$29 |
| Tomato Passata | 60 | 57 | -3 / -$11 |
| Total gap | -$115 |
Who Owns the Stock in a Shared Central Warehouse
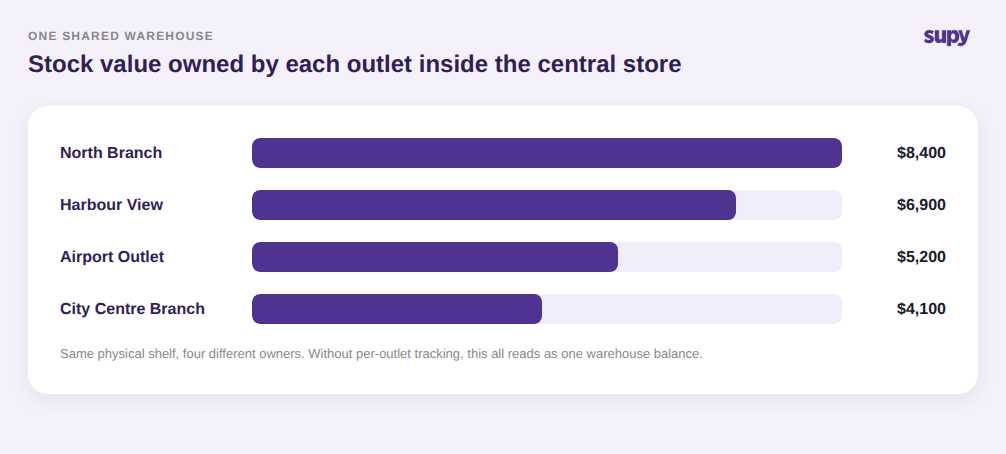
Groups that run a central kitchen or a shared warehouse hit a problem single-site tools never have to solve: when several outlets keep stock in the same physical space, who owns which portion of it. Operators describe not being able to trace inventory ownership once stock is co-mingled, and without that trace, no branch is accountable for its own shrinkage or its own tied-up cash.
Ask any product you evaluate how it handles this. The stock sitting on one shelf may belong to four different outlets, and the software should read it that way, not as a single warehouse balance nobody owns. This is a genuine multi-site requirement, not a nice-to-have, and it is worth reading how it plays out in practice in our note on outlet inventory ownership in a shared warehouse.
Why Flat Par Levels Misfire When Demand Moves by the Day
A par level is the amount of an item you want on hand before you reorder. Cheap tools treat it as one fixed number per item. Real operations do not work that way. One operator runs a daily requisition process where par levels change by day of week, then reallocates surplus production between kitchens on the fly. A single flat par set for the average day runs a busy site short every weekend and leaves a quiet one over-ordered midweek.
If you'd rather not work par out by hand, the free par level calculator does it for every item on your sheet from your usage, delivery days and supplier lead times.
So the question to put to a vendor is not whether it supports par levels, but whether pars can flex: by day, by site, and against real demand rather than a static guess. If the answer is a single number per item, the tool will fight your ordering process instead of supporting it.

The Integration Question That Decides Whether Software Adds or Removes Admin
The fastest way to tell whether inventory software will save time or cost it is to follow one supplier invoice. In a well-integrated system the invoice is captured against the site that ordered, matched to the goods received note (the GRN, the record of what physically arrived), and pushed straight into the accounting system. Nobody re-keys the figures. Supy connects to QuickBooks, Xero, Zoho Books, Wafeq, and 75+ other platforms for exactly this reason.
In a poorly integrated one, the same numbers get typed twice: once into the inventory tool and again into accounting, at every site, every week. That is not a small overhead. It is the difference between software that removes administrative work and software that quietly doubles it, which is why integration deserves as much weight in your decision as any counting feature.

Turning this into a buying decision is straightforward once you know what to look for. In a demo, run your own operation through the tool rather than watching the scripted tour: ask to see live stock across two sites at once, ask how it shows variance you can investigate rather than just a report, ask it to model par levels that change by day, and follow one invoice all the way into your accounting system. A product that handles those four comfortably will handle the rest. One that stumbles on them will keep stumbling after you have signed.
Supy was built for multi-site food and beverage operators, so these are the things it is designed to do: live stock across every site, theoretical versus actual variance you can drill into, per-outlet ownership of co-mingled stock, and invoice and goods-received data that flows into accounting without re-entry. If that is the shortlist you are working from, it is worth seeing it against your own numbers.