.jpg)


Duplicate Ingredient Items and Inventory Variance: Why Multi-Supplier Sourcing Inflates the Number
How Duplicate Ingredient Items Silently Inflate Your Inventory Variance
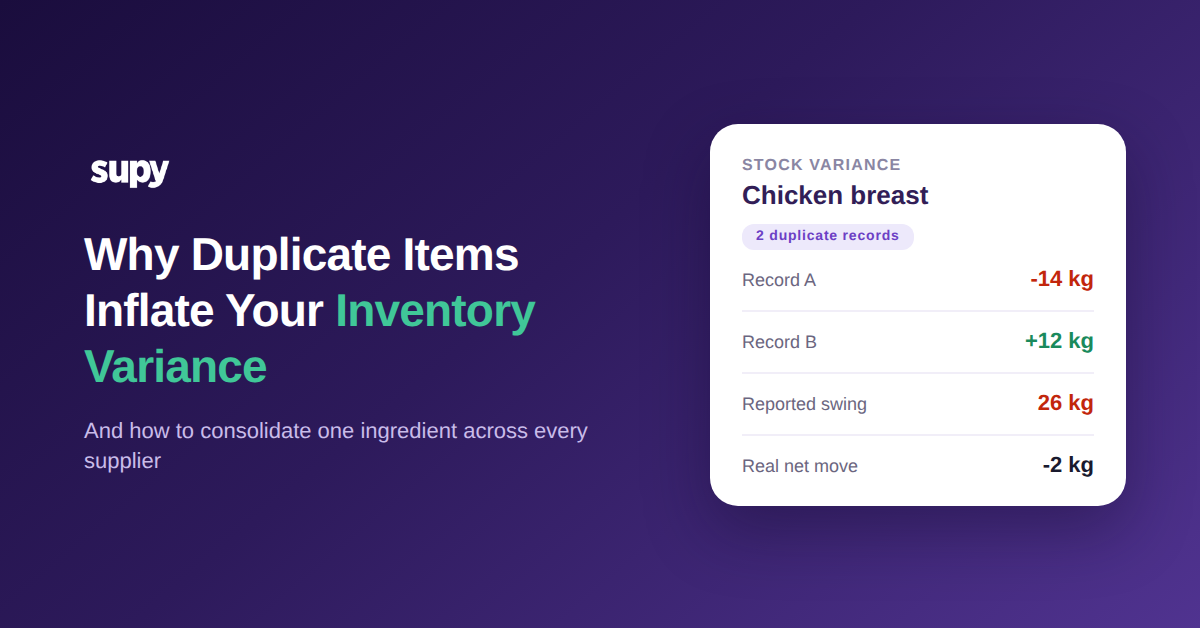
Duplicate ingredient items inflate your inventory variance because the same physical ingredient is split across two or more item records, so each record reports its own theoretical-versus-actual gap even when the real net movement is close to zero. The cure is to consolidate every duplicate into a single base item per ingredient, then re-baseline your counts so the number reflects reality.
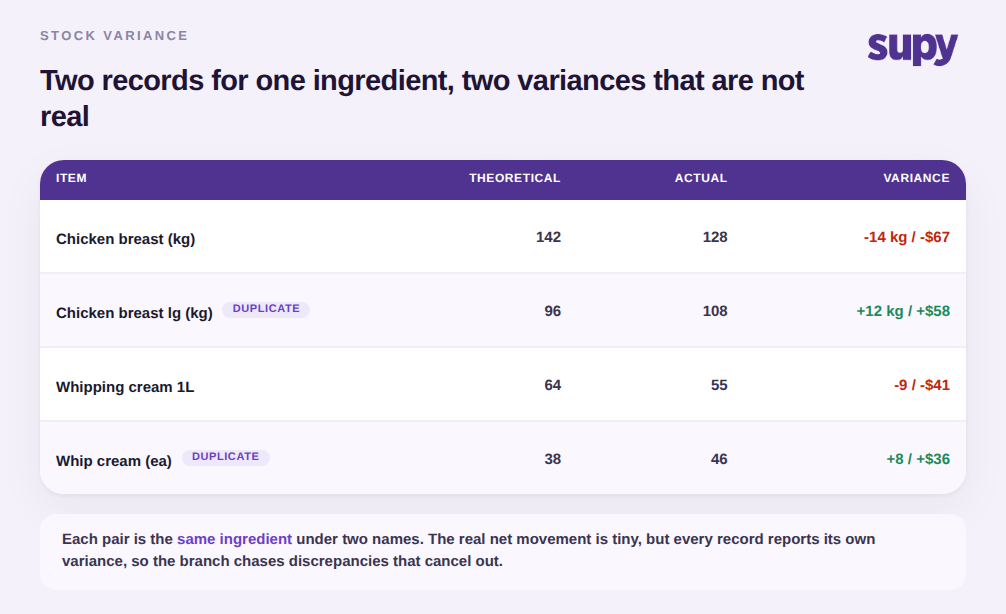
On a variance report this is easy to miss. You do not see one ingredient with a small, explainable gap. You see two or three near-identical lines, each with a variance large enough to look like waste, theft, or a counting error. Chase them one at a time and you will burn a shift on discrepancies that mostly cancel each other out.
Why Sourcing One Ingredient From Several Suppliers Creates Duplicates
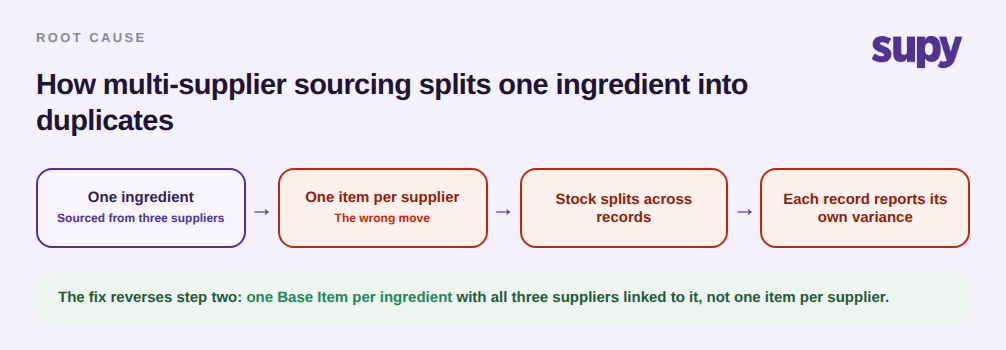
The root cause is almost always multi-supplier sourcing handled the wrong way. When you buy the same ingredient from three suppliers and create a separate item for each one, you end up with three records for a single ingredient: "chicken breast" from one supplier, "chicken breast lg" from another, and a case-pack SKU from a third. The same thing happens with units, where one supplier is entered in kilograms and another in pieces.
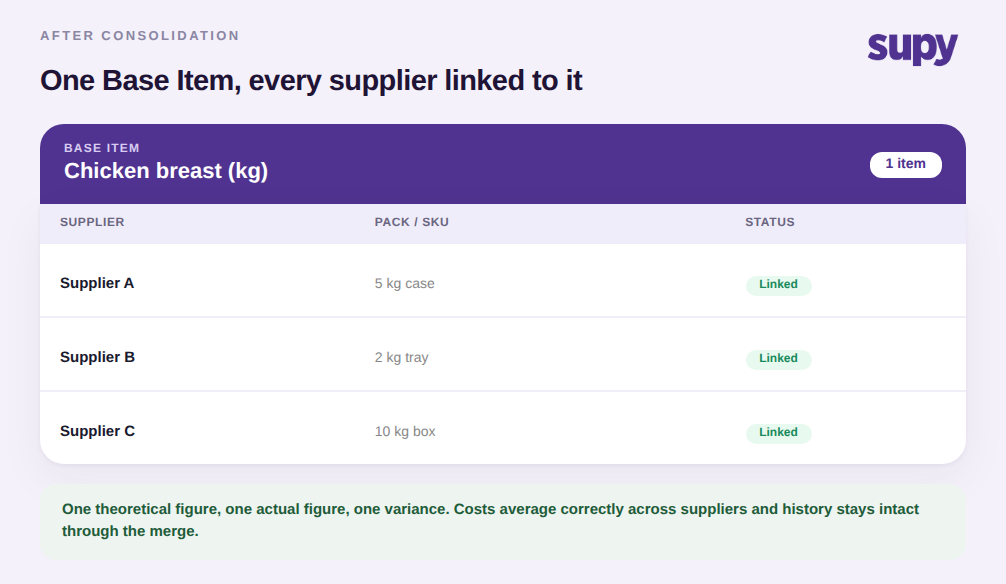
Each of those records carries its own stock balance, its own average cost, and its own variance line. The right structure is the opposite: one base item per ingredient with every supplier SKU and pack size linked to it. Supy's ingredient and allergen management is built around exactly this, one base item per ingredient with all supplier SKUs and packaging linked, so buying from a new supplier never spawns a new item to reconcile later.
Telling Duplicate-Driven Variance Apart From Real Waste or Theft
Before you launch an investigation, rule out the item list. Duplicate-driven variance has a signature: two lines that name what is clearly the same ingredient, moving in opposite directions by similar amounts. One record shows a shortfall because sales depleted it, the other shows a surplus because that is where the last delivery landed. Netted together they are close to flat, but on the report they read as two separate problems.
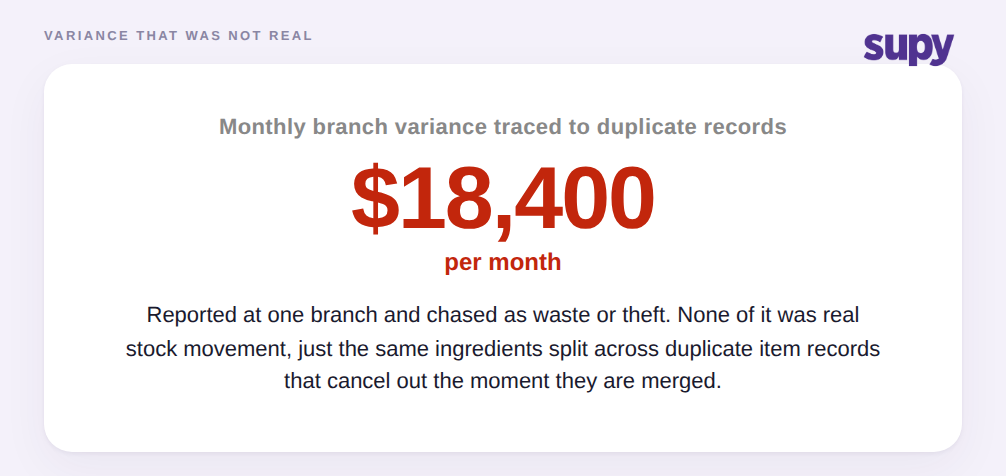
Real waste, over-portioning, and theft do not offset like that, so separating the two is the first triage step in any inventory variance analysis. In one branch, a monthly variance of $18,400 that was being chased as loss turned out to be entirely duplicate records that cancelled out the moment they were merged. None of it was real stock movement.
Consolidating to One Base Item Per Ingredient
Consolidation is a short, repeatable procedure. Find the duplicate set for an ingredient, then decide which record survives as the base item. Link every supplier SKU and pack size to that one item so each supplier still has its own buying price, but they all feed a single stock balance and a single blended cost. Then repoint any recipes that referenced a duplicate to the surviving base item.
The step operators worry about is history, and it is the step to get right. Use a bulk ingredient swap with backdating so recipes that used the duplicate are corrected from the date the swap should have taken effect, not just going forward, and keep the full version history in case you need to restore. Done this way, the merge cleans up the item list without corrupting prior months of cost data.
Re-Baselining So the Variance Number Reflects Reality
Merging the items fixes the structure, but the variance figure will stay noisy until you reset the baseline. Submit a fresh stock count on the consolidated items so the system has an accurate opening balance to measure the next period against. From there, theoretical stock updates continuously from every goods receipt and recipe consumption event, so the variance you see at the next count is measured against real expected usage rather than a stale or split starting point.
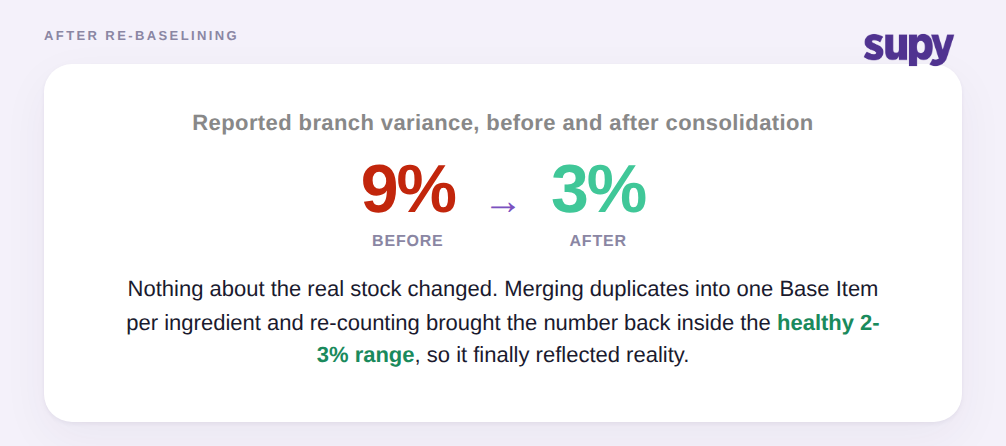
The payoff is a number you can trust. In the branch above, reported variance fell from 9% to 3%, back inside the healthy 2-3% range, without a single change to the actual stock on the shelf. If you want the fuller picture of where a legitimate variance number comes from, the difference between manual and automated variance tracking is a good next read.
Run this quick self-check before your next variance review: pull the report, sort by item, and look for pairs of lines that name the same ingredient and swing in opposite directions. Wherever you find them, you are looking at a duplicate, not a loss. If your reported variance sits above the healthy 2-3% range and a handful of those pairs explain most of it, consolidate them into one base item per ingredient and re-count before you do anything else. You will usually recover a figure like the $18,400 a month that was never really missing, and every investigation after that starts from a number that means something.