.jpg)


Multi-Site Restaurant Inventory: The 8 Reports to Review Weekly
What a Weekly Report Review Catches Before It Costs You
A weekly inventory report review is a fixed rhythm: an operator reads the same short set of reports every week (variance, wastage, cross-site stock and spend) to catch a problem in the week it happens instead of at month-end. Read weekly, a single branch drifting off its par levels or a supplier's quiet price rise shows up while it is still small enough to fix cheaply.
If you'd rather not work par out by hand, the free par level calculator does it for every item on your sheet from your usage, delivery days and supplier lead times.
Most groups already run these reports. The gap is almost never the reporting; it is the cadence. A variance that surfaces seven days after a count is one conversation with one branch manager. The same variance surfaced a month later is four weeks of the same over-portioning already baked into your food cost, repeated across however many sites share the habit. The reports do not change when you read them more often. What changes is how much money has moved before you notice.
Reading them on a weekly loop also stops the reports from contradicting each other. When your count, your variance figure and your stock-on-hand view are all from the same week, they line up. When they are weeks apart, every review starts with reconciling which number to trust, and the review never gets to the decision.
The Eight Reports to Put on the Weekly Rota
Here is the weekly set. Each report answers a different question, and each catches a specific failure that multi-site groups are prone to. Read them in this order: the first four catch money already leaving, and the last four tell you whether you are set up to stop it.
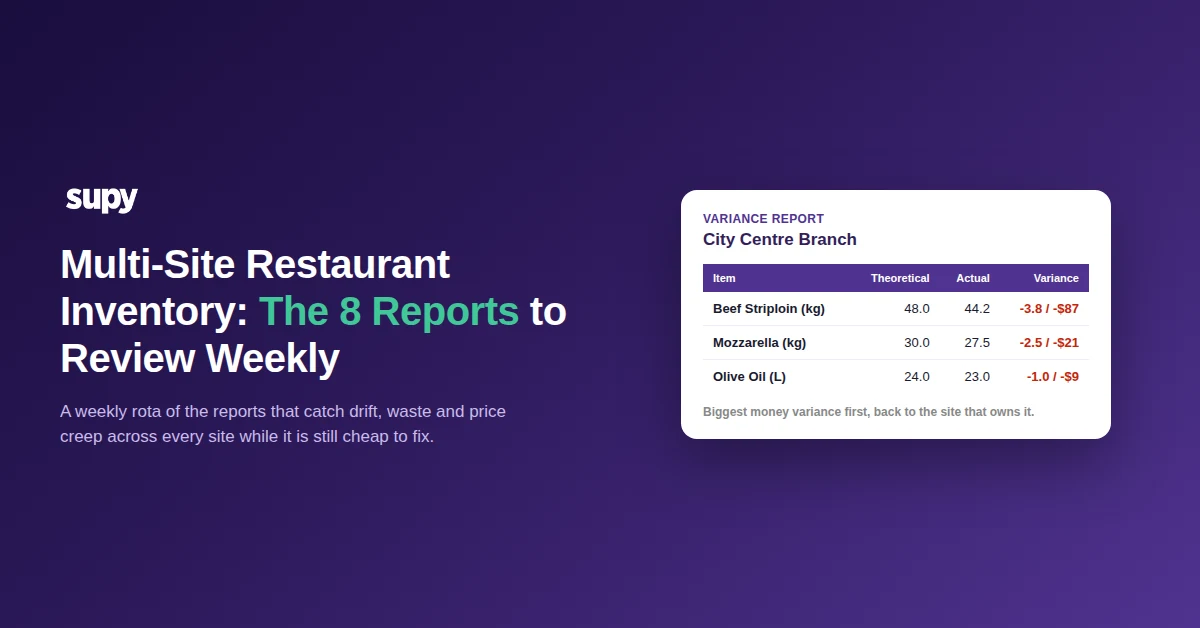
Variance report
The variance report compares theoretical usage against what each site actually used, item by item. The line with the biggest money gap is where over-portioning, miscounts, or shrinkage are quietly eating margin. Read it weekly and you catch one branch drifting off pattern before a full month of the same habit compounds across the group.
Wastage report
The wastage report shows what was thrown away and why, split by category and by site. A category that repeats week after week, the same prep over-produced or the same item spoiling, is a fixable pattern once you can see it recur rather than meeting it as a single lump at month-end.
Inventory sales reporting
Inventory sales reporting lines stock movement up against what actually sold. When depletion and sales do not agree, stock leaving with no matching sale, or sales with no matching depletion, that gap is money you can trace back to a specific site while it is still small.
Procurement reports
Procurement reports track supplier spend and unit prices across every site. A supplier's quiet price rise, or one branch paying more than another for the same item, surfaces here first. Caught weekly, you renegotiate or switch before the new price is baked into a month of orders.
Cross-site inventory report
The cross-site inventory report puts every branch on a single view instead of making you open each site in turn. It is how you spot the one outlet that has drifted off the pattern the rest of the group is holding, and it is the core of running inventory at the group level rather than site by site.
Stock movement history
Stock movement history is the running record of transfers, adjustments, and receipts between sites. When a number looks wrong, this is the report that tells you where the stock actually went and why, so the review moves from arguing about which figure to trust to a specific action with a specific owner.
Par and live stock check
The par and live stock check reads current stock against each site's par level in real time. It catches the two opposite failures at once: the site sitting on too much and tying up cash, and the site about to run out. It is only as reliable as the weekly count feeding it, so lock that count down first (our guide to stock count controls for multi-site restaurants covers who can submit, lock, and approve).
Analytics trend view
The analytics trend view tracks the same measures across weeks so you can see whether last week's fixes actually held. It is what turns a one-off review into an early-warning system: a metric creeping the wrong way over several weeks is a problem forming, visible long before it lands on the month-end P&L.
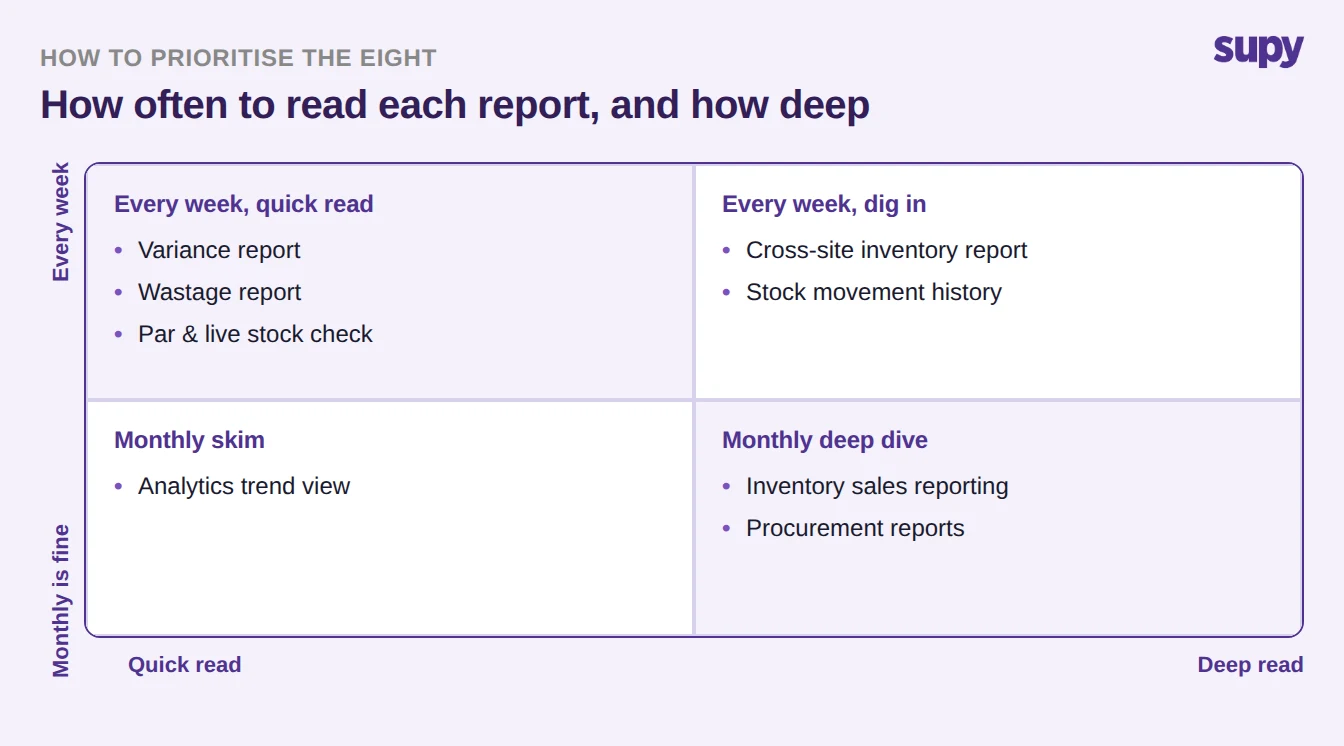
How to Run the Weekly Review Without Losing a Morning
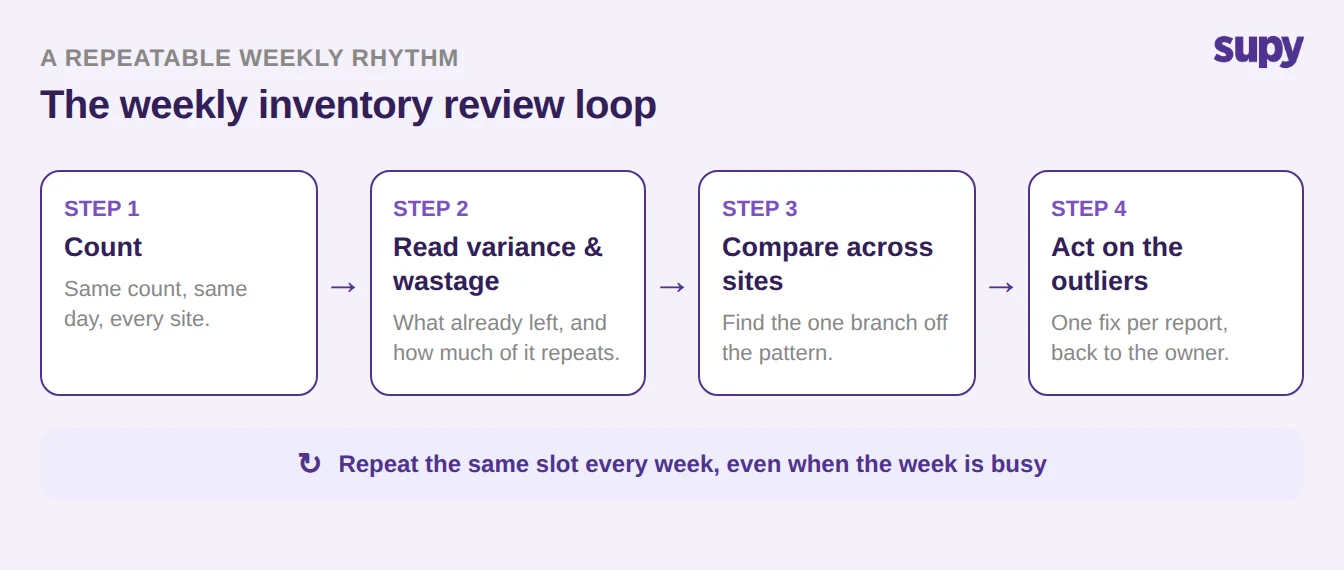
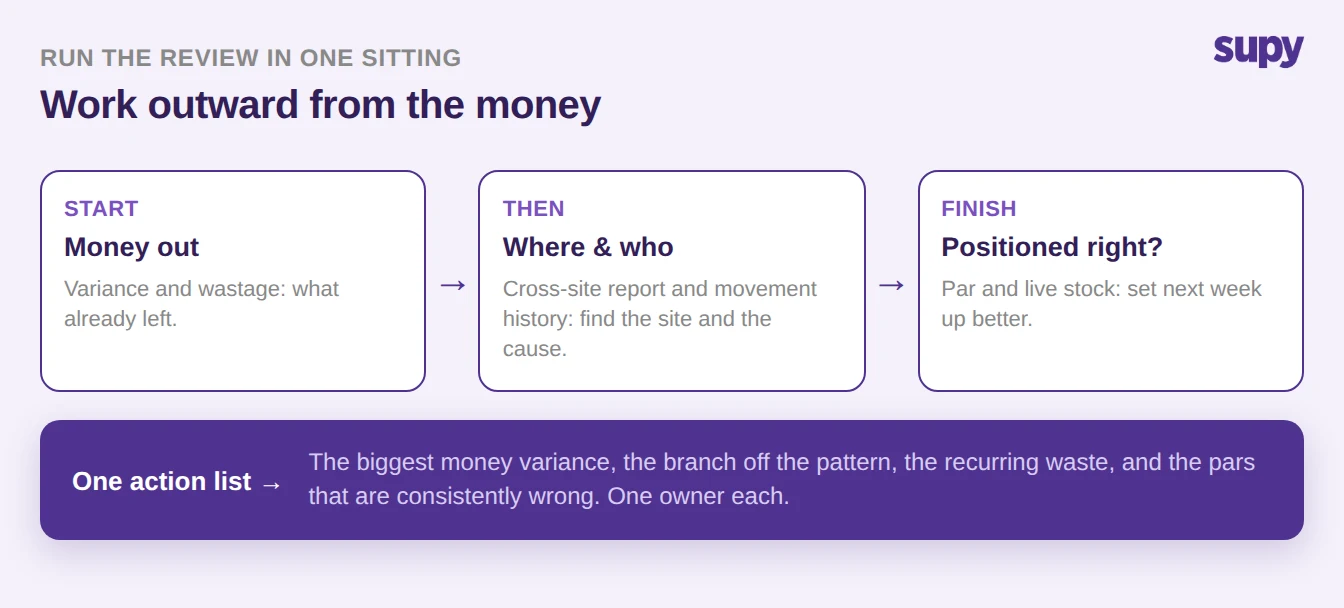
Eight reports sounds like a morning gone. It is not, once the order is fixed and each report has an owner. Work outward from the money: start with variance and wastage, because they tell you what already left; move to the cross-site report and movement history to find where and why; finish on par and live stock to decide whether next week is set up better than this one.
Give each report a single owner and a single output. The point of the review is not to admire the numbers; it is to leave with a short action list. One outlier per report is enough. A review that generates twenty actions gets none of them done, so cap it: the largest money variance, the one branch that broke the pattern, the recurring waste category, and the pars that are consistently wrong. Four fixes a week, chased to close, beats a monthly report nobody acts on.
Book the same slot every week and keep it even when the week is busy, because the weeks you are too busy to review are exactly the weeks a branch drifts. Consistency is what turns eight reports from a chore into an early-warning system.
Run the shortest possible version first. Pull your variance report and your wastage report for the last week across every site, and ask one question of each: which site and which item is costing the most, and which waste keeps repeating. If you are not reviewing anything weekly today, start there and add the cross-site report next week. The reports you are not yet reading every week are the ones hiding your most expensive habits, and the fastest way to find them is to put the first two on next week's calendar.