المخزون

Multi-Site Restaurant Inventory: The 8 Reports to Review Weekly

What a Weekly Report Review Catches Before It Costs You

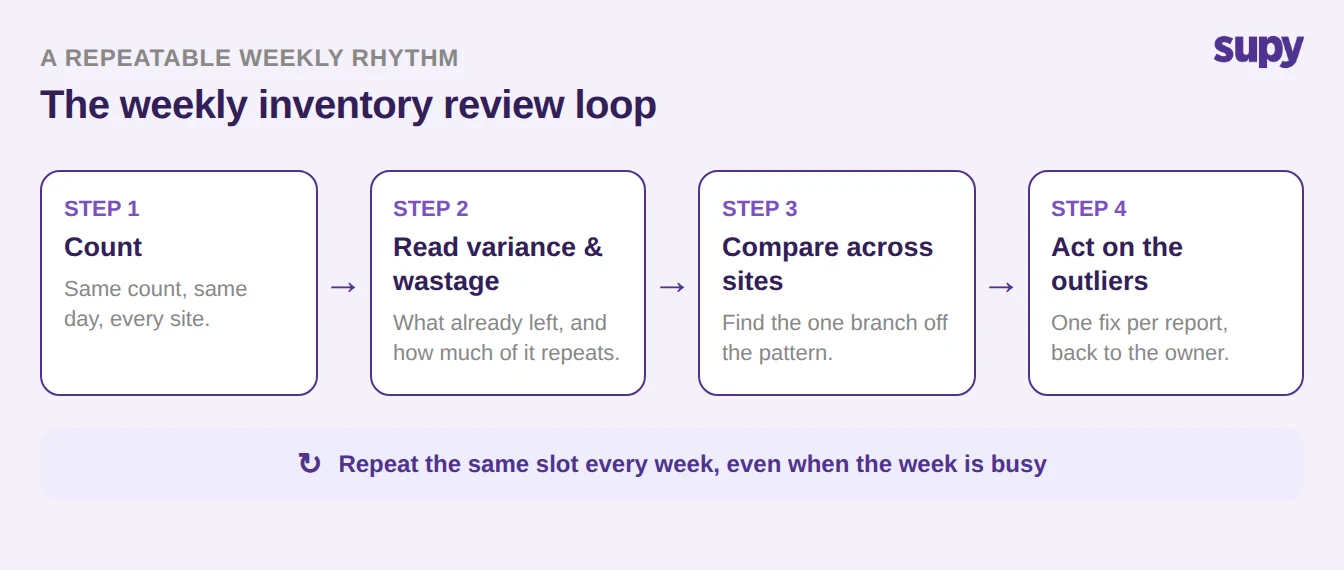
A weekly inventory report review is a fixed rhythm: an operator reads the same short set of reports every week (variance, wastage, cross-site stock and spend) to catch a problem in the week it happens instead of at month-end. Read weekly, a single branch drifting off its par levels or a supplier's quiet price rise shows up while it is still small enough to fix cheaply.

Most groups already run these reports. The gap is almost never the reporting; it is the cadence. A variance that surfaces seven days after a count is one conversation with one branch manager. The same variance surfaced a month later is four weeks of the same over-portioning already baked into your food cost, repeated across however many sites share the habit. The reports do not change when you read them more often. What changes is how much money has moved before you notice.

Reading them on a weekly loop also stops the reports from contradicting each other. When your count, your variance figure and your stock-on-hand view are all from the same week, they line up. When they are weeks apart, every review starts with reconciling which number to trust, and the review never gets to the decision.

The weekly inventory review loop: count, read variance and wastage, compare across sites, act on the outliers, repeated every week


The Eight Reports to Put on the Weekly Rota

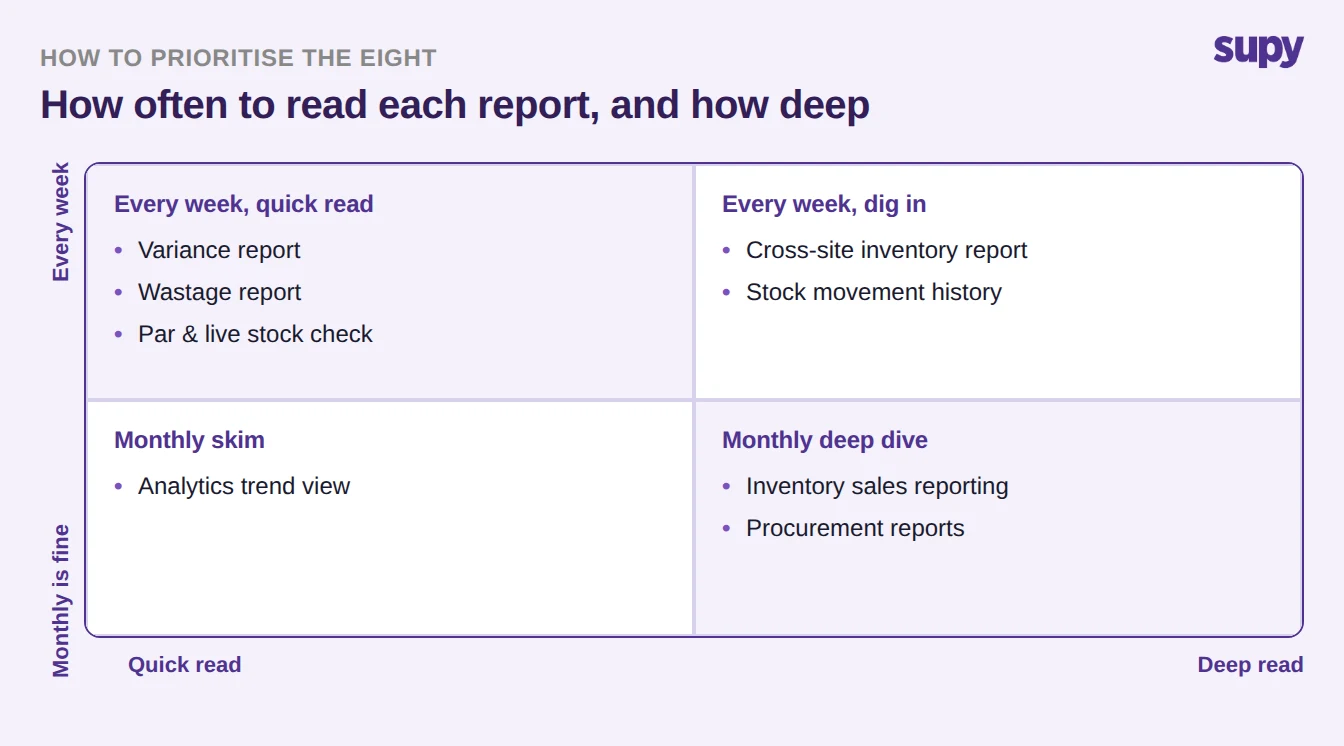
Here is the weekly set. Each report answers a different question, and each catches a specific failure that multi-site groups are prone to. Read them in this order: the first four catch money already leaving, and the last four tell you whether you are set up to stop it.

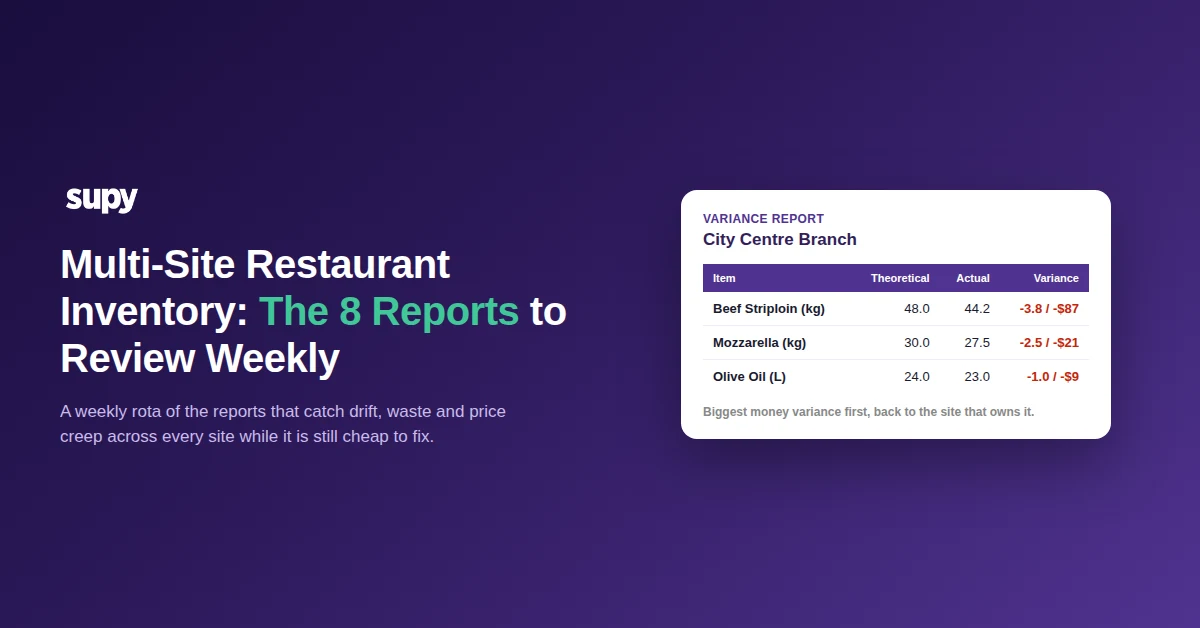
  1. Variance report. Compares theoretical usage against your actual count per item and shows the food-cost impact of the gap for each site, with a consolidated cost picture straight after every count. It is the fastest read of where stock is disappearing. The weekly move: scan the biggest money variances first, not the biggest quantity ones, and take the top one back to the site that owns it. (If variance is new to your team, start with how to read inventory variance.)
  2. Cross-site inventory report. Lets you choose which branches to include and set a date range, so the whole group sits on one report instead of one export per site. This is the report that catches a single branch drifting from the rest of the group. The weekly move: sort by the metric you care about and look for the one site that does not match the pattern.
  3. Stock movement history. Filters every movement by date range and type (goods received, wastage, production, transfer) so you can see where stock actually went, not just that it is missing. The weekly move: when a variance has no obvious cause, open movement history for that item and follow the trail before you blame a count.
  4. Wastage report. Breaks wastage down to the ingredient, supports your own wastage categories, and converts voided point-of-sale sales into wastage automatically so it is counted rather than quietly lost. The weekly move: look for the category or ingredient that repeats week over week, because recurring waste is a process problem, not an accident.
  5. Inventory sales reporting. Spans 11 report types, from a location-level cost overview down to per-item movement, tying what you bought and counted to what you actually sold. The weekly move: use it to catch stock-versus-sales mismatches, where product is leaving inventory faster than the tills explain.
  6. Procurement reports. Cover 12 report types, including purchase value and items-by-supplier, and can be delivered as a scheduled Excel export. This is where supplier price creep and lopsided spend by branch show up. The weekly move: compare unit prices on your top few ingredients against last week, since a quiet rise on a high-volume item is real money at group scale.
  7. Analytics coverage. Pulls procurement, recipe cost, actual cost, variance, wastage, sales and transfer analytics into one place, so the weekly read is not seven separate exports stitched together. The weekly move: use the analytics view for the trend line, then drop into the specific report above when a line bends the wrong way.
  8. Group-level par and live stock. Shows par and minimum levels across every location, not only per site, alongside real-time stock on hand and below-min or above-par flags. This is the weekly "are we positioned right" check. The weekly move: find the sites sitting above par (cash tied up in stock) or repeatedly below minimum (about to stock out) and fix the pars that are consistently wrong.
A quadrant showing how often to read each of the eight reports and how deep, from every-week quick reads to monthly deep dives


How to Run the Weekly Review Without Losing a Morning

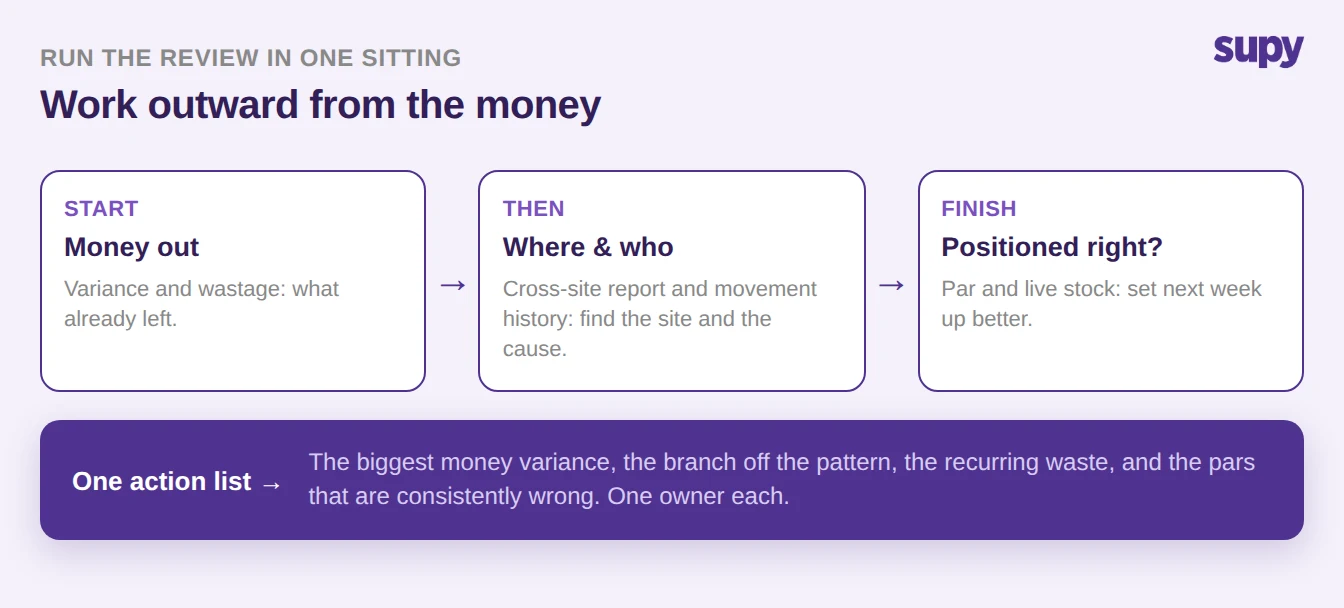
Eight reports sounds like a morning gone. It is not, once the order is fixed and each report has an owner. Work outward from the money: start with variance and wastage, because they tell you what already left; move to the cross-site report and movement history to find where and why; finish on par and live stock to decide whether next week is set up better than this one.

Give each report a single owner and a single output. The point of the review is not to admire the numbers; it is to leave with a short action list. One outlier per report is enough. A review that generates twenty actions gets none of them done, so cap it: the largest money variance, the one branch that broke the pattern, the recurring waste category, and the pars that are consistently wrong. Four fixes a week, chased to close, beats a monthly report nobody acts on.

Book the same slot every week and keep it even when the week is busy, because the weeks you are too busy to review are exactly the weeks a branch drifts. Consistency is what turns eight reports from a chore into an early-warning system.

Run the weekly review by working outward from the money: start with money out, then where and who, then whether you are positioned right, ending in one action list


Run the shortest possible version first. Pull your variance report and your wastage report for the last week across every site, and ask one question of each: which site and which item is costing the most, and which waste keeps repeating. If you are not reviewing anything weekly today, start there and add the cross-site report next week. The reports you are not yet reading every week are the ones hiding your most expensive habits, and the fastest way to find them is to put the first two on next week's calendar.

Book a Demo with Supy - see every site's inventory reports in one weekly view

Ready to optimize your restaurant operations?

مدونة

رؤيتنا التشغيلية

Your questions 
answered

Everything you need to know about Supy — from setup to integrations, pricing, and daily use. If it’s not covered here, just ask.

Which inventory reports should a multi-site restaurant group review every week?
+

Eight reports cover a weekly review well: the variance report, the cross-site inventory report, stock movement history, the wastage report, inventory sales reporting, procurement reports, an analytics view, and a group-level par and live-stock check. The first four catch money already leaving the business, such as shrinkage, drift at one branch, and recurring waste. The last four tell you whether the group is set up to stop it, from supplier price creep to sites sitting above par. You do not need every report in full depth each week, but you do need each question answered before problems compound across locations.

Why review inventory reports weekly instead of monthly?
+

Reviewing weekly changes how much money moves before you notice a problem, not the reports themselves. A variance caught seven days after a count is a single conversation with one branch manager. The same variance found a month later is four weeks of the same over-portioning already baked into food cost, often repeated across several sites. Weekly reads also keep your count, variance and stock-on-hand figures from the same period, so they agree with each other instead of forcing you to reconcile which number to trust. The shorter the loop, the smaller and cheaper each problem is when you act on it.

How long should a weekly inventory review take?
+

A weekly review does not need to take a morning once the order is fixed and each report has an owner. Work outward from the money: start with variance and wastage to see what already left, move to the cross-site report and movement history to find where and why, then finish on par and live stock to set up the next week. Cap the output at one action per report, so you leave with a short list of about four fixes rather than twenty you will never close. Booking the same slot every week is what keeps the review short and repeatable.

What report shows where stock is disappearing in a restaurant?
+

Start with the variance report. It compares theoretical usage against your actual physical count for each item and shows the food-cost impact of the gap per site, with a consolidated cost picture straight after every count. Scan the largest money variances first rather than the largest quantity variances, because a small quantity of an expensive item can cost more than a large quantity of a cheap one. When a variance has no obvious cause, open stock movement history for that item and follow the trail through goods received, transfers, production and wastage before you assume the count itself was wrong.

How can a restaurant group compare inventory across multiple sites?
+

Use a cross-site inventory report that lets you choose which branches to include and set a date range, so the whole group appears on one report instead of one export per location. This is what surfaces a single branch drifting from the rest: you sort by the metric you care about and look for the site that does not match the pattern. Pair it with a group-level par and live-stock view, which shows par and minimum levels across every location alongside real-time stock on hand, so you can see at a glance which sites are over-stocked and which are about to run out.

What is the difference between a variance report and a wastage report?
+

A variance report tells you that stock is missing and what it cost; a wastage report often tells you why. Variance compares theoretical usage against your actual count and puts a money value on the gap, but it does not, on its own, explain the cause. The wastage report breaks losses down to the ingredient, supports your own wastage categories, and can convert voided point-of-sale sales into wastage automatically so they are counted rather than lost. Read together each week, variance points you at the biggest cost and wastage shows how much of it is recurring, avoidable loss.

Who should own the weekly inventory report review in a restaurant group?
+

Give each report a single owner and a single output rather than leaving the review to whoever has time. Typically an operations or finance lead runs the group-level reads, the cross-site comparison and analytics, while branch managers own their own variance and wastage numbers and the actions that come from them. The point is not to admire the figures; it is to leave with a short action list that named people are accountable for closing before the next review. Clear ownership is what turns a set of reports into an early-warning system instead of a weekly report that nobody acts on.

هل أنت مستعد لتطوير عملياتك؟

انضم إلى أكثر من 3500 مُشغلي مطاعم يخفضون التكاليف، ويبسطون العمليات، ويتخذون قرارات أكثر ذكاءً مع Supy