.jpg)


Restaurant Stock Movement Report: Trust Every Line at Month-End
What a Stock Movement Report Shows Across Every Site
A restaurant stock movement report shows how stock changed at one location over an accounting period. It starts from opening stock, adds what came in, subtracts what went out, and lands on closing stock. Read across sites, it tells a finance team where value moved, what it was consumed on, and which figures they can trust.
The value of that report is timing. Most teams meet their real food cost only at month-end, once every number has been reconciled by hand. By then the period is closed and nothing can be changed. A movement report read through the period turns that month-end surprise into a figure you watch as it moves.
Supy generates five inventory movement reports: stock movement between two counts, all stock movements, variance, item activity, and stock value. Each one is tied to your business-date calendar, so a report for a period matches the days you actually trade. It sits alongside the other numbers a group reviews on a schedule, covered in the inventory reports every multi-site group should review weekly. The table below shows what each report answers.
| Report | What it answers |
|---|---|
| Stock movement between two counts | How stock changed from one count to the next |
| All stock movements | Every stock-affecting event over a period, in one list |
| Variance | Where counted stock differs from the system figure |
| Item activity | The full movement history for a single item |
| Stock value | What the stock on hand is worth at period end |
Start With Opening Stock: The Figure Everything Else Trusts
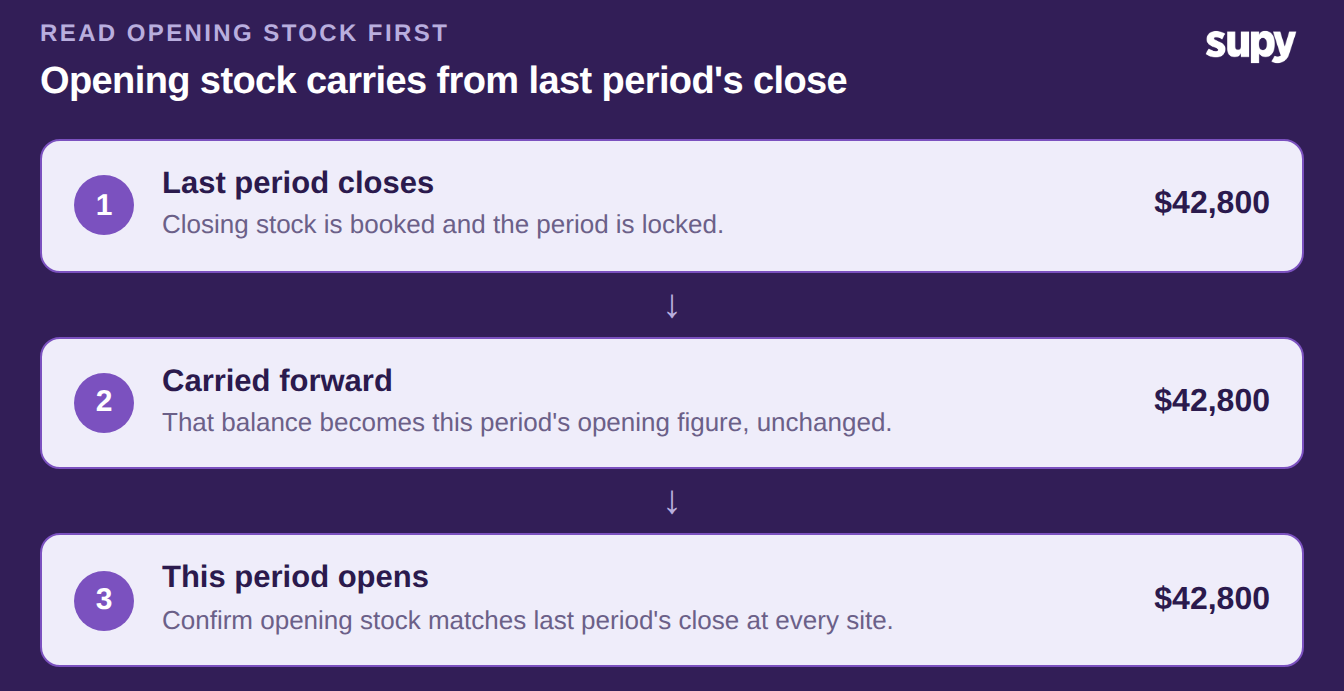
Opening stock is the first line and the one every other figure leans on. It is simply last period's closing stock carried forward. If the two do not match, every number below inherits the error. The variance line at the bottom then looks wrong for a reason that has nothing to do with real loss.
So read opening stock first. Confirm this period's opening value equals last period's closing value at every site. A gap here usually means a count was reopened, a late invoice landed after close, or an item's cost was changed after the books were locked.
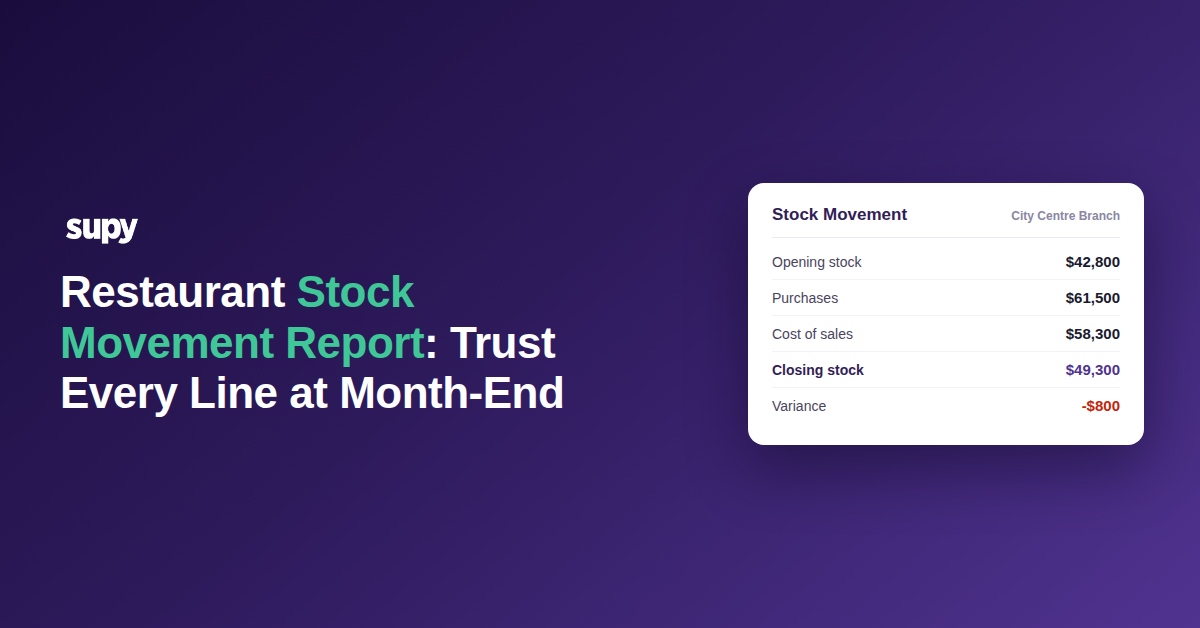
In the worked example, one branch opens the period at $42,800. That figure is not typed in fresh each month. It is the closing balance the previous period ended on, which is why a period that closes cleanly makes the next one easier to trust.
Purchases, Transfers and Production: Every Way Stock Comes In
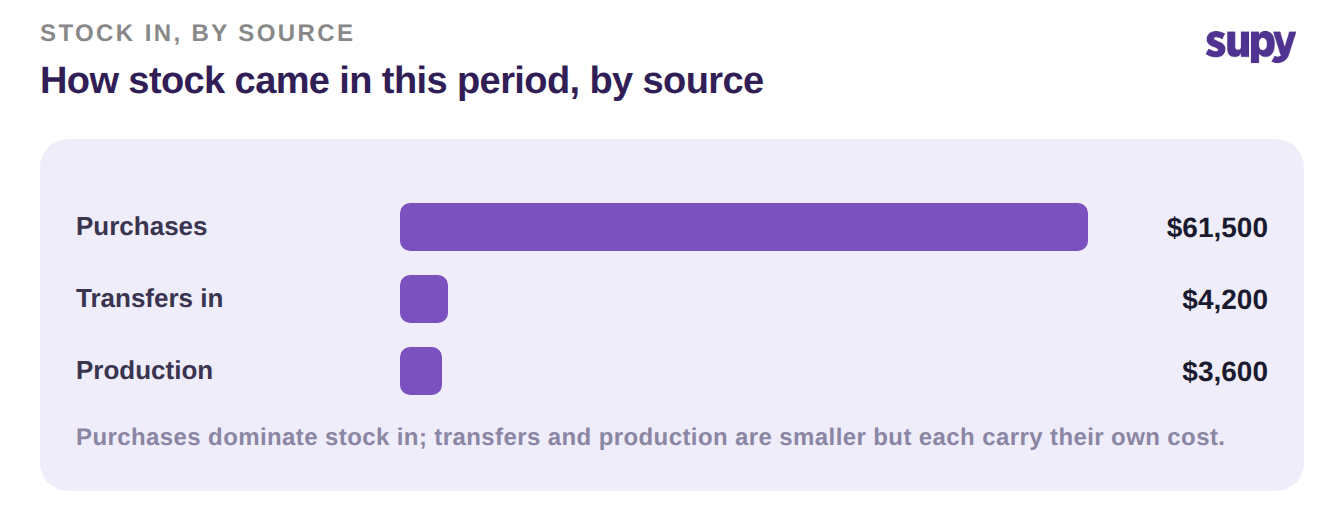
Stock comes in three ways, and the report shows each on its own line. Purchases are the goods you receive from suppliers. Transfers in are stock moved from another site or a central kitchen. Production is what a prep kitchen makes and books into stock.
Reading them separately matters because they behave differently. A purchase raises stock at a supplier cost you can check against the invoice. A transfer should carry its cost from the sending site, so the value follows the stock. Production converts raw items into a prep item at a costed yield.
Every one of these events is written to a single auditable ledger: goods receipts, production runs, and inter-branch transfers alike. That is what lets you drill from a line on the report to the exact events behind it. In the example period, purchases bring in $61,500, transfers in add $4,200, and production adds $3,600.
Cost of Sales and Closing Stock: What You Actually Consumed
Cost of sales is the line finance teams close the month on. It is what the period actually consumed, valued at cost. On a movement report you do not estimate it from sales. You read it from the stock that moved.
The arithmetic is one line. Opening stock, plus everything that came in, minus what went out other than sales, leaves closing stock. Cost of sales is the consumption inside that: the value that left as sales rather than as wastage or a transfer.
Closing stock is the mirror image. It is the value still on the shelf at period end, and it becomes next period's opening figure. Supy's restaurant analytics software produces Sales and cost-of-sales reports at group, location, and menu-category level. You read the consumed value one site at a time, instead of rebuilding it in a spreadsheet. The table below works the full movement through for one branch.
| Movement line | Value |
|---|---|
| Opening stock | $42,800 |
| Purchases | +$61,500 |
| Transfers in | +$4,200 |
| Production | +$3,600 |
| Transfers out | -$2,600 |
| Wastage | -$1,900 |
| Cost of sales | -$58,300 |
| Closing stock | $49,300 |
Recorded vs Unrecorded Loss: Reading Variance You Can Trust
Variance is the last line and the one people distrust most. It is the gap between the closing stock the system expects and the closing stock a physical count actually finds. A trustworthy variance line separates loss you already recorded from loss you did not.
Recorded loss is stock you logged on purpose: wastage, staff meals, a transfer out. It is already on the report, so it should never surprise you. Unrecorded loss is the rest: a miscount, an un-logged transfer, or theft. It also covers a stale cost, set once and never updated, so value drifts while no stock moves.
Read variance by drilling into it, not by accepting the total. In the example, a count finds $48,500 against a system figure of $49,300, a variance of -$800 (-1.6%). Drilling in, $500 turns out to be a transfer and a wastage log posted late, which leaves $300 of genuine unrecorded loss to chase.
Because every stock event sits on one ledger, you can trace each part of that gap to a cause. That is the difference between a variance number you argue about and one you act on. For the full method, see investigating stock variance across sites.
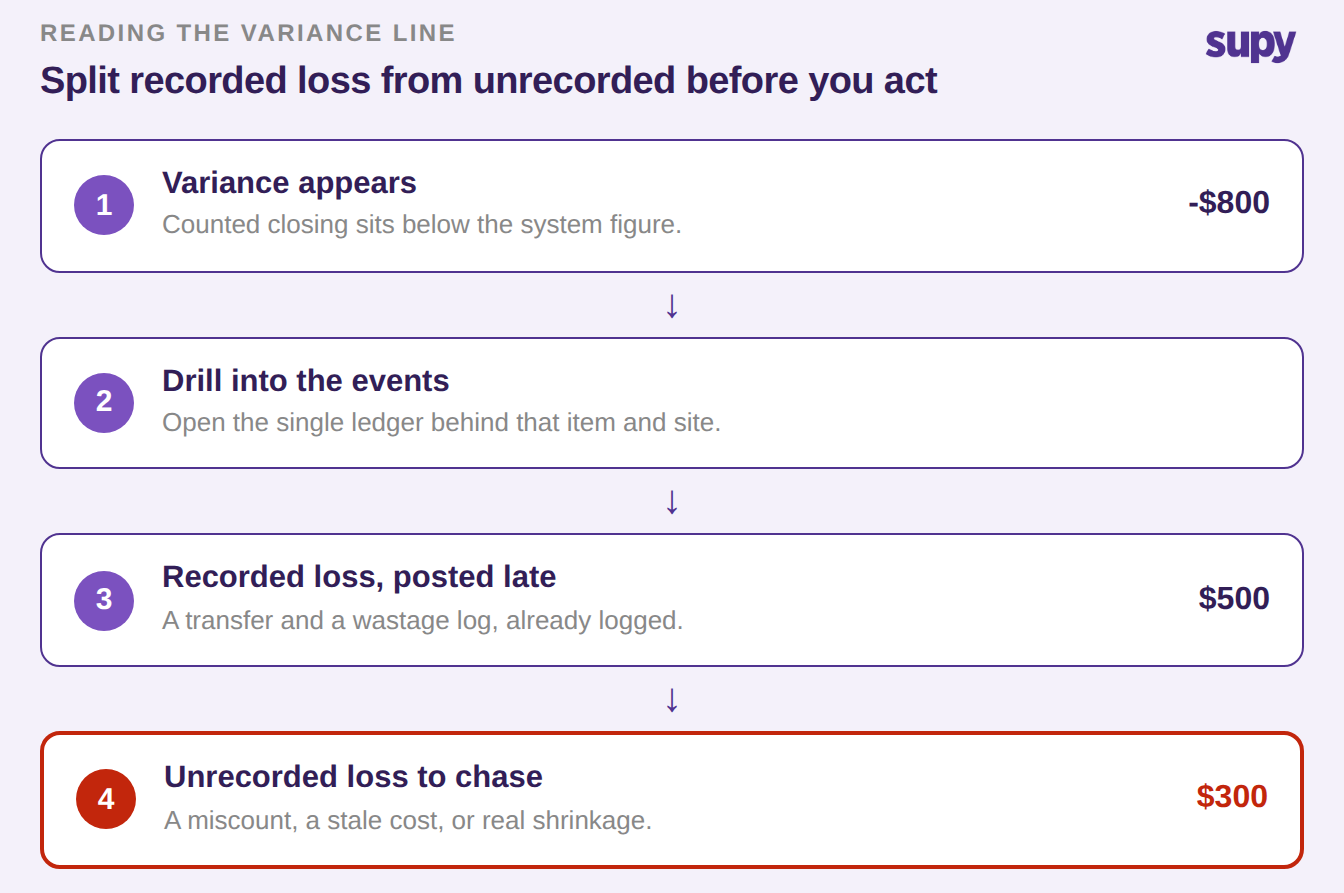
Read the report in that order and the month-end number stops being a surprise. Start at opening stock and confirm it carries from last period. Work down through purchases, transfers and production, then cost of sales and closing stock. Finish on variance, and split recorded from unrecorded before you act.
One number to watch as you go is cost of sales against sales. In the worked example that is $58,300 on $195,000 of sales, a food cost of 29.9%. A healthy range for most operations is 28-32%. If your movement report puts you above it, check the variance line first. Unrecorded loss is where a healthy-looking purchase figure quietly turns into a high food cost.