.jpg)


Restaurant Stock Count Software: Why Most Operators Still Can't Close the Variance Gap
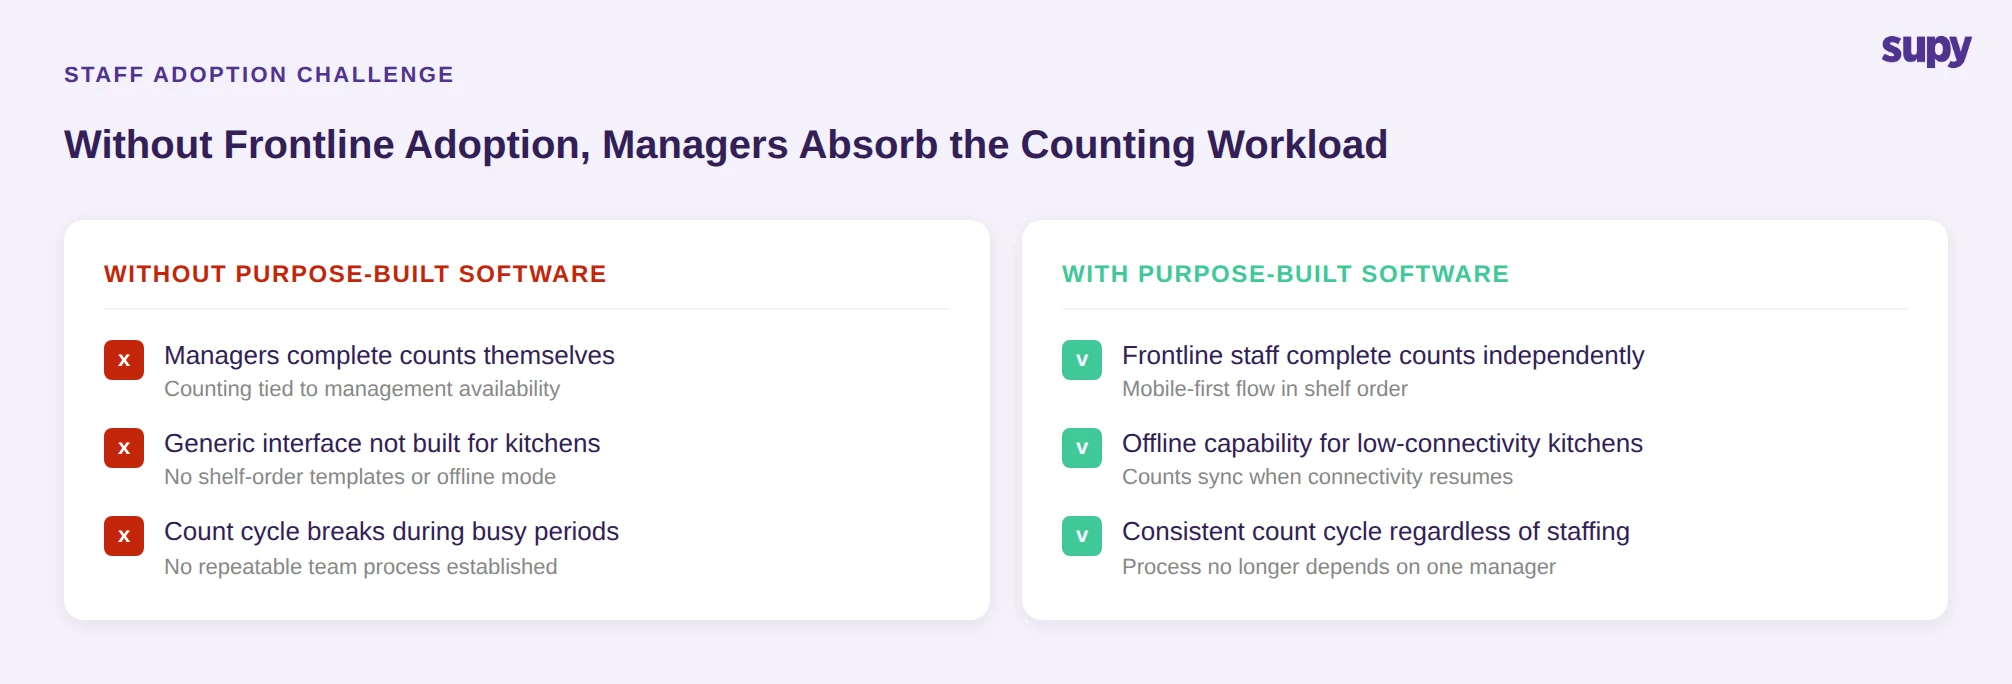
The most common stock count failure mode is not technical. It is human. When frontline kitchen staff resist adopting a new counting tool - because it feels unfamiliar, because training was rushed, or because the interface is not designed for a fast kitchen environment - the counting workload migrates upward. Operations managers end up doing the count themselves to ensure it gets done correctly.
This creates a structural dependency: consistent stock counts now rely on whether that manager is available, in the building, and has time. A sick day, a busy service, a period of high turnover - any of these breaks the count cycle. No technology upgrade fixes this if the software is not designed for frontline adoption.
Purpose-built restaurant stock count software addresses this at the interface level. Mobile-first counting flows, counting templates arranged in shelf order so staff can move through a storage area without jumping between categories, and offline capability for low-connectivity kitchens all reduce the friction that causes adoption to fail. When the tool works in the environment where counting actually happens, frontline teams use it - and operations managers stop absorbing work that should belong to the team.
The Reconciliation Problems That Compound Across Multiple Locations
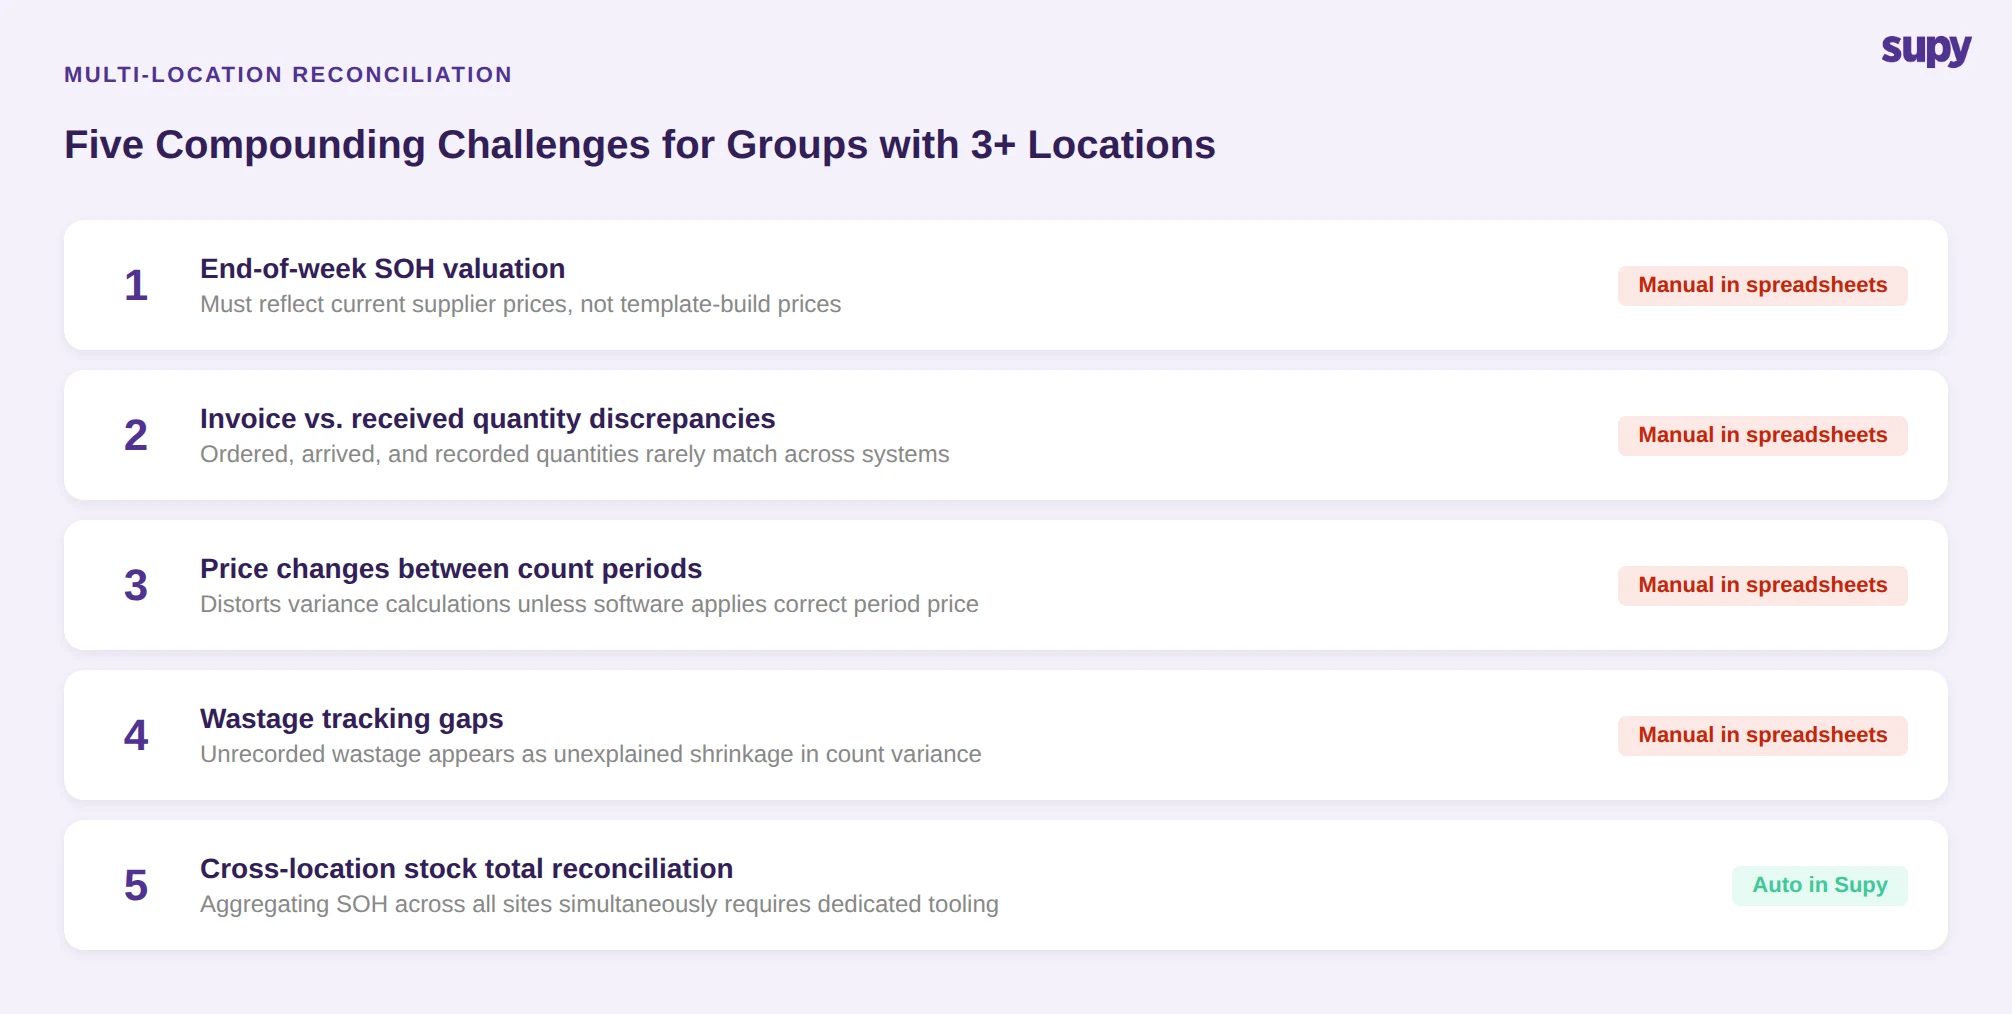
A single-location operator has one variance number to investigate. A group running 3 locations or more has a different problem entirely: five compounding reconciliation challenges happening simultaneously.
One operations manager at a small multi-site group identified these five in sequence: stock-on-hand valuation at end of week, invoice versus received quantity discrepancies, price changes between count periods, wastage tracking gaps, and reconciling stock totals across all locations at once. Each one is manageable in a spreadsheet for a single site. Together, across multiple sites, they require a level of data aggregation that spreadsheets cannot provide cleanly.
Stock-on-hand valuation requires pulling current supplier prices into the count so the SOH figure reflects what items actually cost this week - not what they cost when the template was built. Invoice discrepancies require matching what was ordered, what arrived, and what was recorded across different systems. Price changes between count periods distort variance calculations unless the software applies the correct price to the correct period. Wastage needs to be deducted before variance is calculated, or wastage appears as unexplained shrinkage.
Generic tools handle these as separate lookups. Purpose-built multi-location software connects them: a completed count pulls the correct current prices, deducts recorded wastage, reconciles against GRNs, and produces a per-location and group-level SOH that finance can actually use. The operator with 3 locations gets a consolidated view in minutes rather than hours of manual aggregation.
Variance Numbers Without Drill-Down Do Not Close the Gap
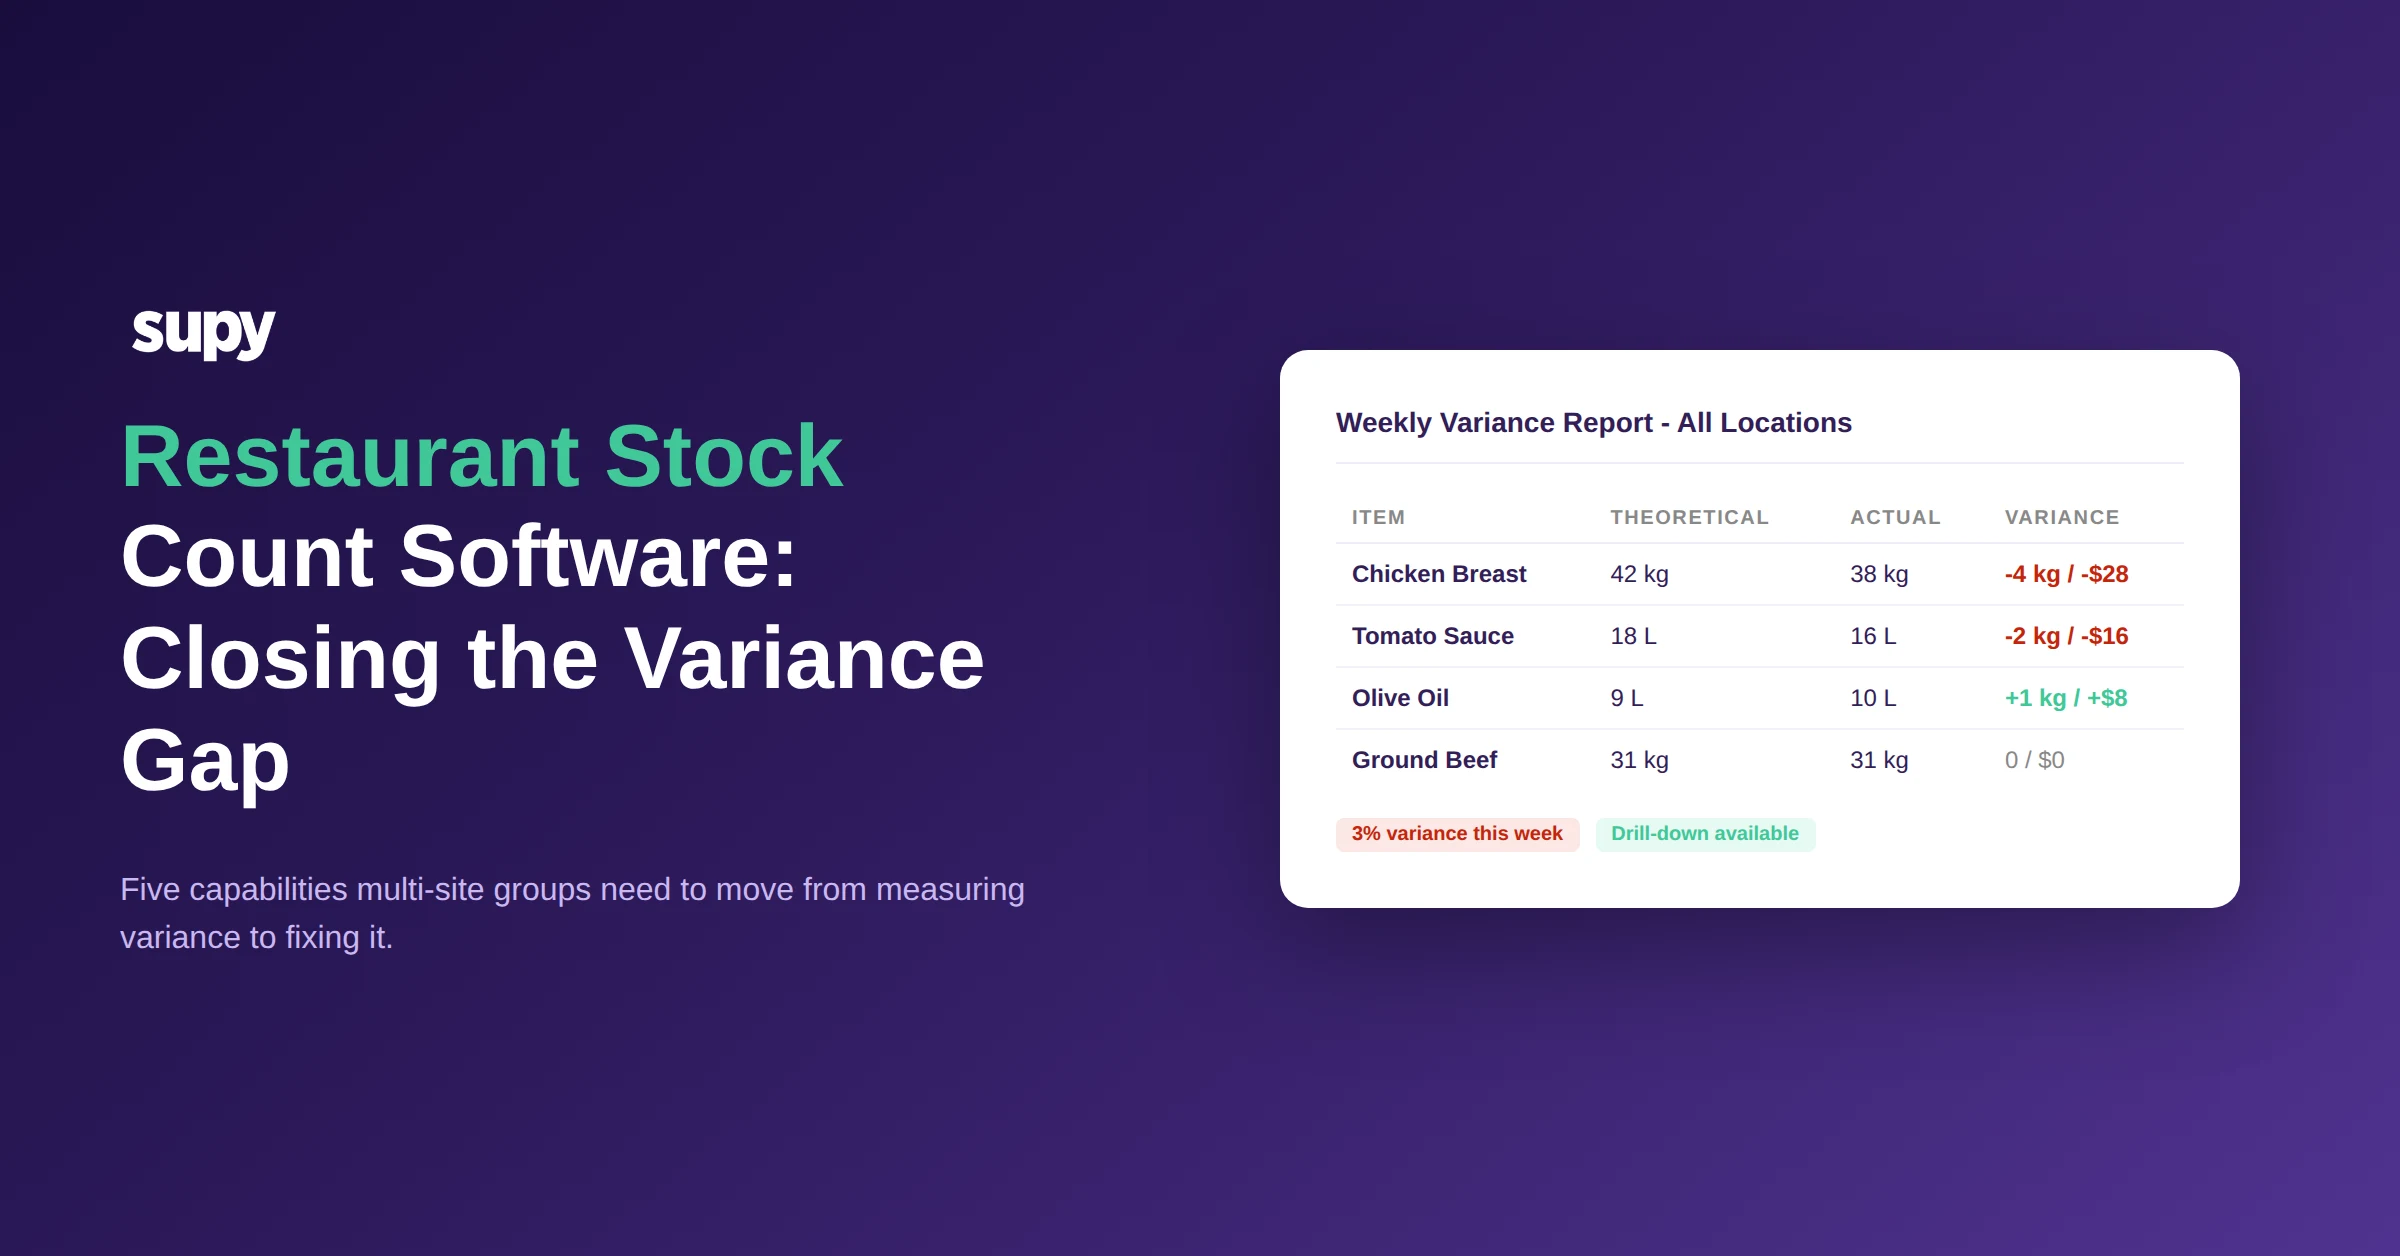
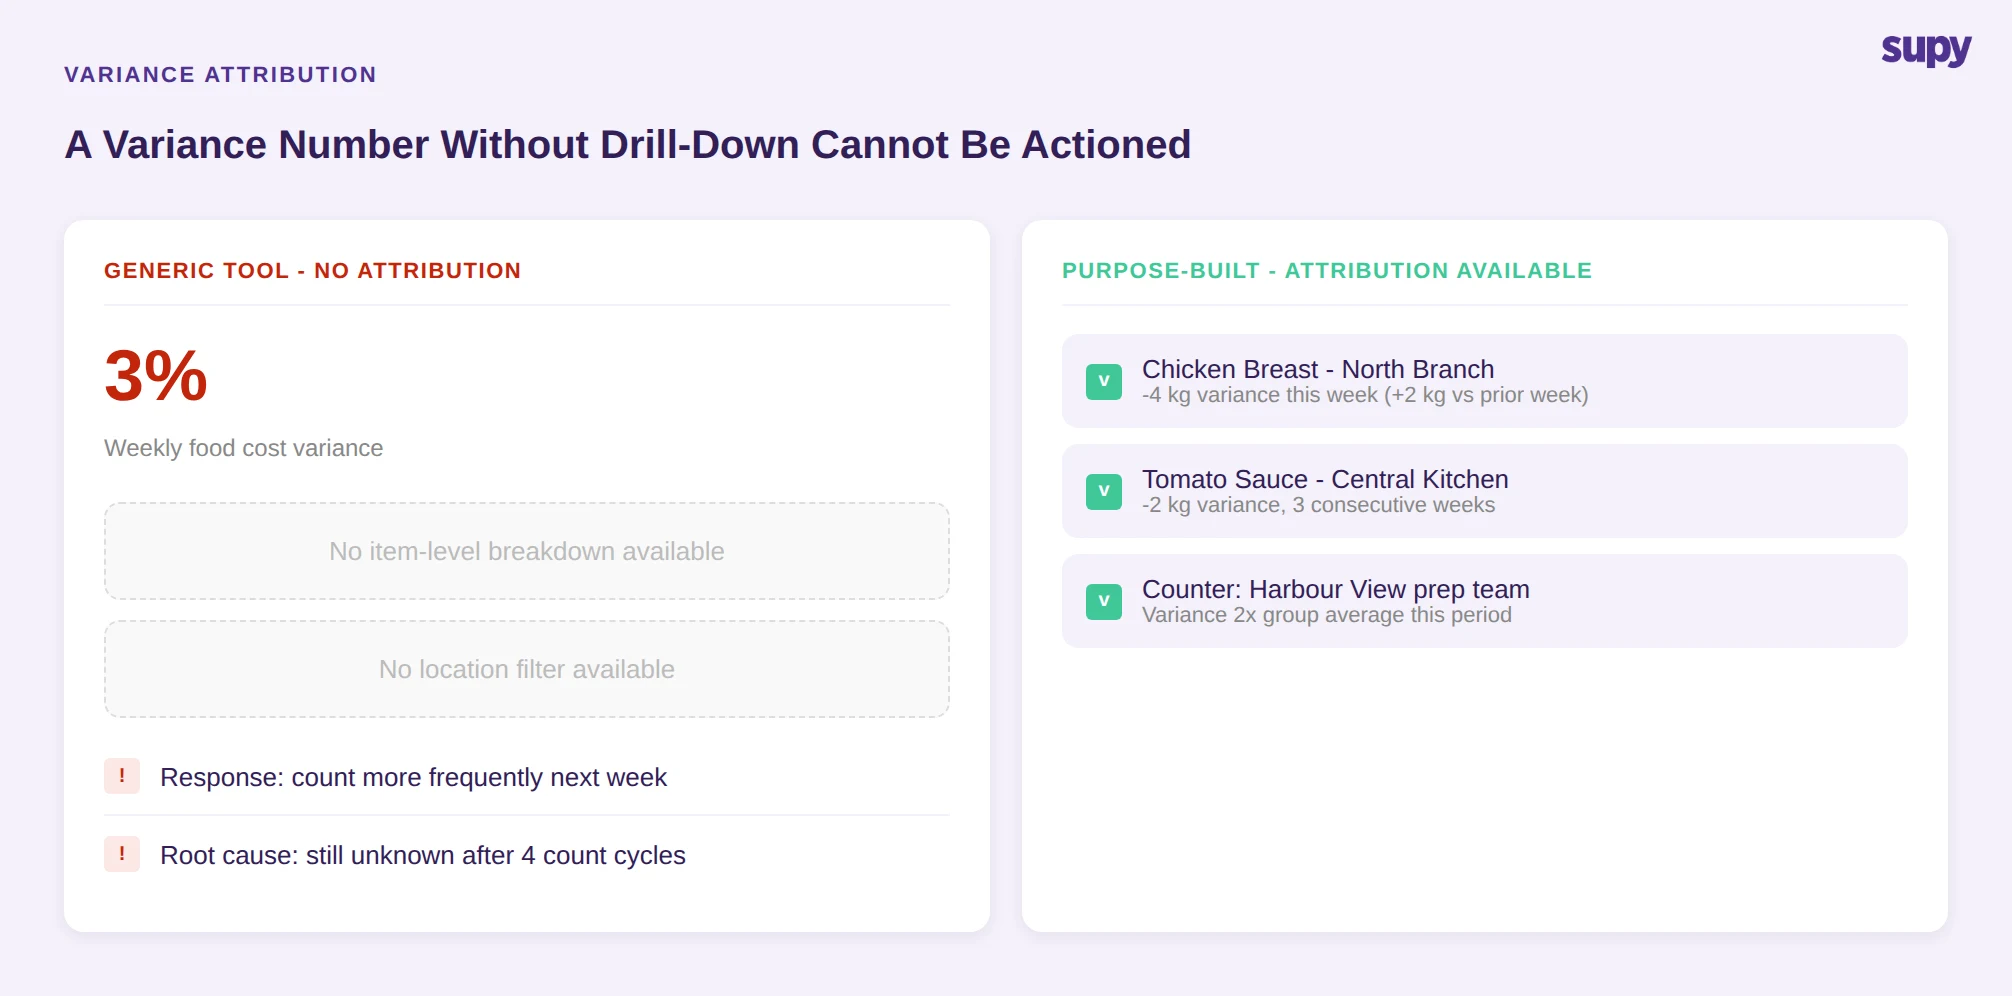
The theoretical versus actual inventory gap is the central measurement in food cost control. Theoretical usage is what the system calculates based on sales and recipes. Actual usage is what counting reveals. The gap between them - unexplained consumption - is where food cost leaks.
Most restaurant groups run daily, weekly, and monthly count cycles specifically to track this gap. The problem one operations director described is common: despite consistent counting schedules and structured action plans, the variance gap never closed. The count surfaces the number. It does not surface the attribution.
Which item is driving the gap? Is it happening at one location or across all of them? Is it concentrated in a specific time period, a specific storage area, or a specific team? Without drill-down attribution, the only response to a persistent variance is to count more often - which adds labour without solving the root cause.
Stock count software that provides attribution reporting changes the response. When a group's counting time is cut by more than 50% through automated workflows, the saved time only produces value if the variance data tells you where to apply it. Drill-down reporting by item, by location, and by period converts a variance number into an action: investigate this item at this branch this week. That is the capability that closes the gap over time.
Stock Count Software UX Gaps That Slow Multi-Site Execution
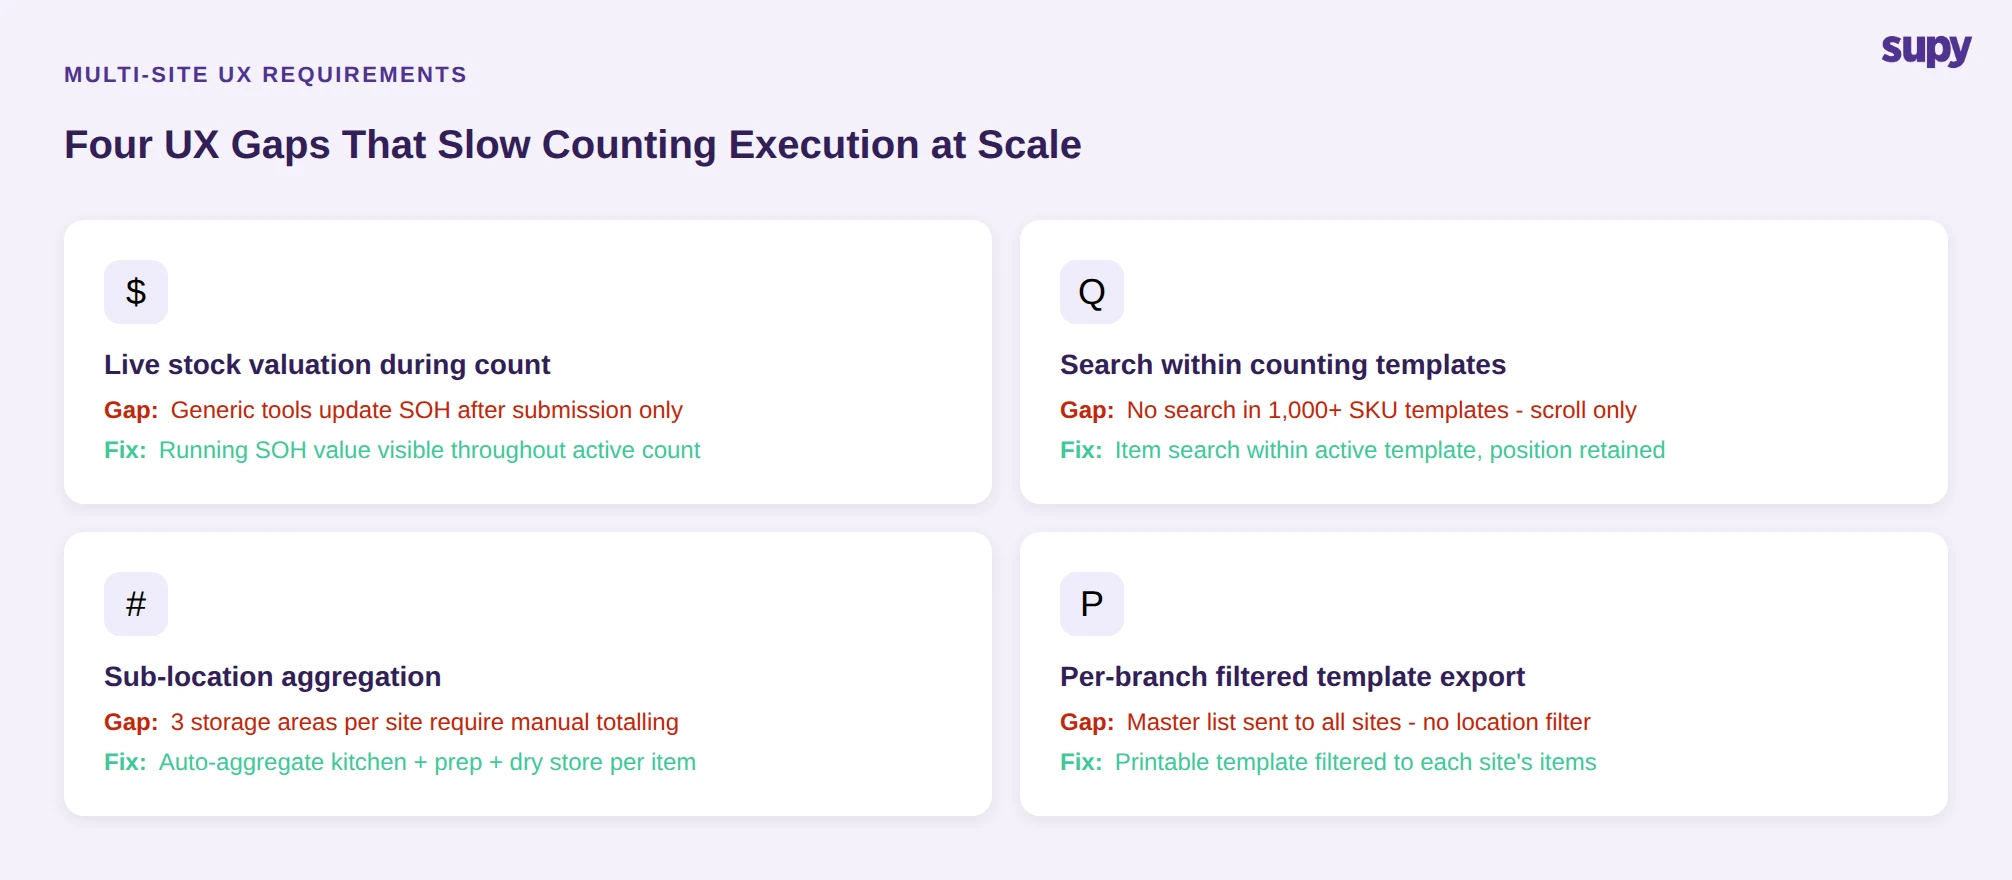
Beyond attribution, there is a layer of UX capability that separates tools designed for single-location use from tools designed for groups with 8 venues or more. Four specific gaps slow frontline execution at scale.
The first is live stock valuation during an active count. Generic tools update SOH values after a count is submitted. Purpose-built software calculates a running SOH value as items are counted, so the operations team can see the current valuation without waiting for the count to close. This matters when a manager needs to make a purchasing decision mid-count.
The second is search within counting templates. A counting template for a site with 1,000+ SKUs across categories is not navigable by scrolling. The ability to search within an active template - find a specific item and record its count without losing position in the template - directly affects how long a count takes.
The third is sub-location aggregation. A common multi-site workflow requires counting the same ingredient across 3 storage areas at one site - the main kitchen, a prep area, and a dry store - and having the system aggregate the totals into a single item count. Spreadsheets and single-location tools require manual addition. Purpose-built software handles this automatically, with each count location tracked separately for audit purposes.
The fourth is per-branch filtered template export. A group operations manager coordinating counts across multiple sites needs to send each location manager a count template filtered to that site's items - not a master list containing every item across the group. Printable blank template exports, filtered by branch, make offline or low-tech counting possible at locations where running a tablet is impractical.
Count Locking as a Finance and Audit Control
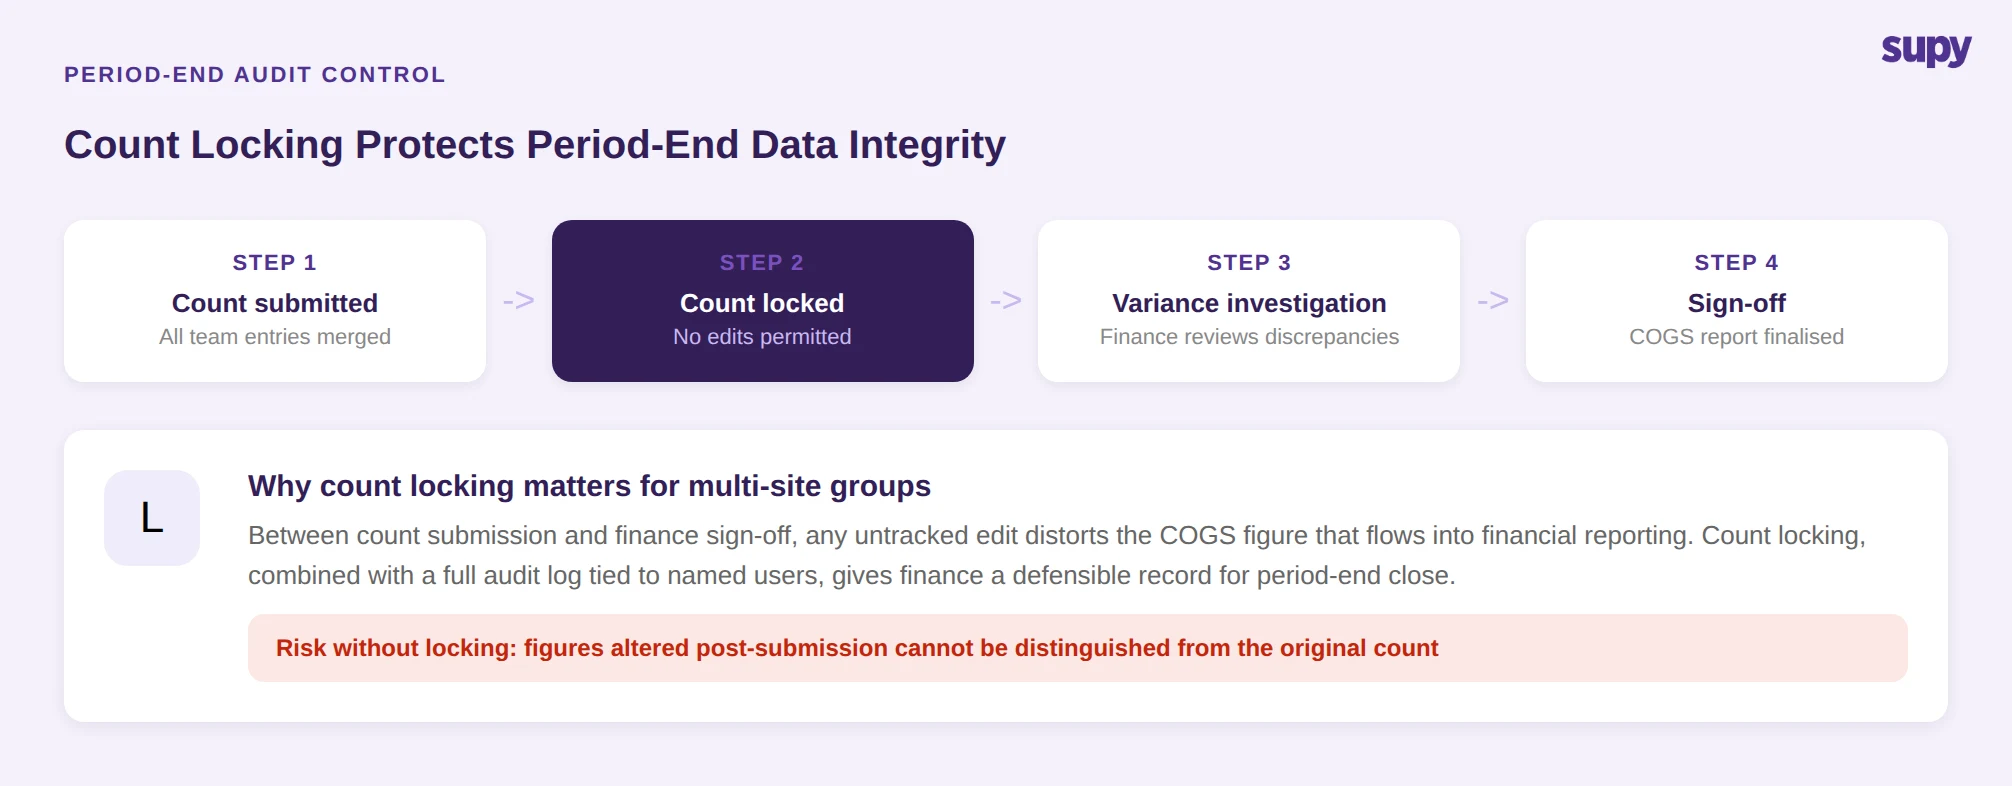
Once a stock count is submitted, there is a critical window between count completion and finance sign-off. During this window, if anyone can edit the count data - correcting figures, adjusting quantities, re-entering items - the final signed-off number may not reflect what was actually counted. For groups with formal period-end close processes, this is an audit risk.
Count locking addresses this directly. After a count is completed, the operations or finance team can lock it, preventing any edits while variance discrepancies are being investigated. The count data is preserved exactly as submitted until the investigation is complete and the count is formally signed off.
This capability is particularly relevant for groups that run monthly period-end stock takes alongside weekly cycle counts. The period-end count feeds directly into COGS calculations and financial reporting. Any post-submission edit that is not formally tracked and approved introduces a data integrity problem. Count locking, combined with a full audit log tied to named users and timestamps, provides the finance team with a defensible count record.
For operators running software evaluation, count locking is a feature to check explicitly - it is absent from most procedural how-to guides about stock counting, and it is not present in generic inventory tools. It is a differentiator that matters to finance teams rather than frontline staff, which is why it often goes unasked in demos.
How to Choose Restaurant Stock Count Software That Closes the Gap
The procedural content that dominates search results for restaurant stock count software focuses on speed: faster counting, automated calculations, time savings. These are real benefits. A software platform that reduces stock counting time by more than 50% compared to manual workflows frees significant operations capacity across a group.
But speed alone does not close the variance gap. A group that cuts counting time significantly but still cannot attribute variance to a specific item and location will keep running the same investigation cycle every period. The time saving disappears into manual follow-up work that purpose-built software would have automated.
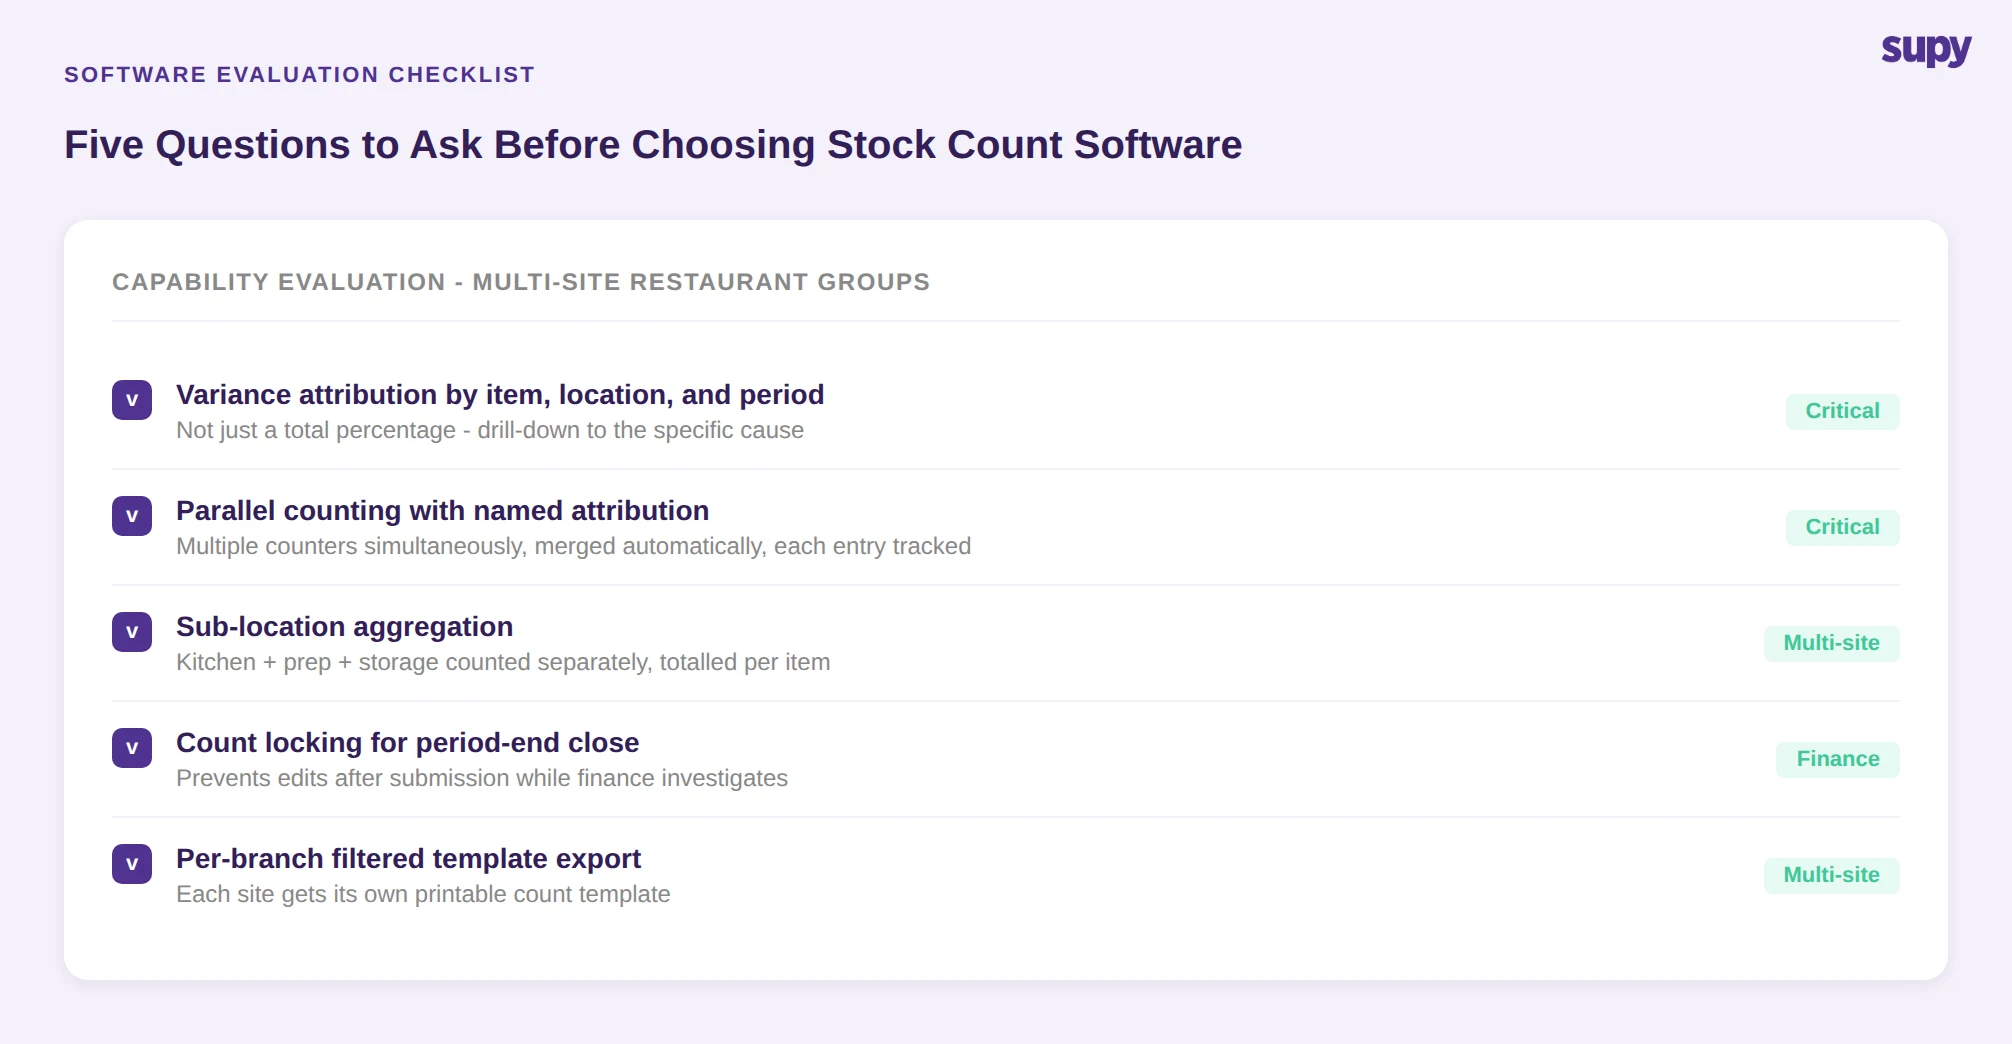
When evaluating restaurant stock count software, the questions that determine whether the tool will actually change food cost outcomes are: Does it provide variance attribution by item, location, and period? Does it handle sub-location aggregation automatically? Does it support parallel counting with named attribution so you know which counter recorded which quantities? Does it include count locking for period-end close? Does it provide per-branch filtered templates for multi-site coordination?
These are the capabilities that distinguish a stock count tool from a stock count workflow platform. The former records what you found. The latter tells you what to do about it. For a broader view of how stock counting fits into a full inventory management stack, see our guide to restaurant inventory software.
Supy's stock counting module is built specifically for multi-site restaurant groups, with parallel counting, variance drill-down, count locking, and filtered templates across locations. If your group is running more locations than your current tool was designed for, it is worth seeing how a purpose-built platform handles the workflows you are managing manually today.