.jpg)


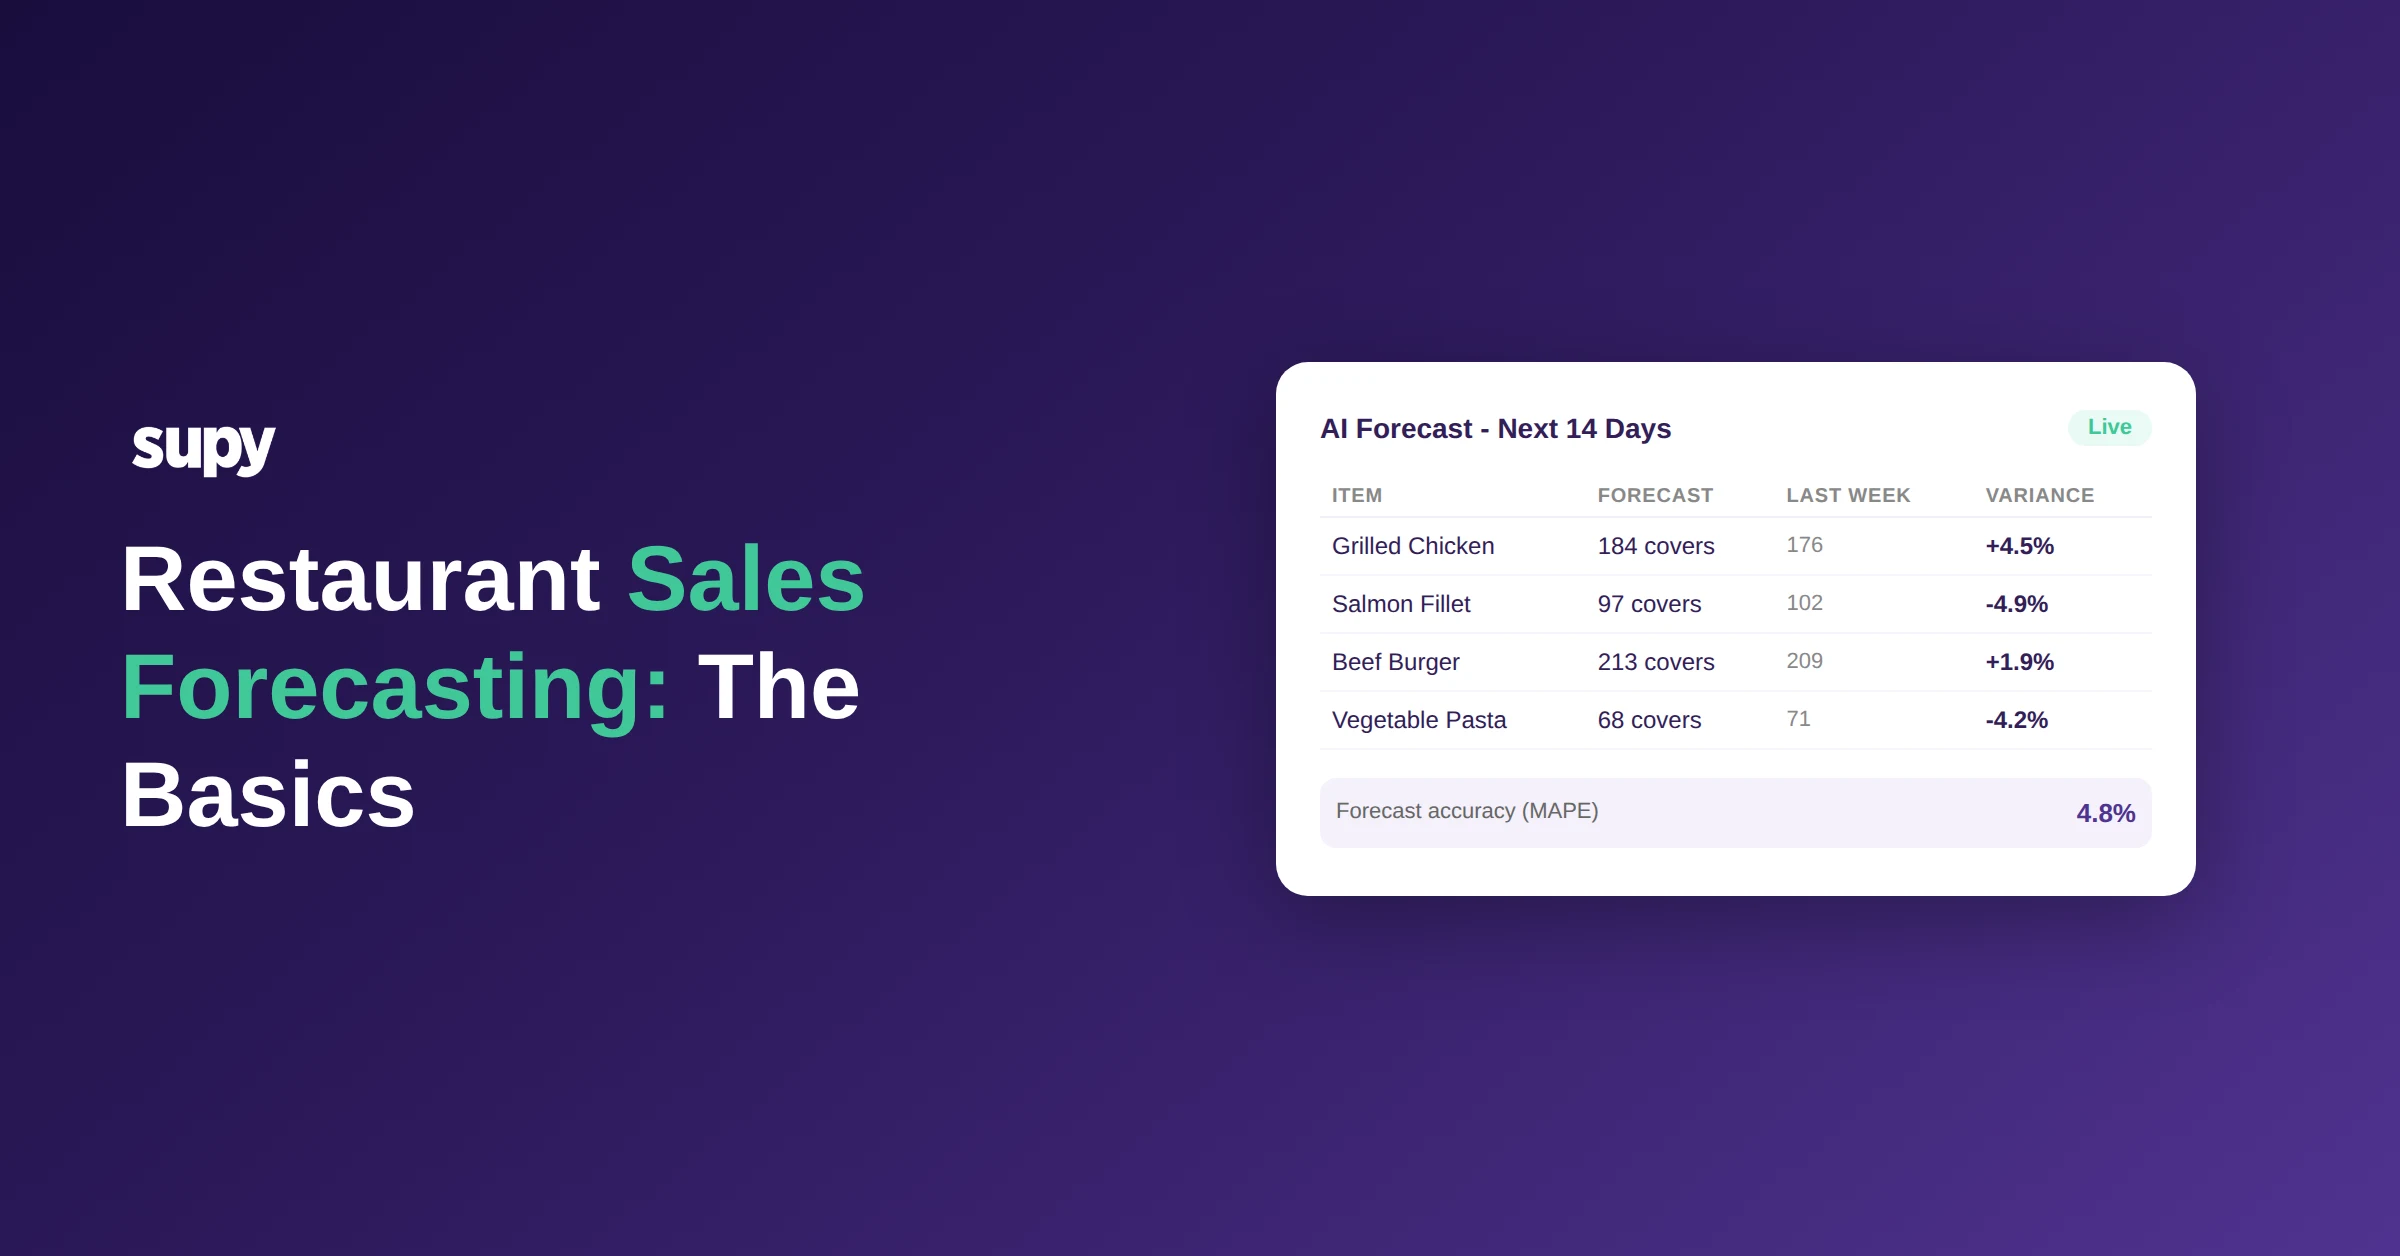
Restaurant Sales Forecasting: The Basics
Most restaurant operators know they should be forecasting. Fewer are doing it in a way that connects to what they actually order - and that gap is where food cost hides.
Sales forecasting is not complicated in principle. You look at what sold before, you account for what is coming up, and you predict what you will sell next. The difficulty is doing it consistently, at the level of detail that drives purchasing decisions, across multiple locations. This guide covers the five fundamentals - what every operator needs to understand before going deeper.
1. Your Forecast Is Only As Good As Your Data
Before any method or tool, you need clean historical sales data. A minimum of 12 months is the baseline - enough to capture a full seasonal rotation, including Christmas and festive trading peaks, summer tourist seasons, and major sporting events. Shorter windows miss cycles entirely.
What the data needs to include: daily sales by item (not just revenue totals), cover counts by daypart, and a clear distinction between voided orders and comped orders. Voided orders - cancelled before food was prepared - should be excluded from your demand figures. Comped orders - prepared and served without charge - should stay in, because the ingredients were still consumed.
If your data is messy, fragmented across multiple POS systems, or missing item-level detail, fix that first. The forecasting method you choose matters far less than the data quality beneath it.
2. The Right Method Depends on Your Scale
There is no single forecasting approach that works for all restaurant operations. The right one depends on how many locations you are running and how much time your team can realistically dedicate to the process.
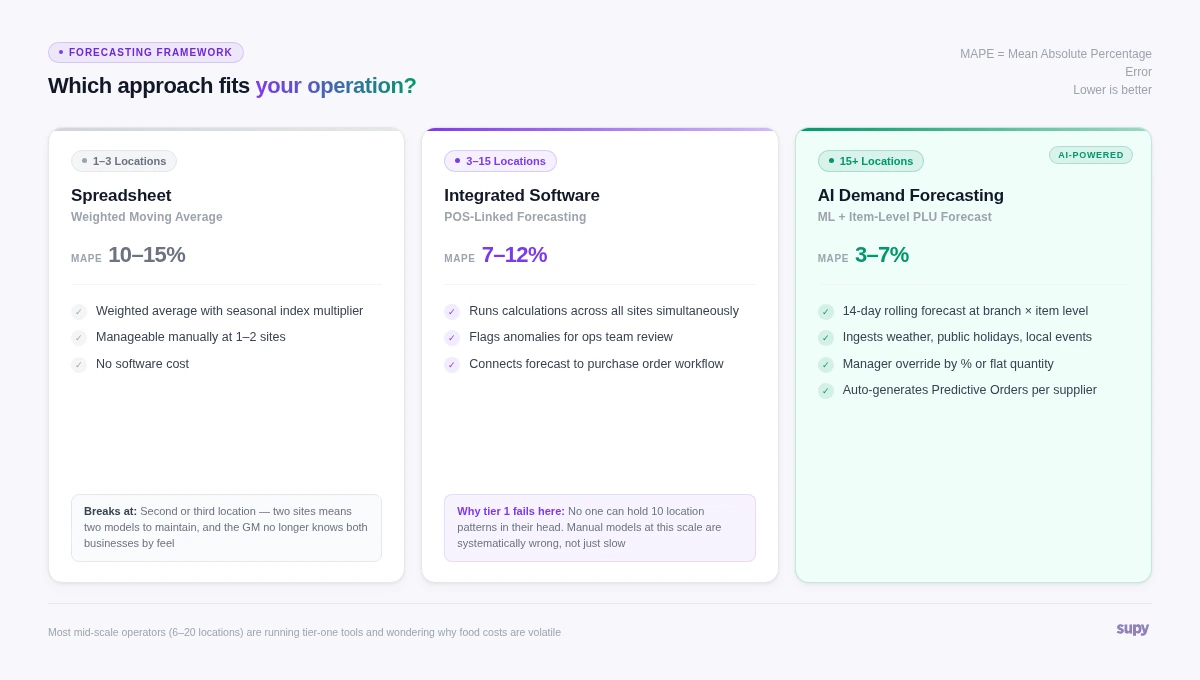
At one to three locations, a well-maintained spreadsheet can get you to 10 to 15% mean absolute percentage error (MAPE - the standard measure of forecast accuracy). At three to fifteen locations, you need software that runs calculations across all sites simultaneously. At fifteen or more, machine learning-based forecasting starts to pay for itself clearly, typically achieving 3 to 7% MAPE compared to 10 to 15% with manual methods.
Most mid-scale operators are running tier-one tools at tier-two scale - and wondering why food costs are volatile. The question is not whether to forecast, but whether your tools match your complexity.
For the full guide to each tier - including the exact weighting formula for spreadsheet forecasting and how AI demand forecasting connects to purchase orders - see Restaurant Sales Forecasting: How to Predict Demand and Plan Inventory.
3. Forecasted Covers Must Become Ingredient Quantities
A forecast that tells you how many guests to expect is useful. A forecast that tells you how many kilograms of chicken thigh, how many litres of cream, and how many portions of sea bass to order - that is what drives purchasing.
The bridge is your recipe library. For each menu item in the forecast, you apply the portion weight and a yield factor - the percentage of raw ingredient that survives prep and cooking - to calculate the actual raw order quantity per portion. Without yield factors, your calculations are systematically wrong. A 90g recipe card weight becomes a 115g purchase requirement once a 0.78 yield factor is applied. That gap, multiplied across your highest-volume proteins and several locations, adds up fast.
This step is where most operators stall manually. Supy's forecasting engine applies your recipe cards automatically, converting item-level sales predictions into a complete ingredient demand list per supplier, per location, per day - without manual calculation.
4. Build In a Buffer for Each Ingredient Category
Even an accurate forecast needs a safety margin - a buffer to absorb variance in demand and in supplier delivery reliability. The size of the buffer should vary by ingredient category.
Fresh proteins need a higher margin (8 to 15%) because demand is harder to predict and the consequence of running out mid-service is immediate. Dry goods and ambient ingredients can sit at a lower buffer (3 to 7%) because lead time and shelf life give you more flexibility. Applying the same flat percentage to everything ties up unnecessary working capital on ambient stock while leaving you exposed on perishables.
5. The Forecast Should Drive Your Purchase Orders
The most important thing to understand about sales forecasting is this: if it does not change what you order, it has not worked.
A forecast that stays in a spreadsheet and requires manual translation into a purchase order will be used inconsistently. The teams that make forecasting stick are the ones that connect it directly to purchasing - so the forecast output automatically surfaces draft purchase orders per supplier, per location, which a buyer then reviews and approves.
Across operators using Supy's Predictive Orders module, teams reclaim an average of 40 hours per location per month previously spent on manual ordering. That time saving is not the primary benefit. The primary benefit is that purchasing stops being reactive and starts being planned.
Start Simple, Then Build
You do not need AI forecasting or multi-location software to start. You need clean data, a consistent weekly process, and a clear link between what the forecast says and what gets ordered. Build that foundation at your current scale, then upgrade your tools as your complexity grows.
When you are ready to go deeper - into yield factor calculations, safety margin frameworks, and how to evaluate AI forecasting options for larger estates - the full implementation guide covers all of it: Restaurant Sales Forecasting: How to Predict Demand and Plan Inventory.
About Supy
Supy is a back-of-house operations platform built for multi-location restaurant groups. The platform connects procurement, inventory management, and AI-powered demand forecasting into a single operational system - from item-level sales forecasting through to Predictive Orders that generate draft purchase orders per supplier automatically. Teams using Supy typically achieve a 7% reduction in food costs and reclaim 40-plus hours per location per month previously spent on manual ordering.