.jpg)


Why COGS Reporting Breaks Down Across Multiple Restaurant Locations And How To Fix It
Why COGS Reporting Breaks Down Across Multiple Restaurant Locations
A single-site operator can run a reasonably accurate COGS report by reconciling one stocktake against one set of purchases. The maths is contained. For a group running five or more locations, the same logic produces five separate reports that nobody has combined.
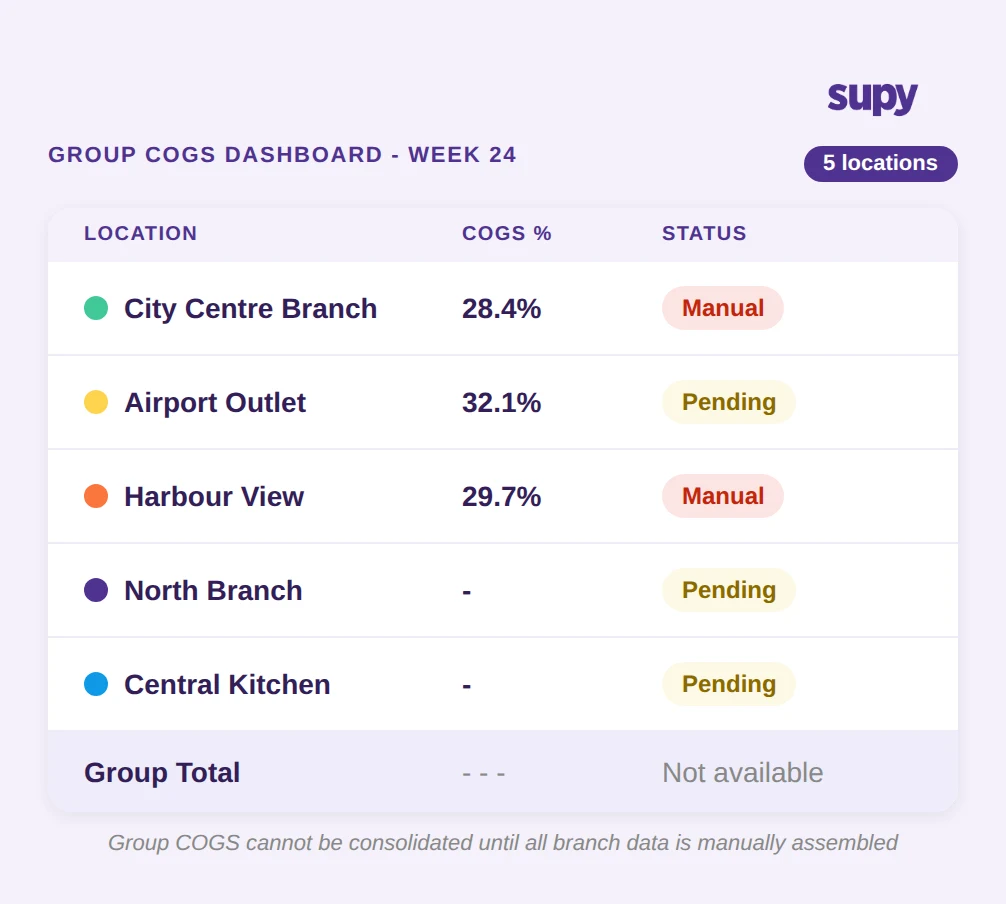
The core problem is that branch-level systems are not designed to aggregate upward. Each location tracks its own stock, receives its own deliveries, and runs its own counts. Without a layer above that consolidates those inputs, group-level COGS does not exist as a live number. It exists only as a calculation that someone builds manually, usually under time pressure.
This creates two downstream failures. First, reporting is always backward-looking - by the time the group number is assembled, the week it describes has already ended. Second, there is no way to compare performance across branches at the same point in time, which makes it impossible to know whether a high COGS week was driven by one underperforming location or spread across the group.
The question to ask: does your current process produce a group COGS number before the weekly meeting, or after?
The Monday Morning Extraction Problem: Hours of Manual Work, One Number
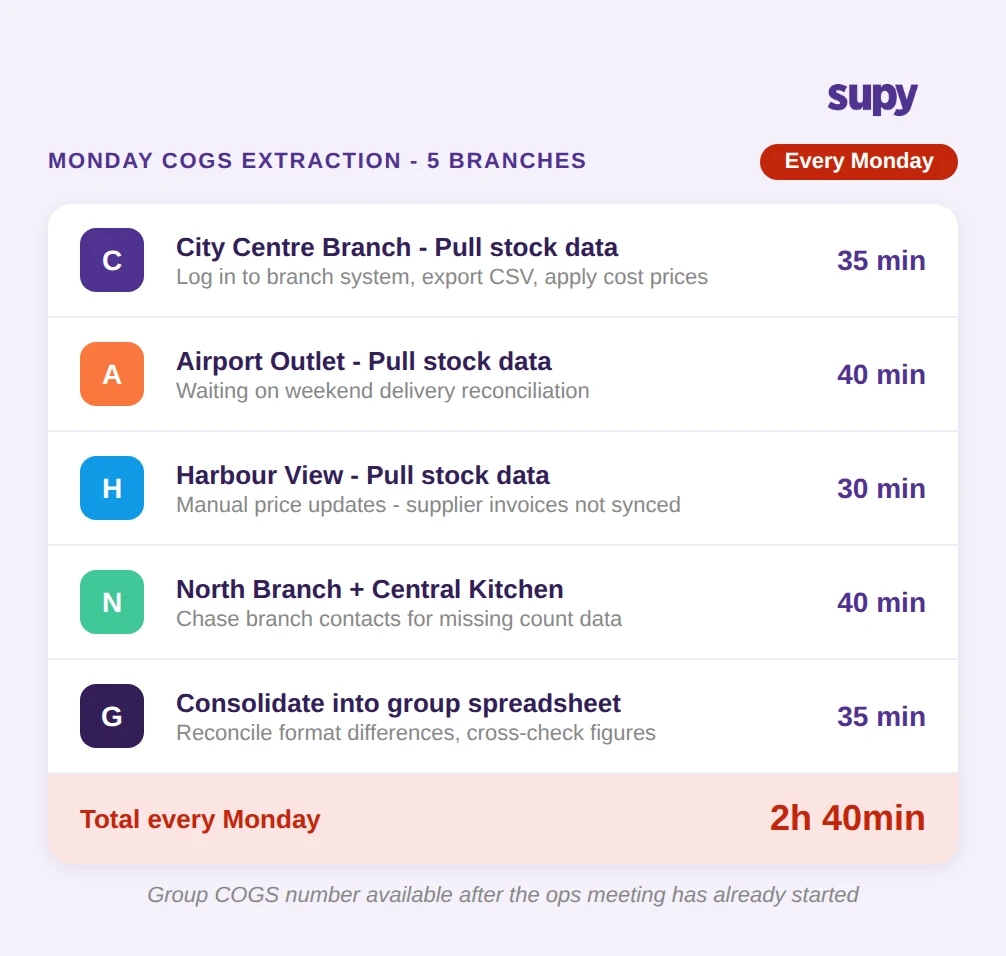
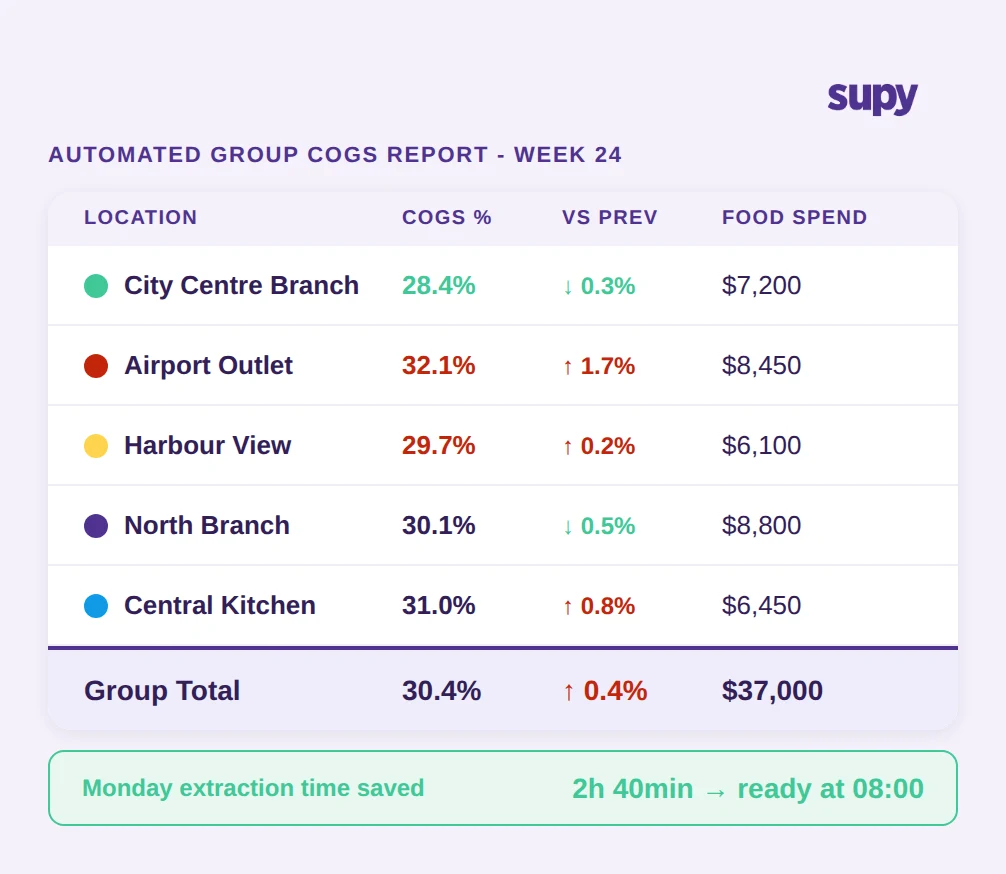
Finance managers at multi-site groups consistently describe the same Monday routine: logging into each branch system individually, pulling stock movement data, exporting to spreadsheet, applying cost prices, and consolidating into a single figure. For a group with five to eight locations, that process takes 2-4 hours every week - time that produces one backward-looking number with no audit trail and no breakdown by item or category.
The problem compounds when a branch has not yet processed the weekend deliveries, or when a count was completed but not synced. The group finance manager has to chase individual branch contacts before the consolidation can even begin. The result is a COGS number that is both late and, in many cases, incomplete.
One multi-site operator described spending several hours each Monday manually pulling inventory values from individual branch systems before consolidating into a single group report. The consolidated number was ready by late morning - after the ops meeting had already taken place.
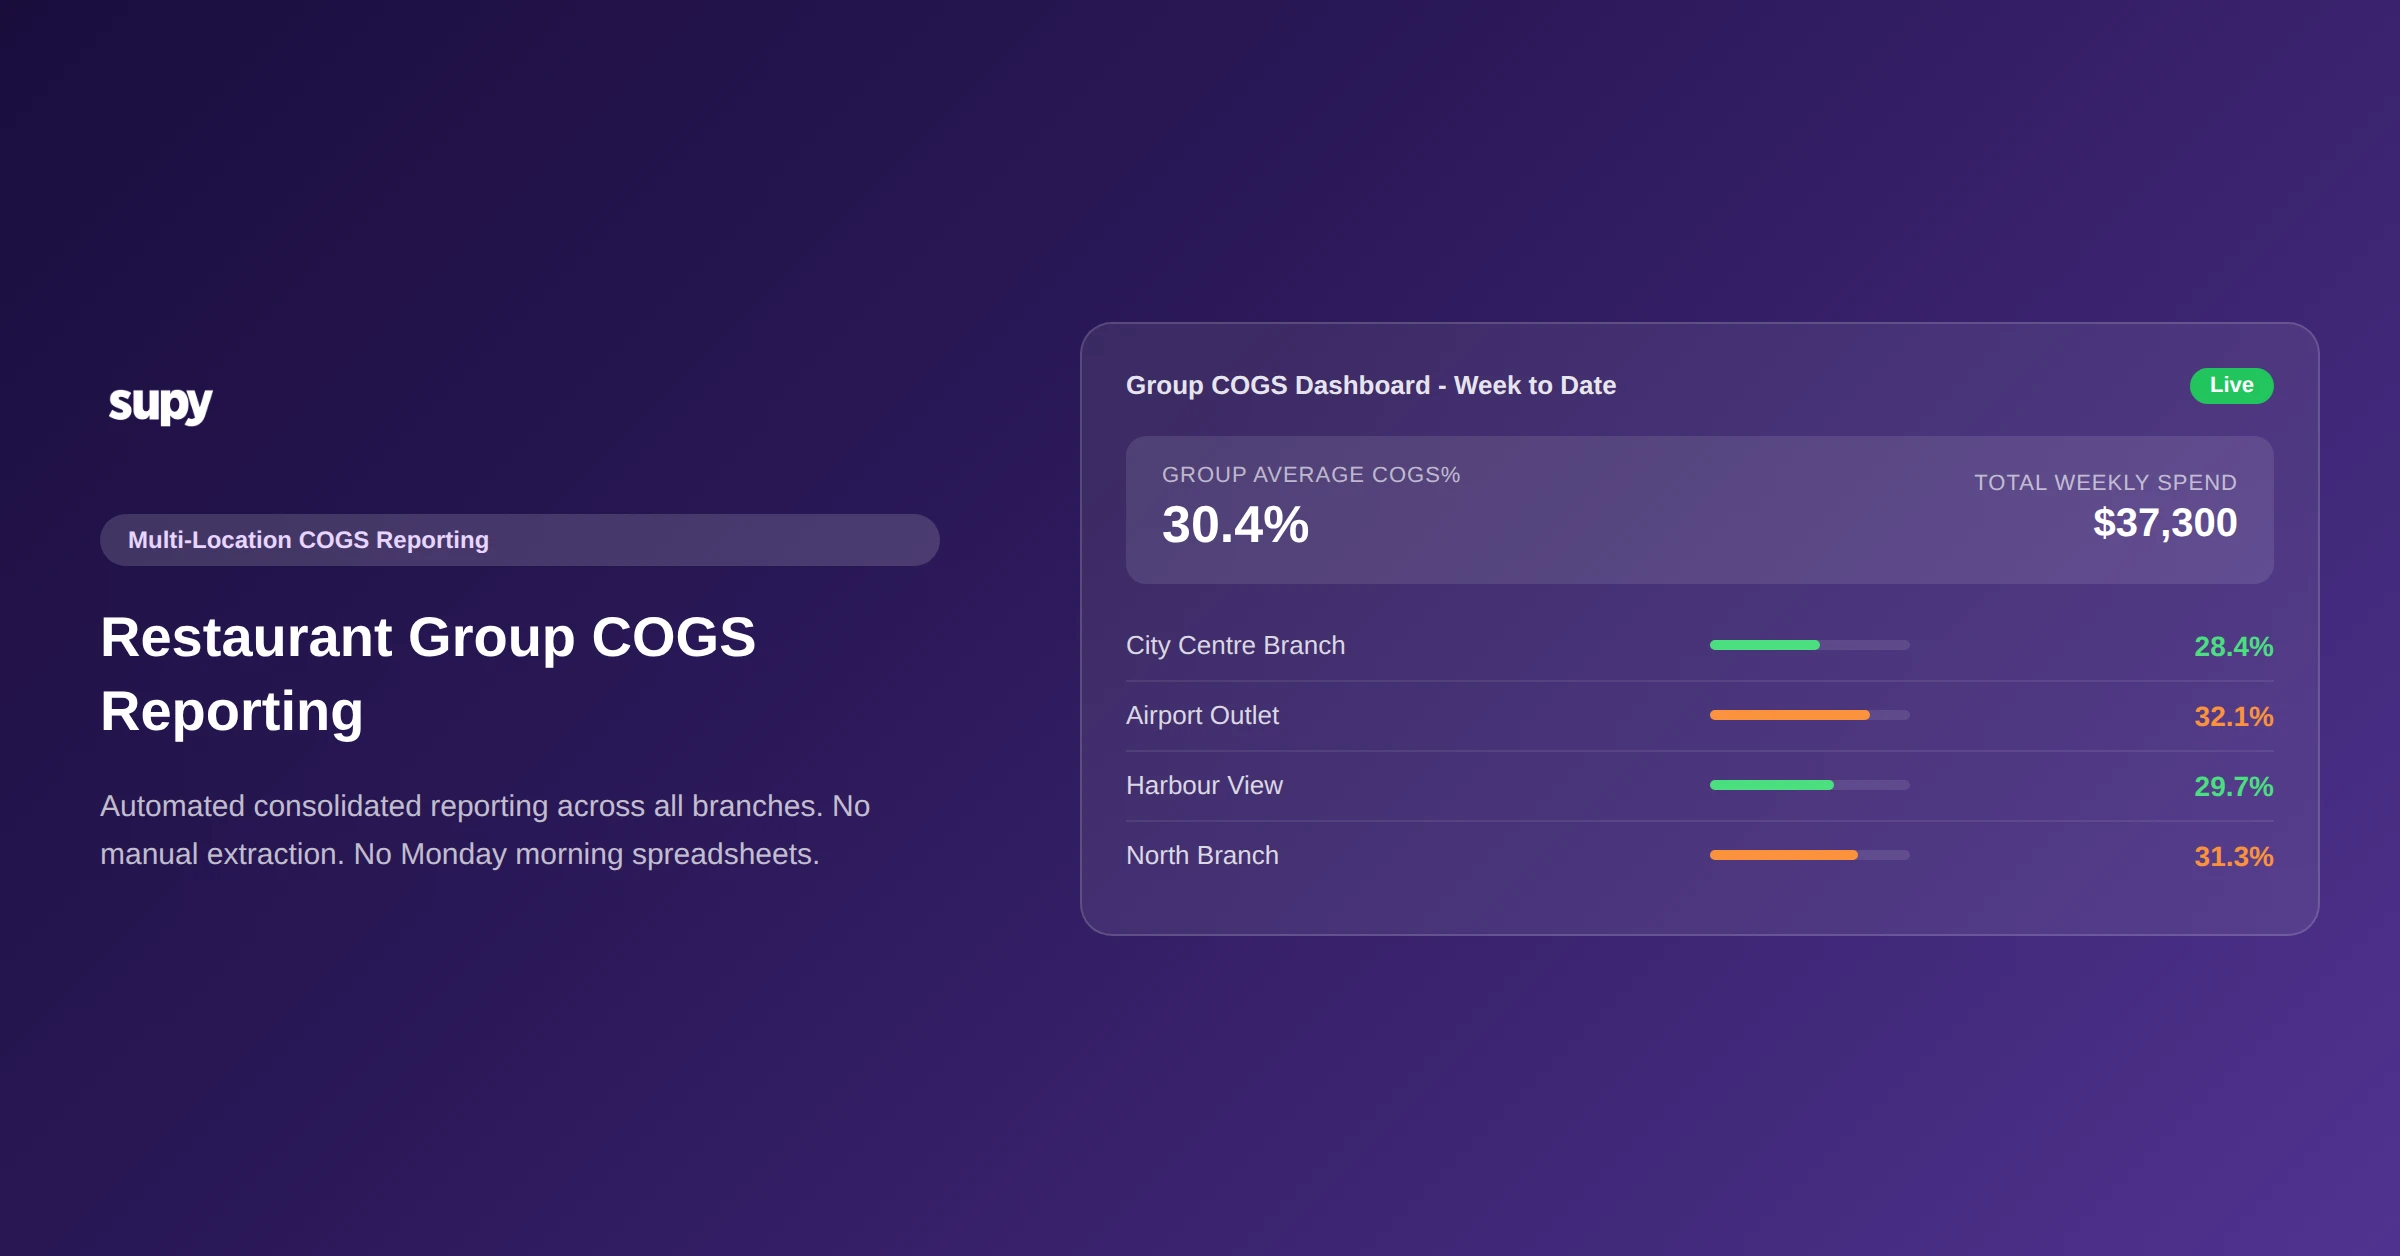
There is also a cost accuracy problem embedded in manual extraction. When cost prices are applied in a spreadsheet rather than pulled from a system that updates automatically from supplier invoices, any price change that occurred during the week may not be reflected. A group running $37,000 in weekly food spend across four branches cannot afford COGS figures built on last week's prices.
The question to ask: when was your most recent group COGS figure assembled, and what data was missing from it?
How Automated COGS Reporting Gives Group Finance Teams Their Time Back
The shift from manual extraction to automated group reporting depends on two things: a system that receives data from all branches without manual input, and a reporting layer that consolidates and presents that data in a usable format.
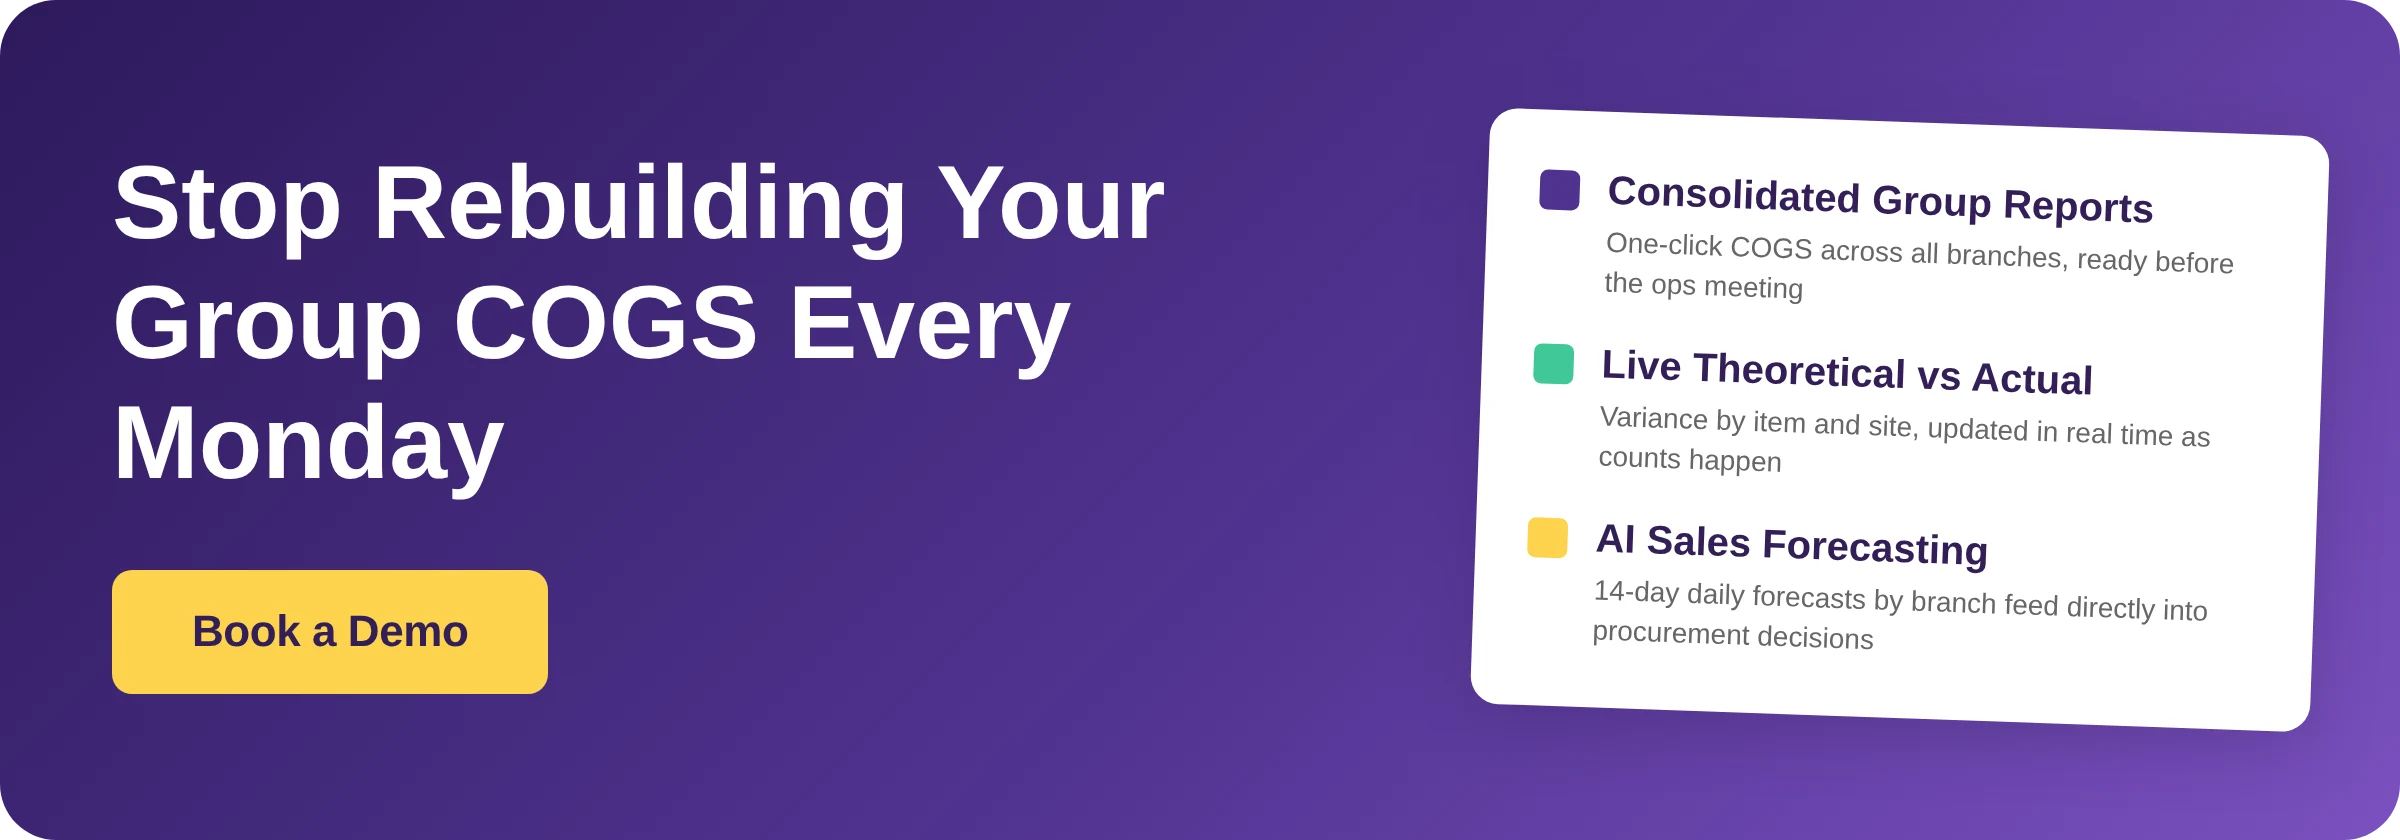
Purpose-built group reporting software generates one-click Excel and CSV exports across procurement, sales, COGS, stock movement, wastage, and recipe costing - at both group and individual site level. Custom enterprise templates mean the Monday morning report can be configured once and generated in seconds rather than hours. Data from branches flows in automatically - GRNs update stock values as deliveries are received, and recipe usage flows through from POS sales data without manual entry.
For the ops meeting, the relevant output is the group COGS dashboard: live food cost percentage at group level with drill-down by site, menu category, or individual dish. Rather than assembling a spreadsheet, the finance manager opens a dashboard that already contains the consolidated position.
The broader point is that proper restaurant inventory management software is not just about counting stock - it is about ensuring that stock data flows into financial reporting without a manual step in between.
The question to ask: how many manual steps sit between a delivery being received at a branch and that cost appearing in your group COGS figure?
Theoretical vs Actual Variance: Seeing Which Branch Is Driving the Cost
COGS as a percentage tells you whether costs are in range. It does not tell you why they are out of range, or where. For a multi-site group, the difference between a 28% and a 32% COGS across branches is significant - but without a theoretical-vs-actual view, it is invisible.
Theoretical consumption is what should have been used, calculated from recipes and sales volume. Actual consumption is what the stock count records as used. The gap between the two reflects portioning inconsistencies, unrecorded waste, theft, and counting errors. Without recipe-linked tracking, those variance sources cannot be separated, and the group has no basis for targeted action.
Operators evaluating inventory software consistently identify the inability to compare theoretical vs actual consumption as their biggest reporting blind spot. When all you have is an actual COGS figure, every investigation starts from scratch: is the variance in this branch from food waste? Over-portioning? Supplier delivery shortfalls? Stock loss?
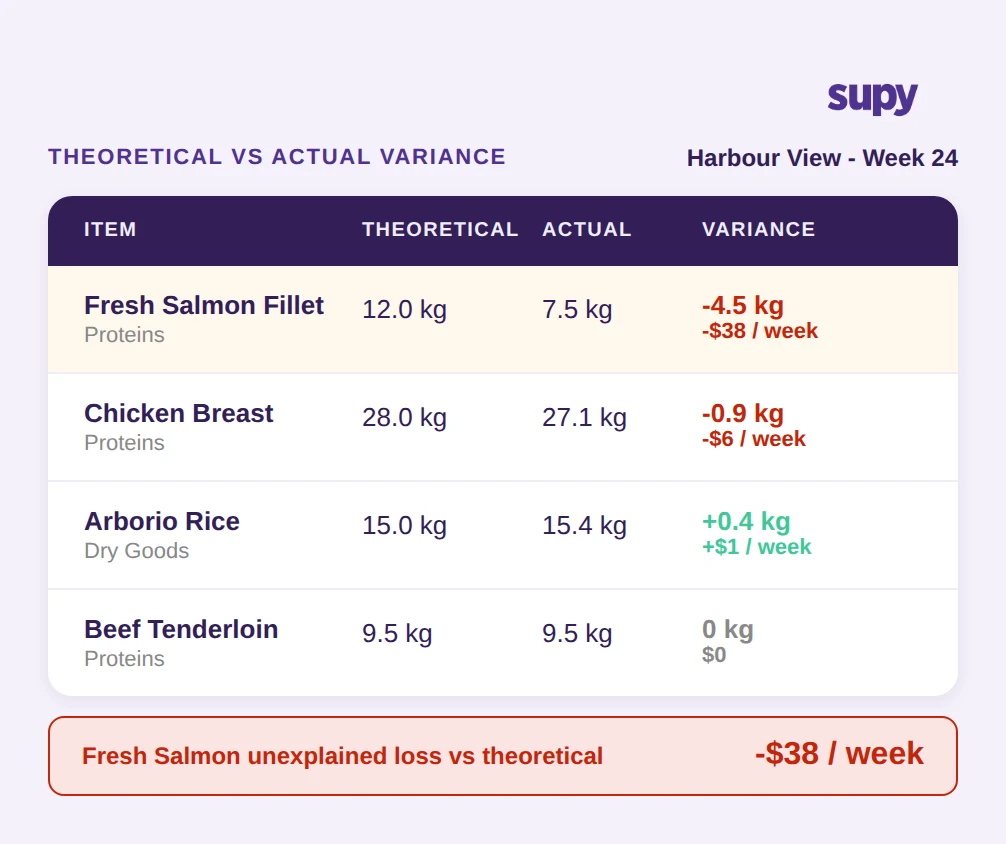
Group inventory dashboards show theoretical-vs-actual variance by type, site, and individual item. The Harbour View branch running at 29.7% COGS may look acceptable in aggregate - but if its Fresh Salmon shows a -4.5kg variance against theoretical, that is $38 per week in unexplained loss from a single item. At group level, that calculation runs across every item at every branch simultaneously.
For food cost control to work at group scale, theoretical-vs-actual tracking needs to be recipe-linked and consolidated, not assembled separately for each location.
The question to ask: when a branch runs a high COGS week, can you identify the specific items and categories driving the variance without manual investigation?
Live Stock Valuation During Counting: Closing the COGS Lag
A less visible but equally costly problem is the gap between when a stocktake happens and when it produces a usable COGS figure. In a traditional process, count sheets are completed, entered into a system, reconciled against purchase records, and then a COGS figure is produced - a sequence that can take days. During that period, the group's inventory position is unknown.
For multi-site groups running period-end counts across multiple locations simultaneously, this lag multiplies. Location A finishes counting on Tuesday. Location B is still counting on Wednesday. Until both counts are processed, the group COGS for the period is incomplete.
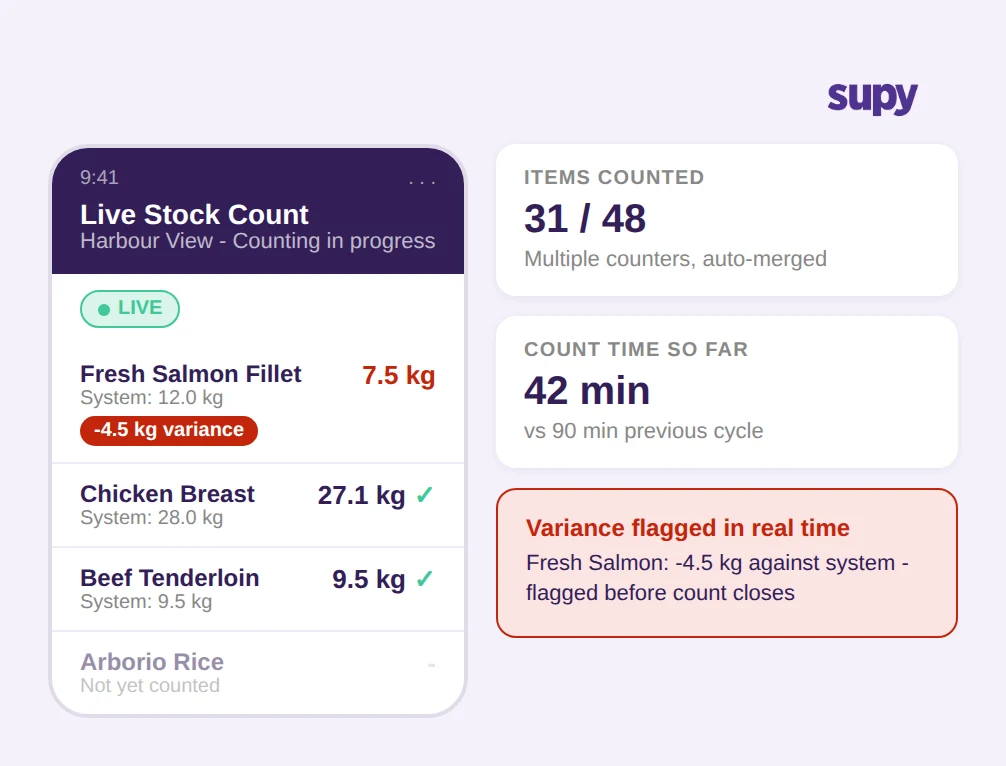
Modern inventory platforms enable parallel counting - multiple counters working simultaneously on the same count, with contributions auto-merged and attributed by counter. Variance against system is available instantly during the count, not after it. When a counter records 7.5kg of Fresh Salmon against a system figure of 12.0kg, the -4.5kg variance appears in real time, flagged for review before the count is even closed.
The practical effect is that the COGS lag shrinks from days to hours. Groups using this approach report more than 50% reduction in time spent on stock counting, with the added benefit that live variance data surfaces discrepancies that would previously only appear after post-processing.
The question to ask: at any point during your current counting cycle, can you see the group's live inventory position and expected COGS outcome?
Turning Weekly COGS Reports Into a Decision Tool, Not a Summary
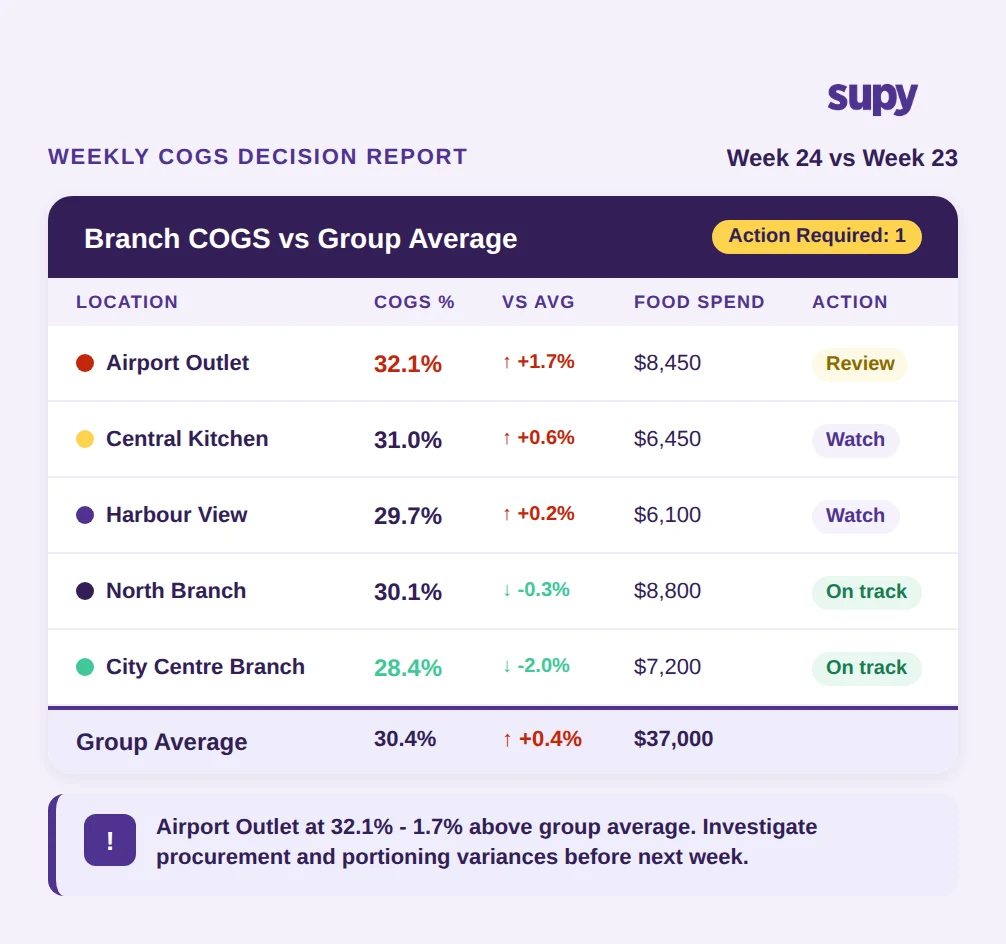
A COGS report that arrives after the decisions have been made is a summary. A COGS report that arrives before - with branch-level breakdowns, variance flags, and trend data - is a decision tool.
The distinction matters operationally. When the finance team can see that Airport Outlet is running at 32.1% COGS against a group average of 30.4%, the question in the ops meeting is specific: what is driving the Airport Outlet variance this week? Is it a procurement issue (purchase prices up), a portioning issue (high theoretical-vs-actual gap), or a wastage issue (waste logs show elevated loss)? Each diagnosis points to a different action.
Without consolidated multi-location COGS reporting, those questions cannot be asked with precision. Branch managers making ordering decisions based on memory rather than live data is not a discipline problem - it is a data availability problem. One group operating across eight locations found that without live stock data, branch managers regularly over-purchased perishables and ran undetected inter-branch stock discrepancies.
AI sales forecasting adds a forward-looking layer: daily sales predictions by branch for the next 14 days, down to menu item level, feeding into procurement and staffing decisions before costs are incurred rather than after. Combined with live COGS dashboards and automated weekly reports, the ops meeting shifts from reviewing what happened to deciding what to do next.
The question to ask: does your current COGS report tell you what to do next week, or only what happened last week?
How Supy Addresses the Multi-Location COGS Reporting Problem
Supy is built for multi-site F&B groups. The specific features that address the reporting problems described in this article are:
Interactive Dashboards - Live COGS and food cost percentage at group and site level, with theoretical-vs-actual variance by type, site, and item. Slow-mover identification, profitability by site and category, with drill-down and export.
Spreadsheet Reports - One-click Excel/CSV exports covering procurement, sales and COGS, stock movement and variance, and recipe costing at group or individual site level. Custom enterprise templates.
Live Stock Visibility - Real-time stock on hand by location, category, and storage unit. Theoretical-vs-actual usage. Auto-updates from GRNs and recipe usage without manual sync. Par and minimum thresholds per item per site with alerts.
Stock Counting - Parallel counting with auto-merge and attribution, instant variance vs system during count, mobile and tablet compatible. More than 50% reduction in counting time.
AI Sales Forecasting - 14-day daily sales forecast by branch, forecast-vs-actual tracking, daily POS sync, manager override at day and item level.
For groups currently spending 2-4 hours every Monday on manual extraction, the operational impact is immediate: the Monday number is already there, and the 2-4 hours become available for analysis rather than assembly.