.jpg)


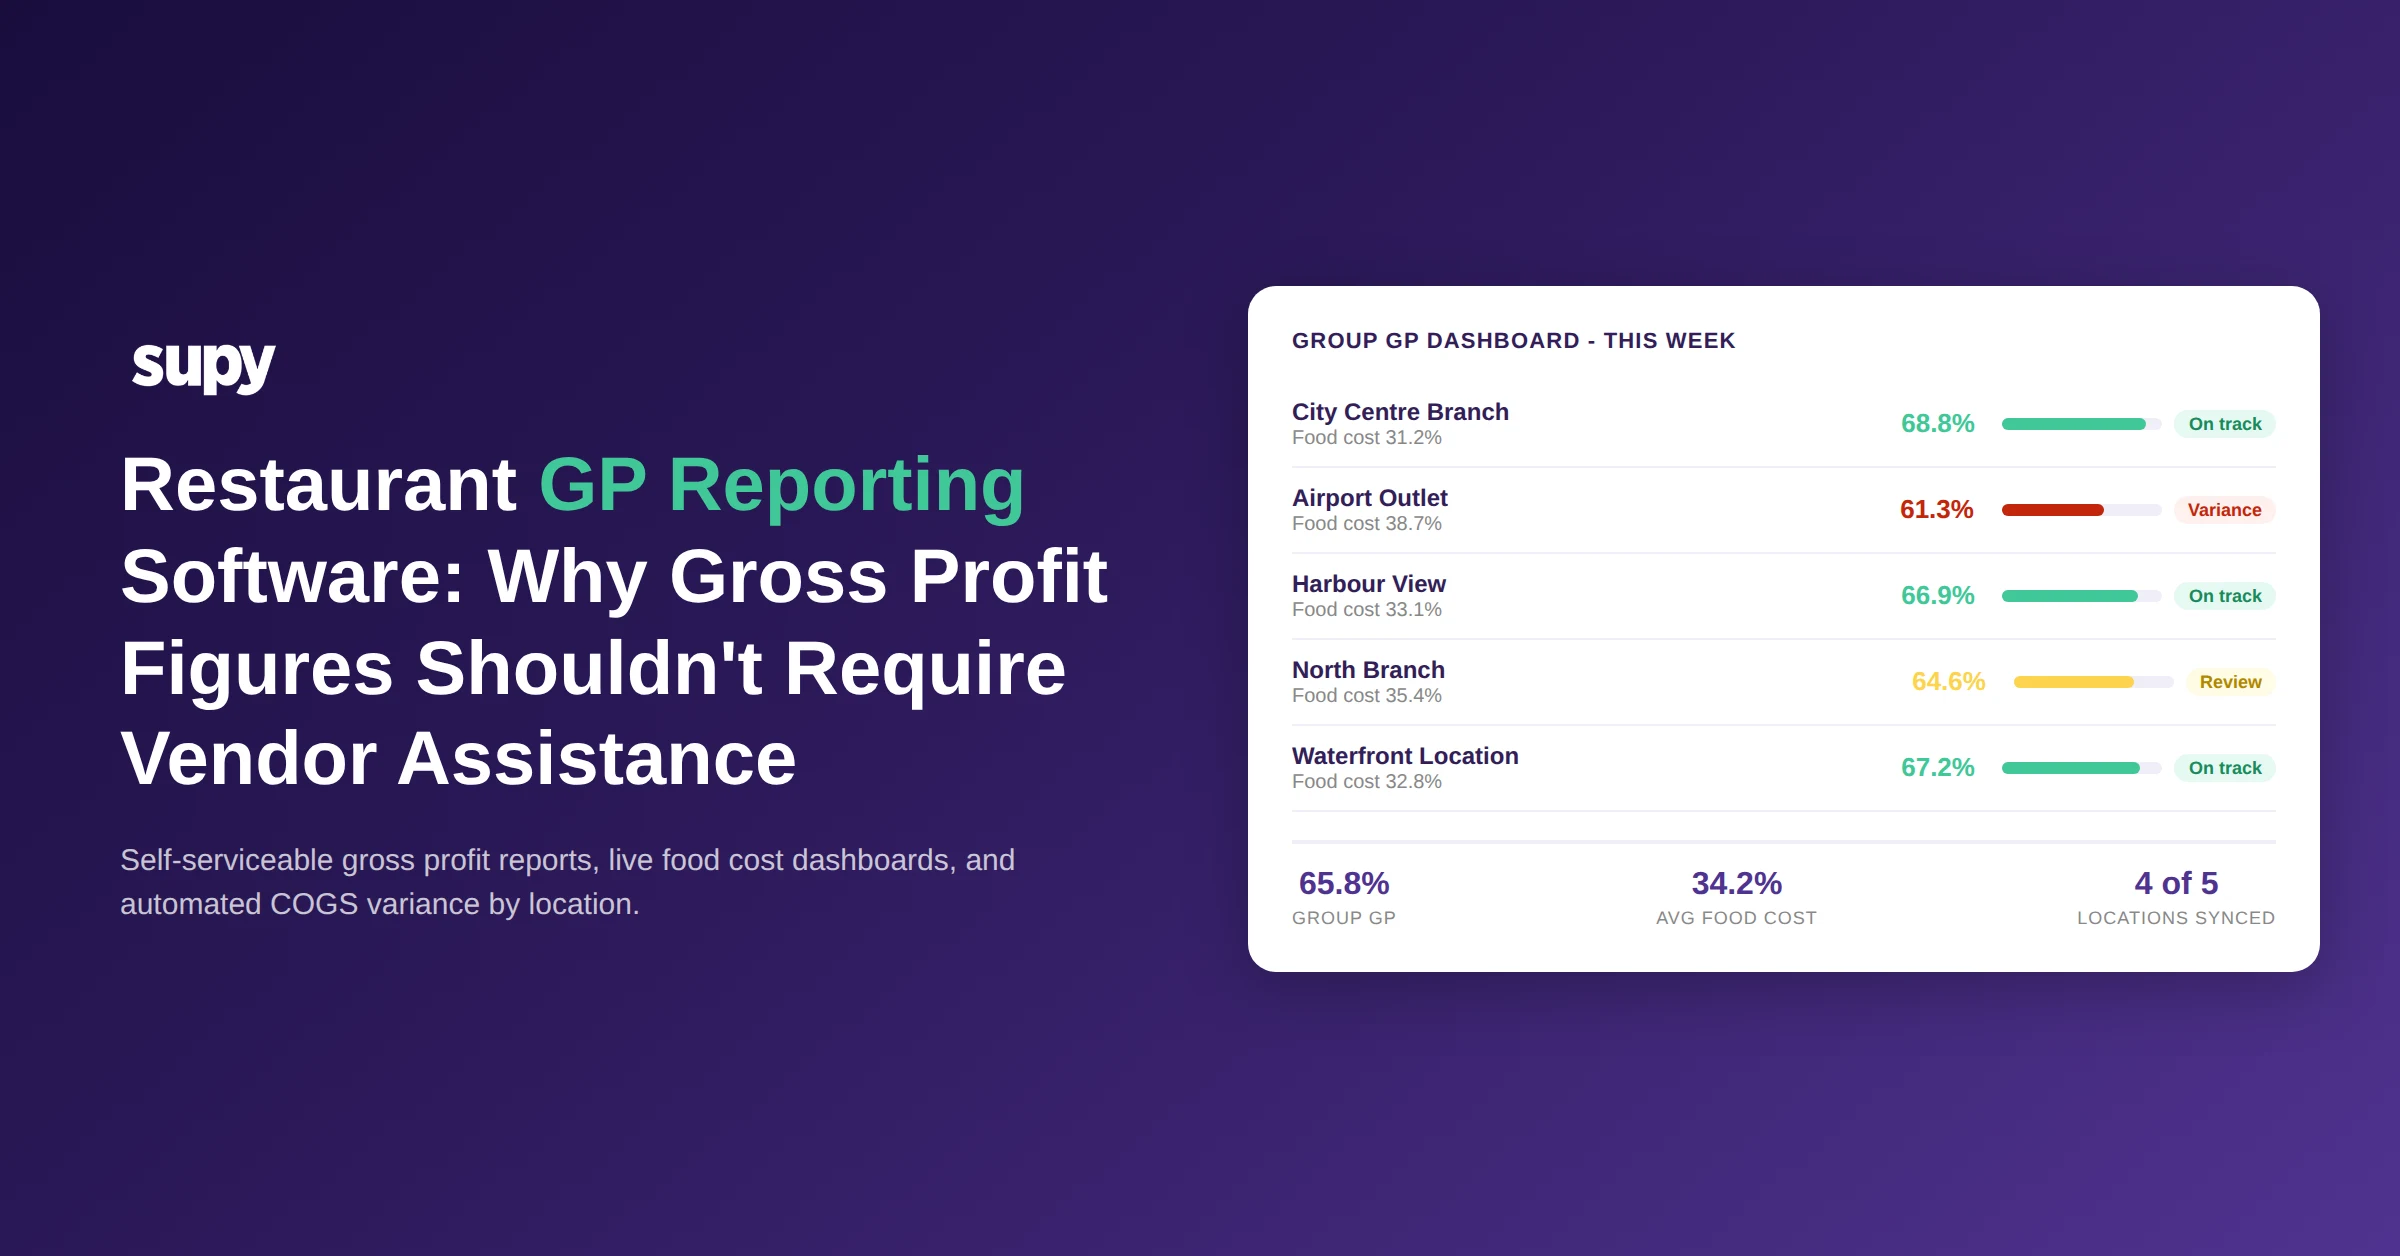
Restaurant GP Reporting Software: Why Gross Profit Figures Shouldn't Require Vendor Assistance to Generate
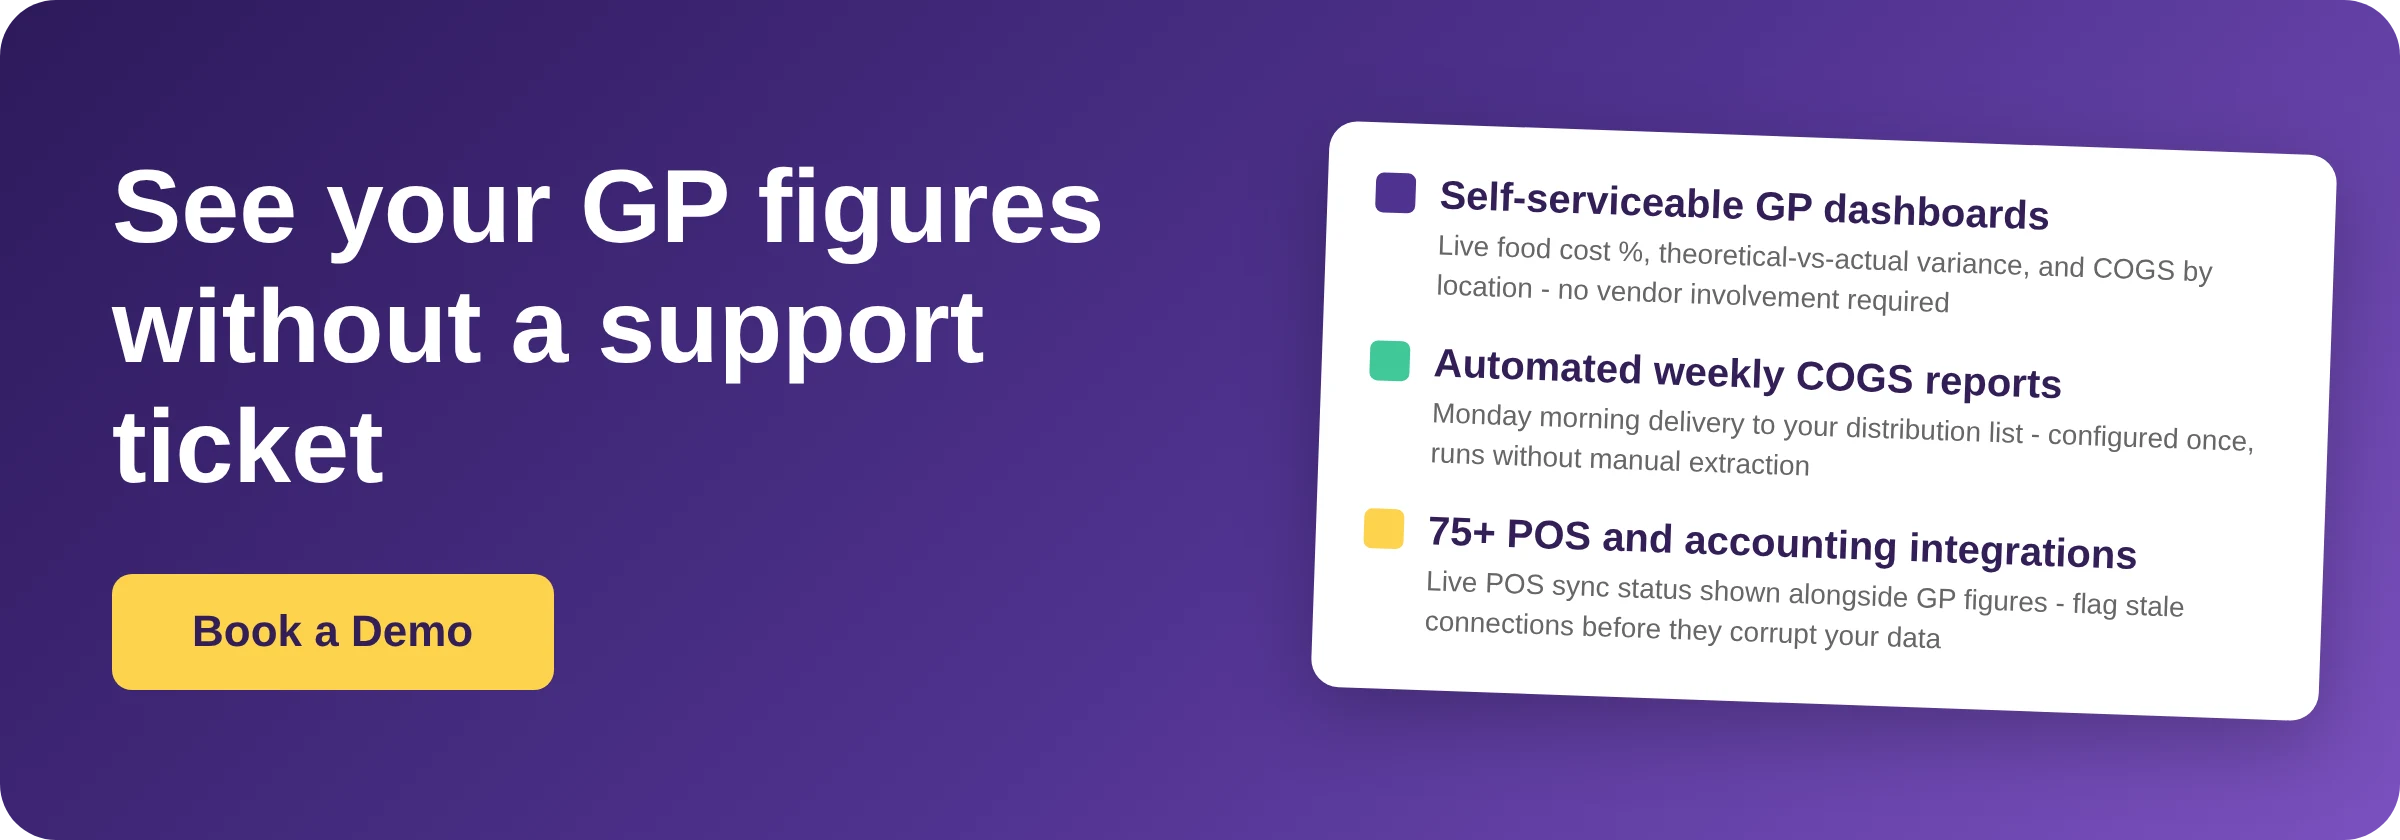
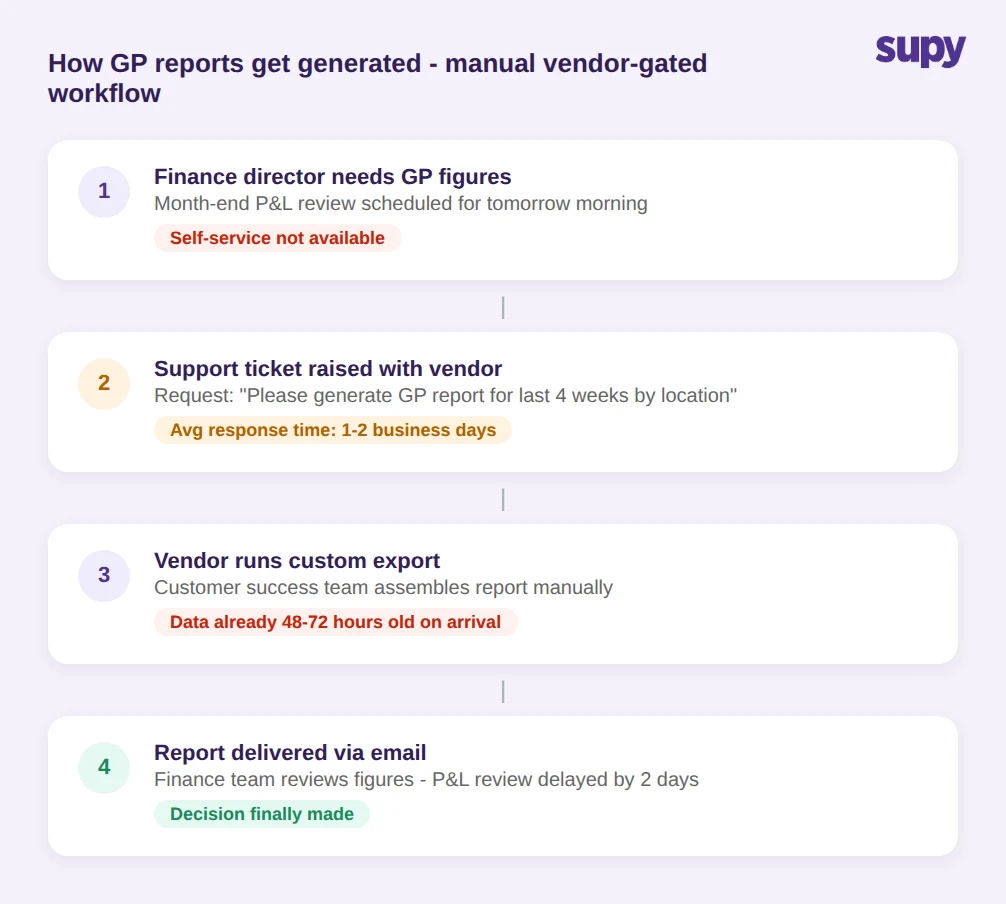
A finance director at a multi-site restaurant group should not need to raise a support ticket to see their own gross profit figures. Yet for 4+ operators evaluating restaurant GP reporting software, that is exactly what they described: the GP report exists in the tool, but generating it in a usable format requires calling the vendor customer success team. That friction has a real cost - delayed decisions, missed variance windows, and a finance function that learns to stop trusting its own data.
The problem is structural. Most restaurant inventory platforms were built for operations teams, not finance teams. The GP reporting layer is an afterthought, assembled on request rather than surfaced automatically. Understanding what breaks restaurant GP reporting software - and what a self-serviceable alternative looks like - starts with the three most common failure points: invoice ingestion, POS integration, and the architecture of the reporting layer itself.
Why GP Figures Still Require Vendor Help in Most Restaurant Inventory Tools
Many restaurant inventory tools were designed with operations managers, not finance directors, as the primary user. Inventory counts, purchase orders, and waste logs are front and centre. The reporting layer - particularly the GP and P&L outputs - is treated as a derived output, assembled on request rather than surfaced automatically.
The result is a reporting architecture that works well for operational decisions but fails on financial self-serviceability. GP figures depend on a clean data chain: accurate invoice ingestion from every supplier, correctly mapped recipes tied to those invoices, and a live POS connection that feeds sales actuals. Break any one link and the system still produces a number - it just does not produce a reliable one.
Finance teams that catch this discrepancy typically do so during month-end reconciliation, when the GP the inventory tool reports diverges from the management accounts. By then, the variance has been accumulating for weeks. The tool has not flagged that anything is wrong - it has simply generated figures on incomplete data. The vendor explanation is almost always that setup was not fully complete, which puts the blame on the operator rather than on the system failure to surface a broken data chain.
How Incomplete Invoice Ingestion Corrupts Your Gross Profit Data
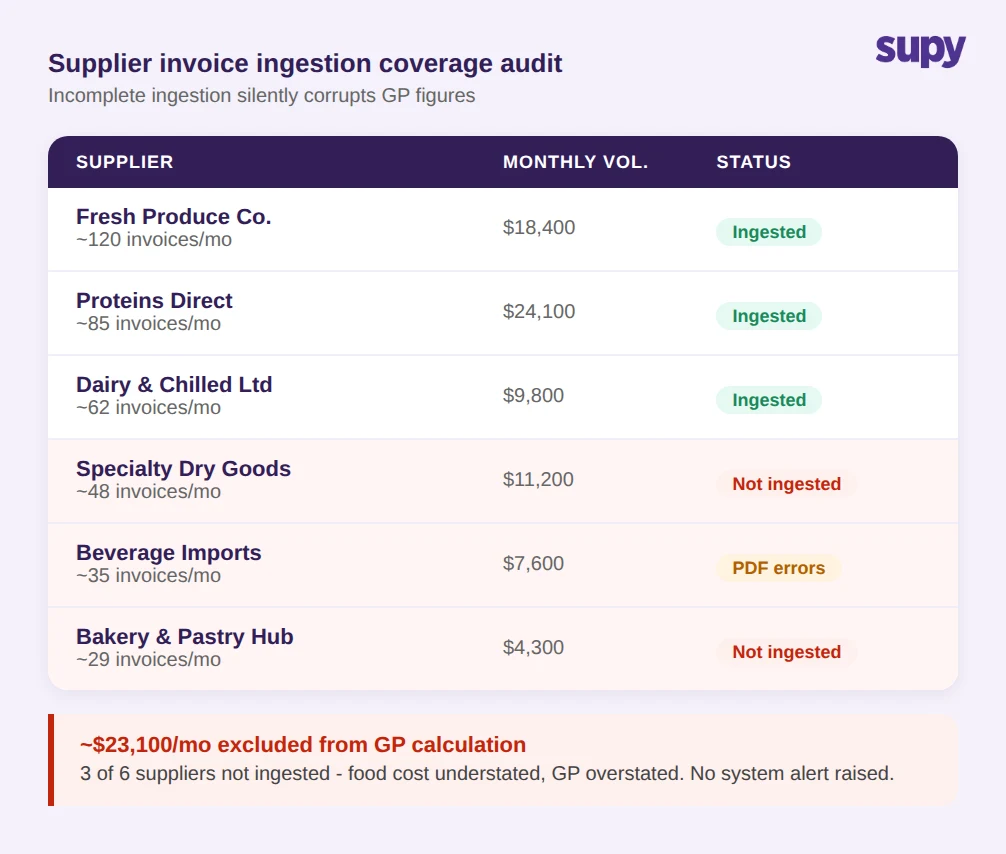
Invoice ingestion is where GP calculation most commonly breaks in practice. A procurement consultant at a multi-location restaurant group found their software was successfully processing around 75% of their suppliers - the remaining around 25% were falling out of the queue due to PDF formatting issues and non-standard invoice structures. Because the system did not flag these failures explicitly, the GP reports continued to look normal. The food cost figures were simply understated by a margin invisible until a manual audit.
The mechanics of this failure matter. When supplier invoices are not ingested, the cost of goods from that supplier does not flow into the recipe costing layer. Recipe costs are therefore understated. Understated recipe costs produce an overstated GP. A restaurant group running at a genuine gross profit margin of around 60% might see its inventory tool reporting closer to 68% or higher, simply because a set of invoices was never processed. That overstatement is large enough to make the difference between a profitable quarter and a loss on paper when management accounts are finalised.
Solving this requires two capabilities that many tools lack: a supplier coverage dashboard showing which vendors are successfully ingested versus not, and proactive alerting when ingestion volume drops below expected levels. Without these, a procurement team has no way to know whether the GP figure on screen reflects reality or a partial view of their cost base. Correcting recipe costing after the fact is time-consuming and does not restore the weeks of decisions made on bad data. For a deeper look at what drives inaccurate inventory costs across the supply chain, see our guide to restaurant inventory software.
POS Integration Gaps Break Your Theoretical-vs-Actual Gross Profit Calculations
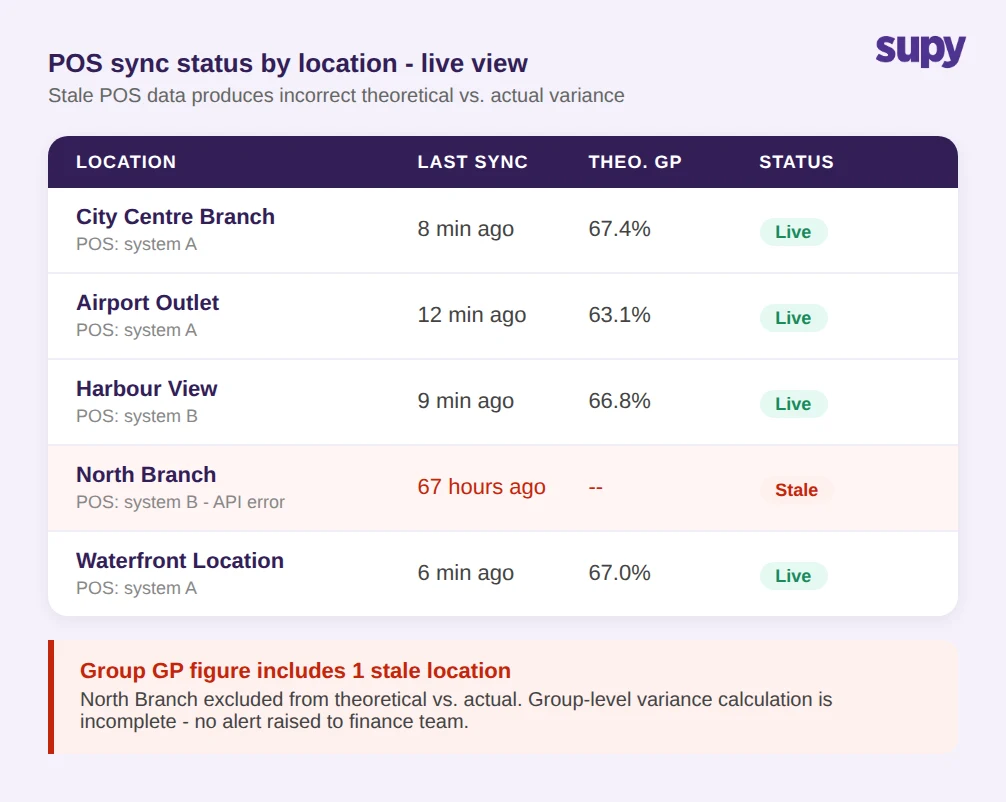
Theoretical gross profit compared against actual GP from sales data is the cleanest measure of where margin is leaking. It surfaces shrinkage, waste, over-portioning, and theft in a single variance figure. But this calculation requires a live, reliable POS connection, and POS integration failures are the most common reason a multi-site group GP reporting becomes unreliable without anyone flagging it.
When a POS sync breaks at one location, the system typically falls back to the last available sales figure or produces no theoretical-vs-actual figure at all for that site. If the GP dashboard aggregates across all locations, a site running on stale sales data pulls down the accuracy of the group-level figure without any visible indication. The dashboard looks populated. The numbers look plausible. Only a manual check against POS exports reveals that one site data is 48 to 72 hours old.
For a group managing 5 locations or more, each with different POS configurations and sync schedules, POS integration reliability has to be a first-class operational concern. A restaurant GP reporting tool that shows the POS sync status for each location alongside the GP figures gives finance teams a trust signal. A tool that presents GP figures without surfacing connectivity status is asking operators to trust numbers they have no way to verify.
What Automated Weekly COGS Reporting Actually Looks Like
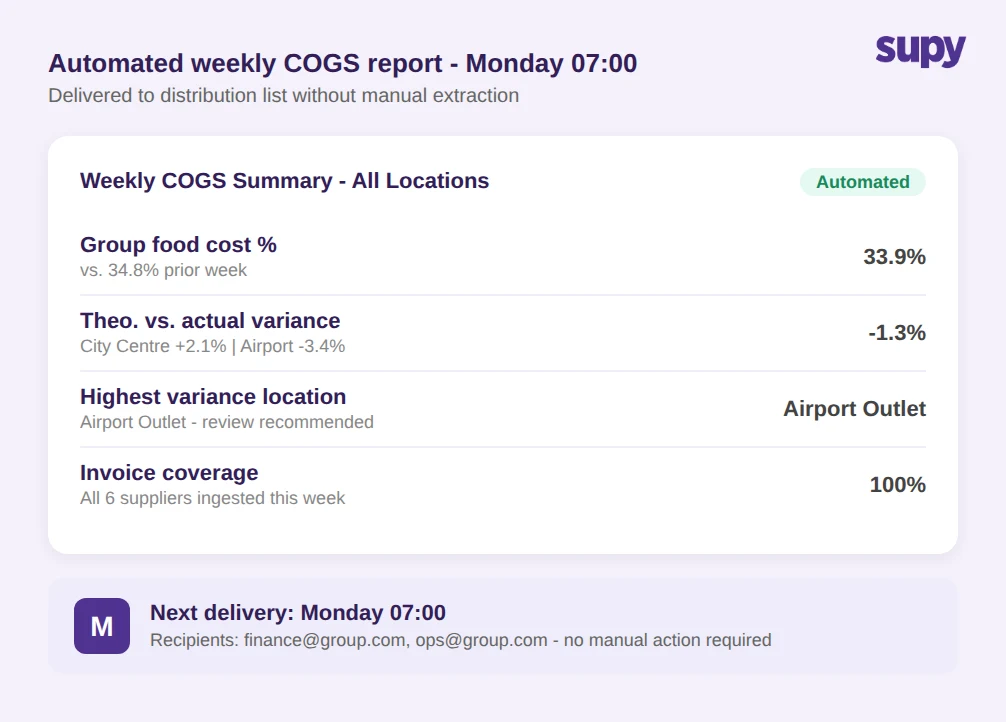
Restaurant groups consistently describe the same requirement: a report delivered Monday morning showing COGS percentage, sales actuals, and theoretical-vs-actual variances by location - without requiring anyone to manually extract, format, and distribute it. The specificity of the request reflects how common the alternative already is: an operations manager spending part of their weekend pulling exports from the inventory system, running calculations in a spreadsheet, and emailing a summary before the week starts.
The manual version of this process introduces compounding problems. Transcription errors between the export and the spreadsheet calculation. Lag that makes the data 48 to 72 hours old by the time it circulates. Inconsistent methodology if different team members assemble the report. And a dependency on one person availability - when the operations manager is on leave, the Monday report does not arrive.
True automation means the report is generated by a scheduled job, delivered to a defined distribution list without human intervention, and covers the metrics the finance team actually needs: COGS by location, theoretical versus actual variance by item category, and a group-wide GP snapshot. Supy Interactive Dashboards surface live COGS and food cost percentage at both group and individual site level, with theoretical-vs-actual variance and waste breakdowns available without vendor involvement. The Spreadsheet Reports feature provides one-click exports across procurement, COGS, menu engineering, and stock movement - with custom enterprise templates for groups that need a fixed report structure on a consistent schedule.
Five Questions That Reveal Whether a Tool Gives You Self-Serviceable GP Reports
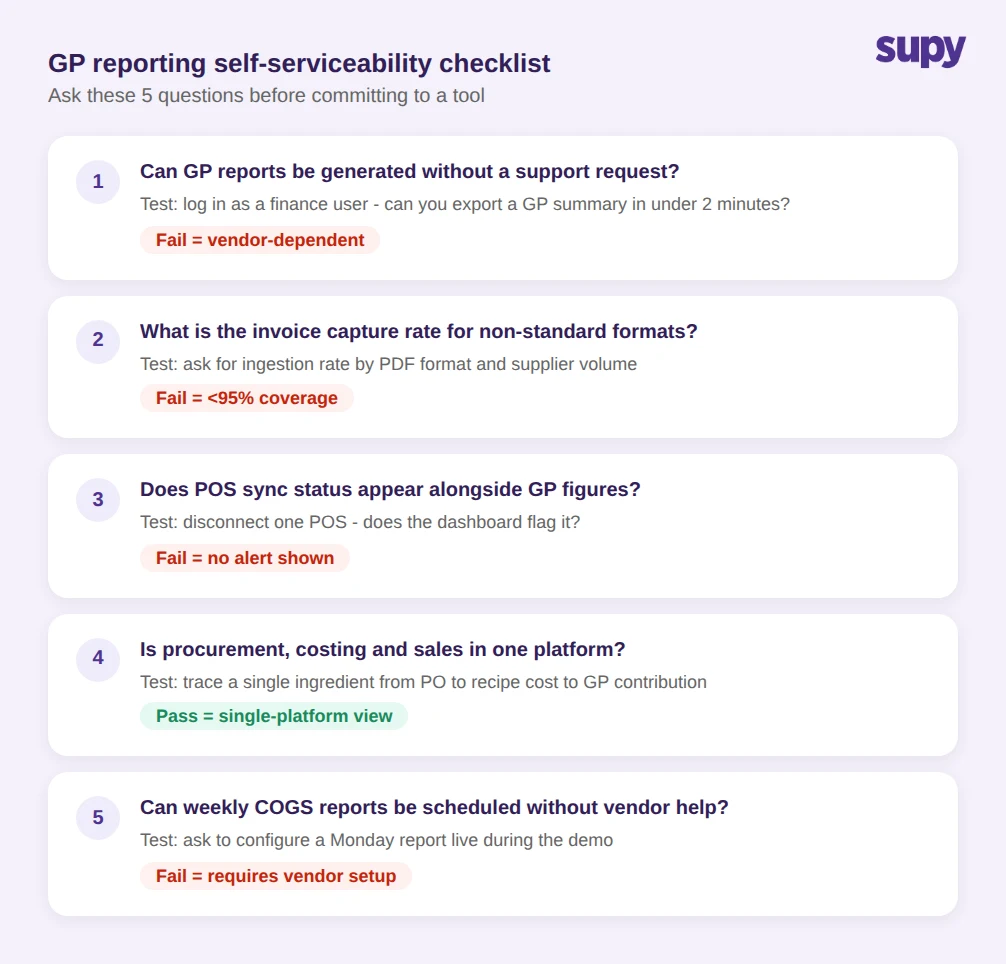
Before committing to a restaurant GP reporting software platform, these questions surface gaps that software demos do not show. Each has a clear pass or fail test that can be run during the evaluation process.
Can a finance team member generate a GP report without a support request? The answer should be yes, with a direct route to the report from the main navigation. If the answer involves a customer success handoff or a custom export assembled by the vendor, the tool is vendor-dependent for its core output.
What percentage of your suppliers will be successfully ingested on launch day? Ask for the vendor invoice capture rate by document format and volume. A tool that cannot process PDFs from around 25% of a typical supplier mix will understate food costs from day one, and the GP figures it produces will be wrong before any operational error has occurred.
How does the system flag when a POS connection is stale or missing? If GP figures can be generated without surfacing POS sync status, the tool will produce confident-looking numbers on incomplete sales data. The flagging needs to be automatic and visible in the same view as the GP metrics - not a separate admin panel that nobody checks.
Does the platform cover procurement, recipe costing, and sales actuals in a single view? Point solutions that handle one part of the chain require manual assembly of the GP figure, which reintroduces the spreadsheet dependency. An integrated platform connecting 75+ POS, accounting, and ERP systems removes the assembly step entirely and gives finance teams a single source of truth for margin data.
What does a scheduled COGS report actually look like? Ask to see the format, delivery cadence, recipient configuration, and setup process. A vendor that needs to configure this on your behalf is not delivering a self-serviceable tool - they are recreating the vendor-dependency problem in a different form.
The self-serviceability test for restaurant GP reporting software is not a premium requirement - it is the baseline. Finance teams that have to request their own data cannot act on it quickly enough to close the variance gap before the next week orders are placed. Getting GP reporting right means ensuring the data chain from invoice ingestion to POS actuals is complete, auditable, and flagged when broken - before a GP figure is generated and trusted, not after it has already informed a bad decision.