.jpg)


Restaurant Inventory Spreadsheet: Free Excel Template and Download Guide

Why restaurants still rely on spreadsheets
Spreadsheets are not a stopgap. For a single-site operator or a small group with consistent menus, a well-maintained Excel or Google Sheets inventory file does exactly what is needed: it creates a record of stock levels, flags when items fall below par, and gives a finance team something to work with at month-end.
The attachment is also practical. Spreadsheets cost nothing to maintain, require no training, and are infinitely customisable. When a head chef wants to add a column for yield notes or a prep area breakdown, they can do it in minutes. That flexibility matters in an industry where every operation runs slightly differently.
What spreadsheets cannot do is update themselves. Every number in every cell depends on someone having counted accurately, entered the figure, and kept units consistent. In a single well-run kitchen, those conditions hold. Across three or more locations - or during a busy trading period when stock counts slip - they often do not.
What a good restaurant inventory spreadsheet includes
The difference between a functional inventory spreadsheet and a filing cabinet is column design. Most template downloads give you Item Name and a quantity box. A spreadsheet that actually supports operations needs eight columns minimum.
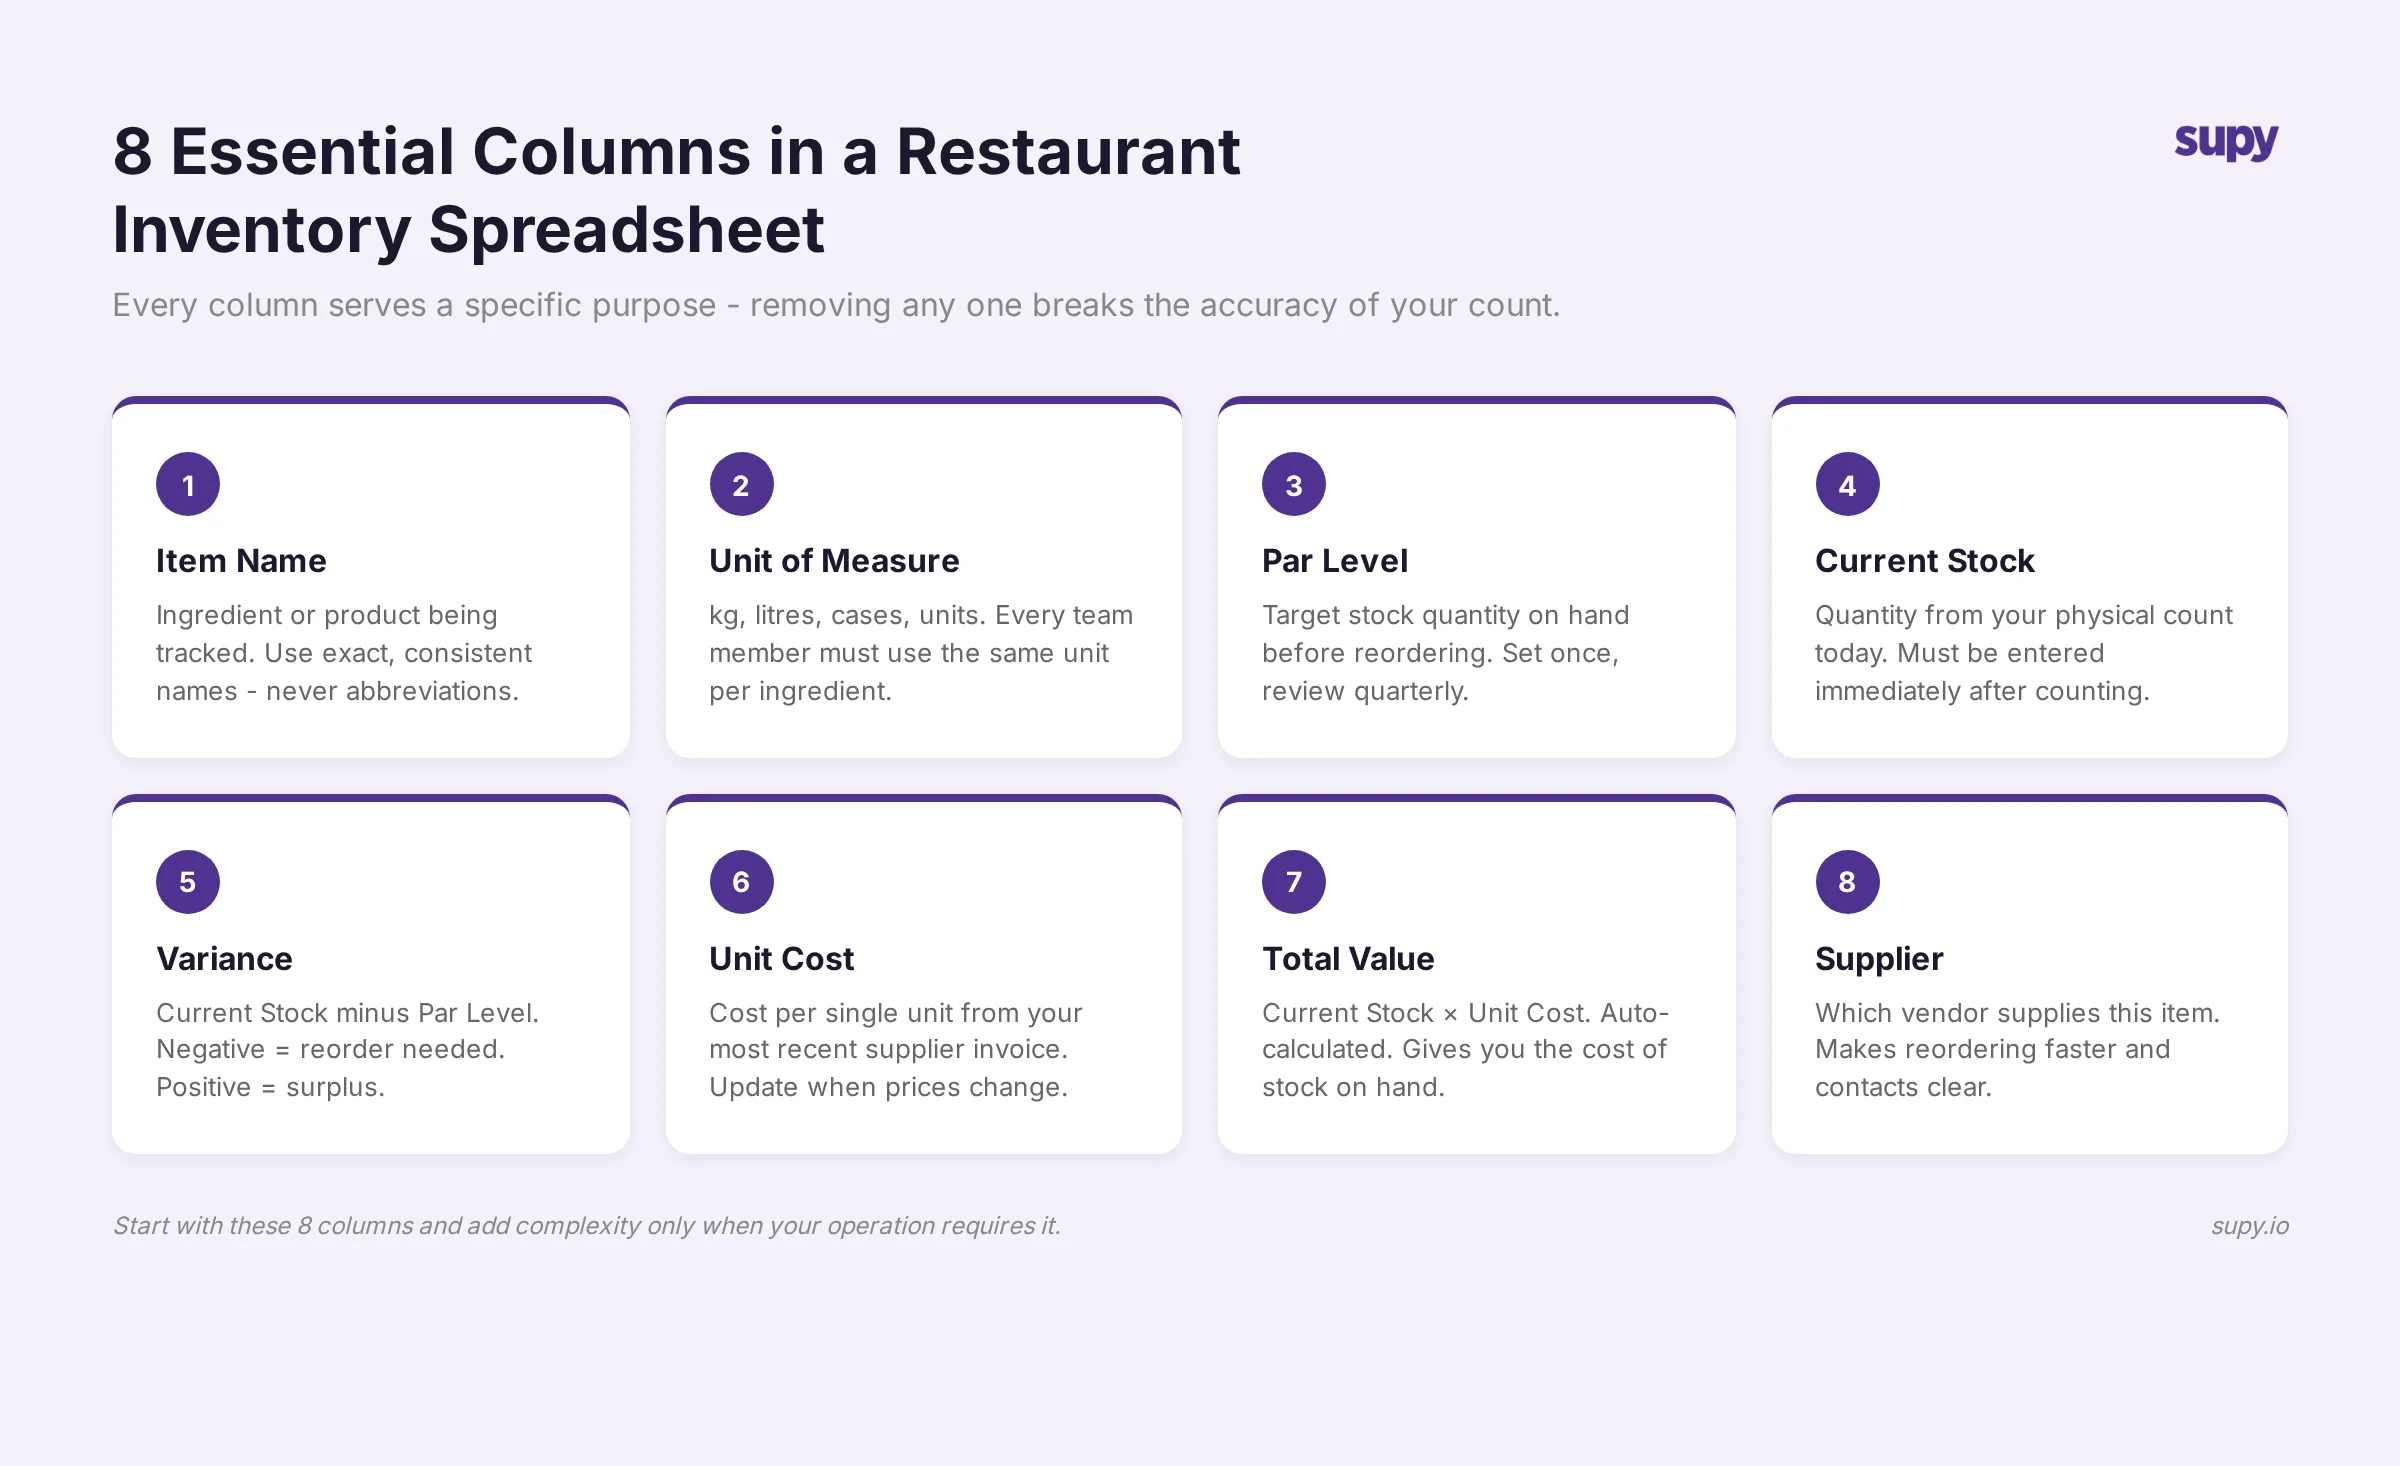
1. Item name
Use a standardised naming convention across every sheet. "Chicken Breast" and "Chicken breast (bulk)" being two separate rows is a common source of duplicate counting. Agree on a naming format before you start and enforce it.
2. Unit of measure
Every item has one unit - kg, litre, unit, case. Never mix units for the same ingredient across different rows. This is the single most common mistake in restaurant spreadsheets and the one that silently corrupts every calculation downstream. More on this below.
3. Par level
The par level is the minimum stock quantity that triggers a purchase order. Without this column, your spreadsheet tells you what you have but not whether it is enough. Par levels should be reviewed monthly and adjusted for seasonality - a summer tourist peak can double usage rates for certain proteins and produce.
In Supy, par levels are set per ingredient per location and trigger automated low-stock alerts when counts are submitted. For how to calculate par levels correctly, the par level calculation guide covers the full methodology.
4. Current stock (count)
The quantity on hand at the time of the count. This should be entered by someone doing the physical count, not estimated. If you are running counts weekly, note the count date in the header row so anyone reviewing the sheet knows when the data is from.
5. Theoretical usage
What should have been consumed based on sales and your recipe costs. This column is what separates an operational spreadsheet from a counting sheet. Without it, you have a number but no context for whether it is correct.
Calculating theoretical usage manually - sales volume multiplied by recipe yield per item - is time-consuming in a spreadsheet. It also becomes unreliable the moment a menu item changes or a supplier delivers a different pack size. For a detailed look at why this matters, restaurant inventory management: the complete guide covers the full inventory management framework.
6. Variance
Current stock minus what theoretical usage would predict. A consistently negative variance (you have less than expected) points to waste, portioning issues, or theft. A consistently positive variance points to measurement error or over-purchasing. Tracking variance over time - not just at a single count point - is where the operational signal lives.
7. Unit cost ($)
The cost per unit of measure at your most recent supplier price. This column turns your inventory sheet into a cost-visibility tool: multiply unit cost by current stock to get total inventory value. Multiply by variance to get the dollar impact of your stock discrepancy.
8. Supplier
Which supplier provides this item. Useful for purchase order reference and for grouping items by supplier when building ordering sheets from your count data.
The unit consistency mistake
This is the detail that invalidates more restaurant spreadsheets than any other.
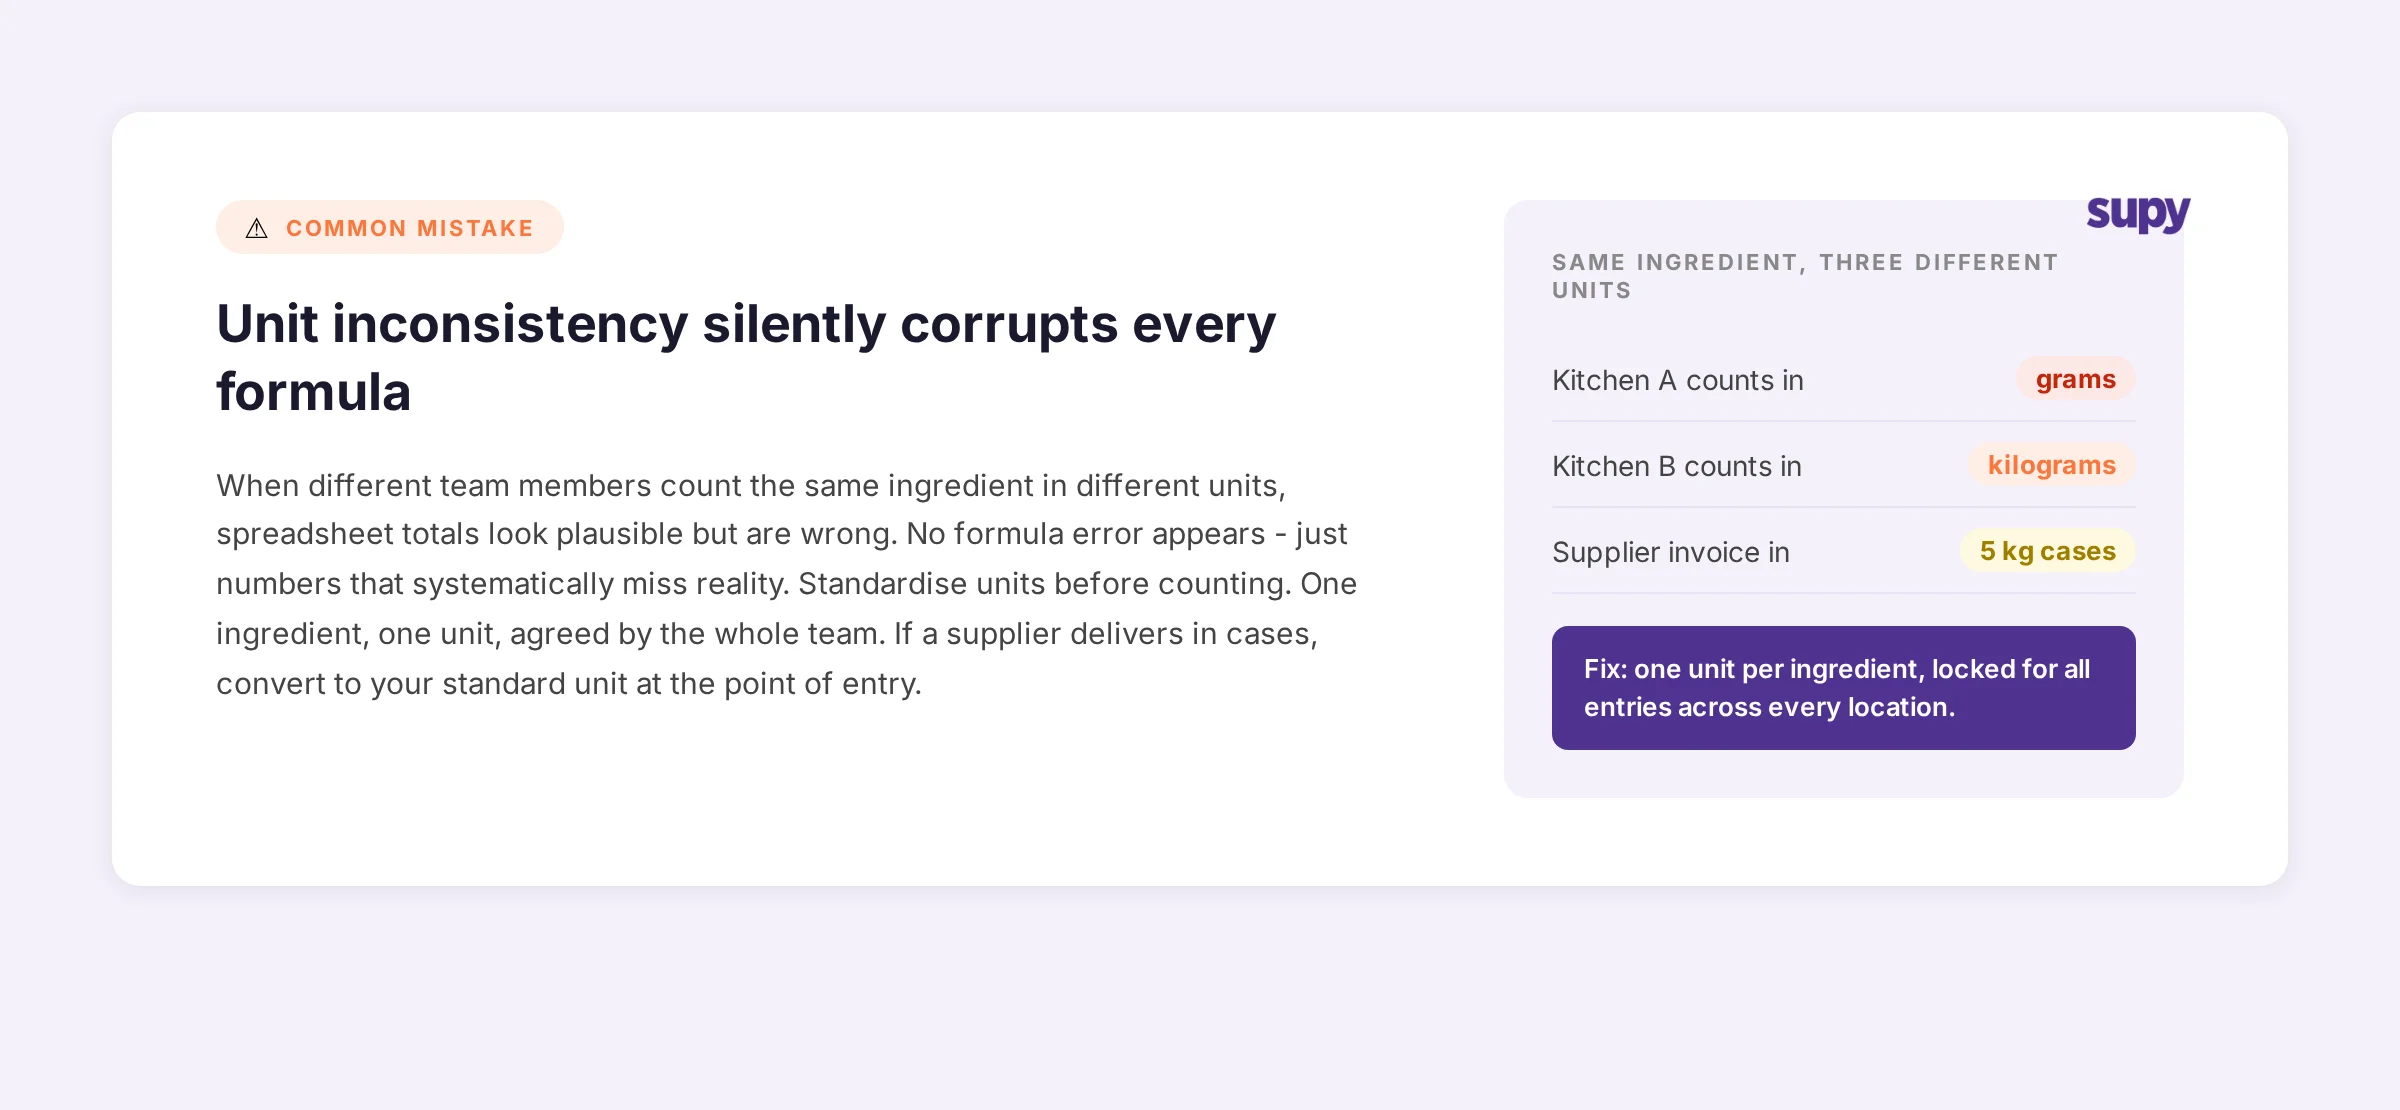
When two people count the same ingredient in different units - one team in grams, another in kilograms, a supplier invoice in cases of 5 kg - the spreadsheet totals look plausible but are wrong. The error does not trigger a formula error. It just quietly produces numbers that slightly miss reality in every direction.
The fix is simple: standardise before you start counting, not after you notice the problem. Every ingredient gets one unit, agreed by the team, written at the top of the column. Recipes, counts, and purchase orders must all use that same unit. If a supplier delivers in cases, convert to your standard unit at the point of entry.
Across multi-site operations, unit mismatches are one of the most reliable early indicators of a spreadsheet that has been maintained by multiple people without a shared convention. The cost is not just formula errors - it is the false confidence that comes from a spreadsheet that balances to a plausible number but is systematically off by a consistent margin.
Spreadsheet versus inventory software: what each handles
A spreadsheet is not failing when it cannot do what inventory software does. These are different tools for different operational contexts.
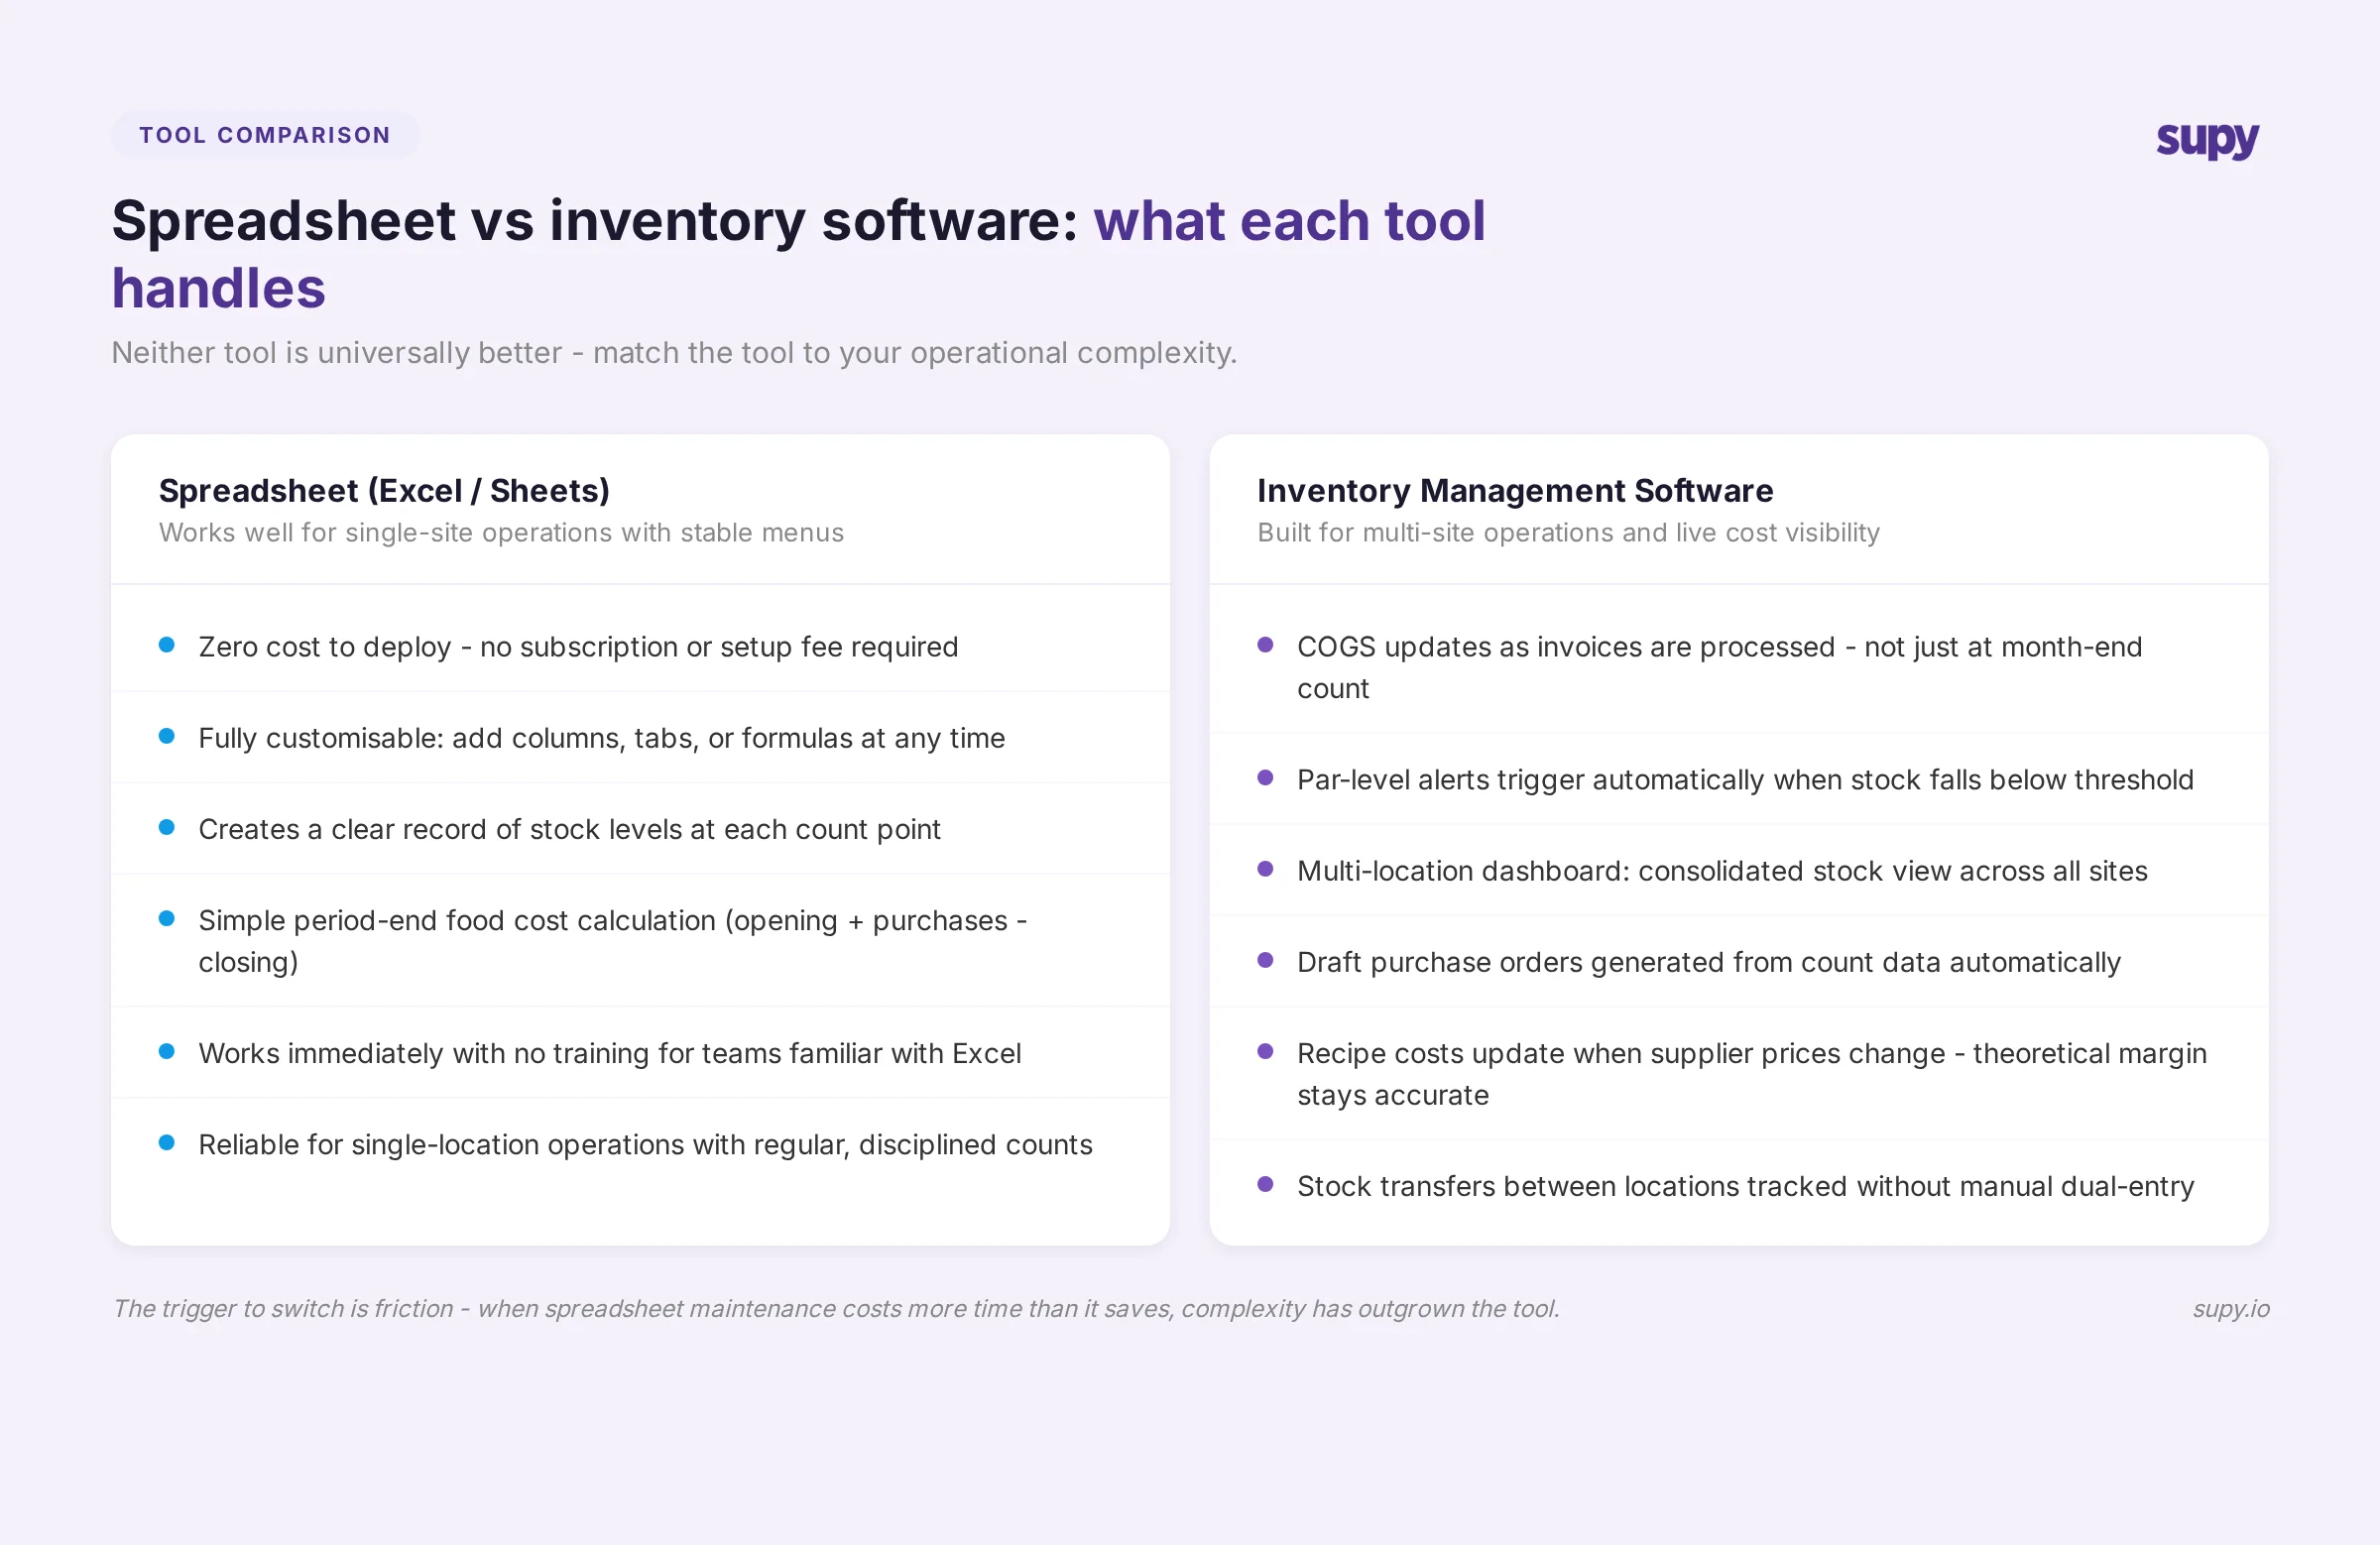
Spreadsheets handle well: single-site operations with stable menus, basic count records and period-end cost calculations, custom column additions, zero-cost deployment.
Inventory software handles: real-time COGS as invoices are processed, multi-location stock visibility, automated par-level alerts and draft purchase orders, supplier price tracking that updates recipe costs automatically.
The specific limits that cause operators to outgrow their spreadsheet are consistent. Operators who describe wanting "a better live view of everything" have typically reached the point where month-end COGS surprises are too frequent - by the time the count reveals the variance, the margin has already moved.
Multi-site operations run into a second constraint: when stock moves between locations, a spreadsheet requires a manual update at both ends. The request for "something that can help us understand and manage stock transfers between multiple stores" comes up reliably when a group reaches three or more sites on a shared menu.
Purchase order generation is the third. A spreadsheet can tell you that stock is below par. It cannot generate a purchase order from that data, send it to your supplier, and reconcile the delivery against what was ordered. That workflow requires a connected system.
By operator size: what works and what breaks
Not every operation needs software. The right tool depends on what complexity you are actually managing.
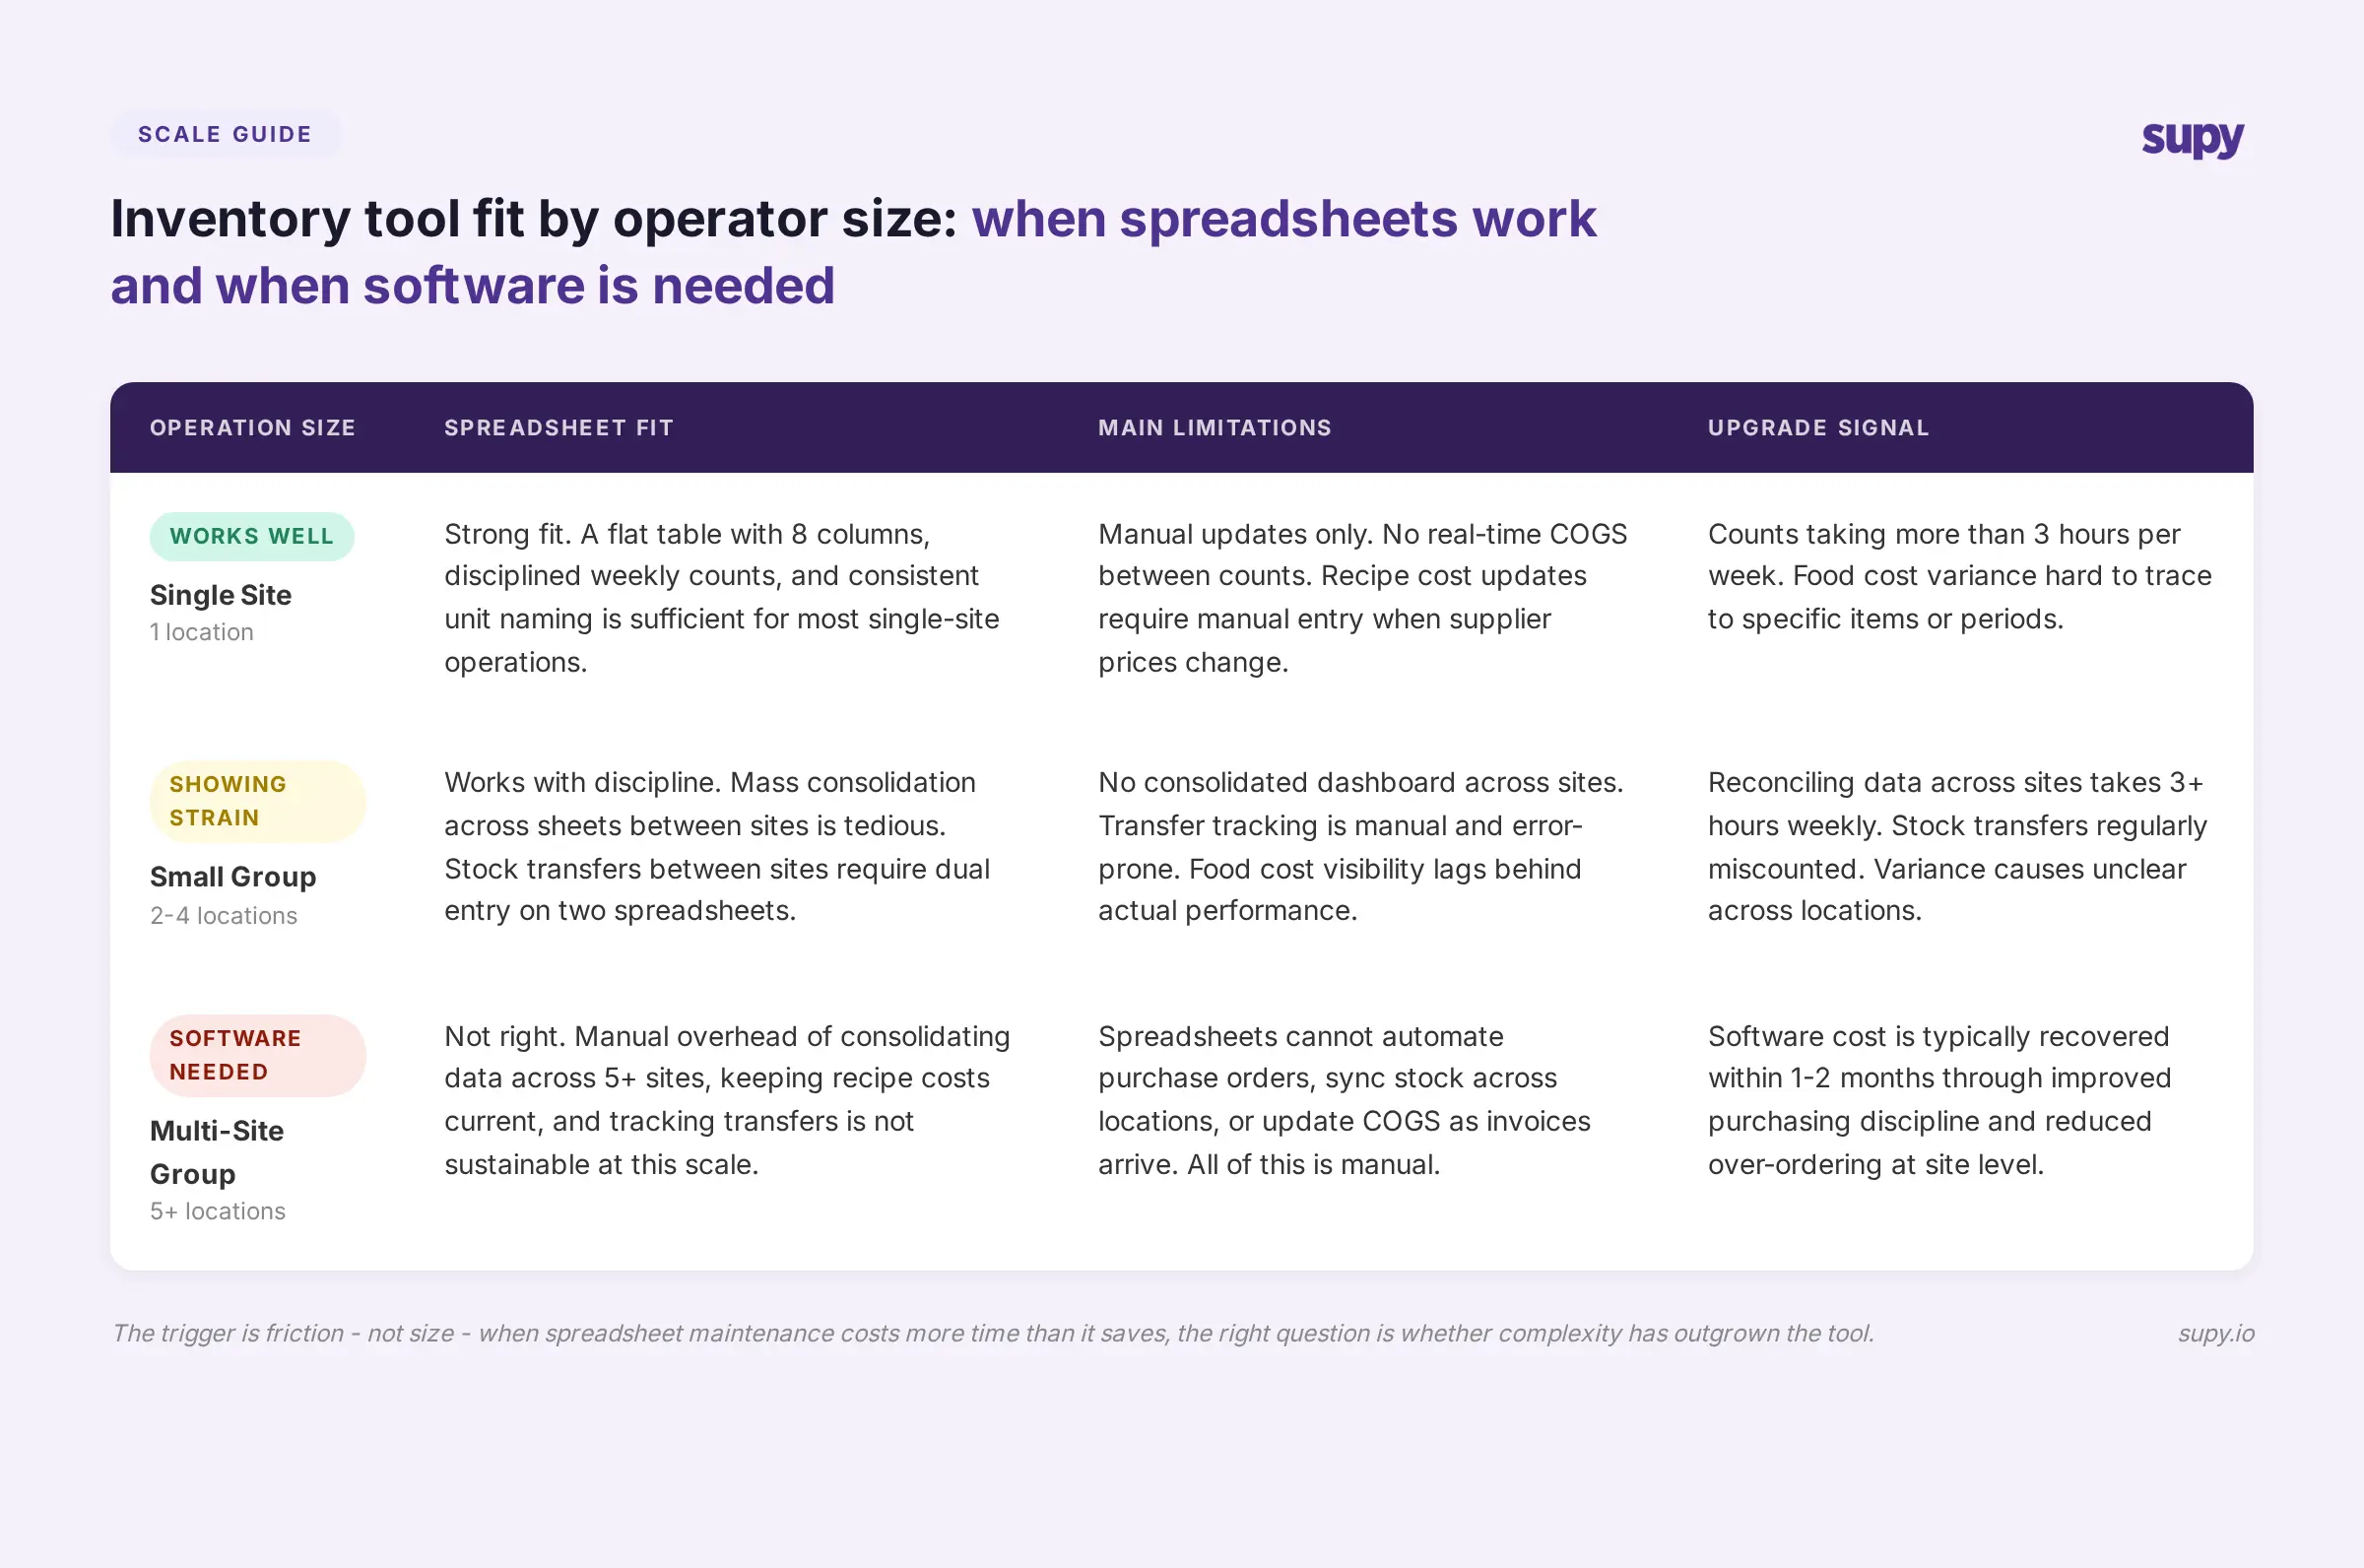
Single site: A well-structured spreadsheet works. Keep it to a flat table, enforce unit consistency, count weekly, and keep the supplier column up to date. The spreadsheet will serve you until menu complexity or count volume makes it burdensome.
2-4 sites: A spreadsheet starts to show its limits. Data consolidation across sheets requires manual work. Stock transfers are hard to track. You can manage with spreadsheets if your operation has a disciplined team, but the risk of an undetected variance grows with each additional site.
5+ sites: Spreadsheets are not the right tool. The manual overhead of consolidating data across five or more locations, keeping recipe costs current, and running variance analysis per site is not sustainable. The cost of software is typically recovered within one or two months through improved purchasing discipline alone.
In Supy, the inventory module connects live purchase data to recipe costs, so COGS updates as invoices are processed rather than at month-end. Stock counts submitted by site feed into a consolidated dashboard across locations. When stock falls below par, the system can trigger a draft purchase order to the relevant supplier - removing the manual step between "count done" and "order placed."
For operators evaluating the transition, best restaurant inventory management software in 2026 covers what to look for and how to assess whether a system's reporting meets the needs of both your operations and finance teams.
Conclusion
A restaurant inventory spreadsheet works well when it is well-structured and consistently maintained. The eight columns above - item name, unit of measure, par level, current stock, theoretical usage, variance, unit cost, and supplier - are the minimum needed to use a spreadsheet as an operational tool rather than a counting record.
The unit consistency rule is the one that determines whether the rest of the spreadsheet is trustworthy.
When the spreadsheet starts creating more work than it saves - reconciling data across locations, chasing down variance causes that the count alone cannot explain, or building purchase orders manually from count outputs - the right question is not how to make the spreadsheet work harder. It is whether the operational complexity has grown past what a spreadsheet is designed to handle.
Download the free restaurant inventory management template to get started, and use the column guide above to adapt it to your operation.
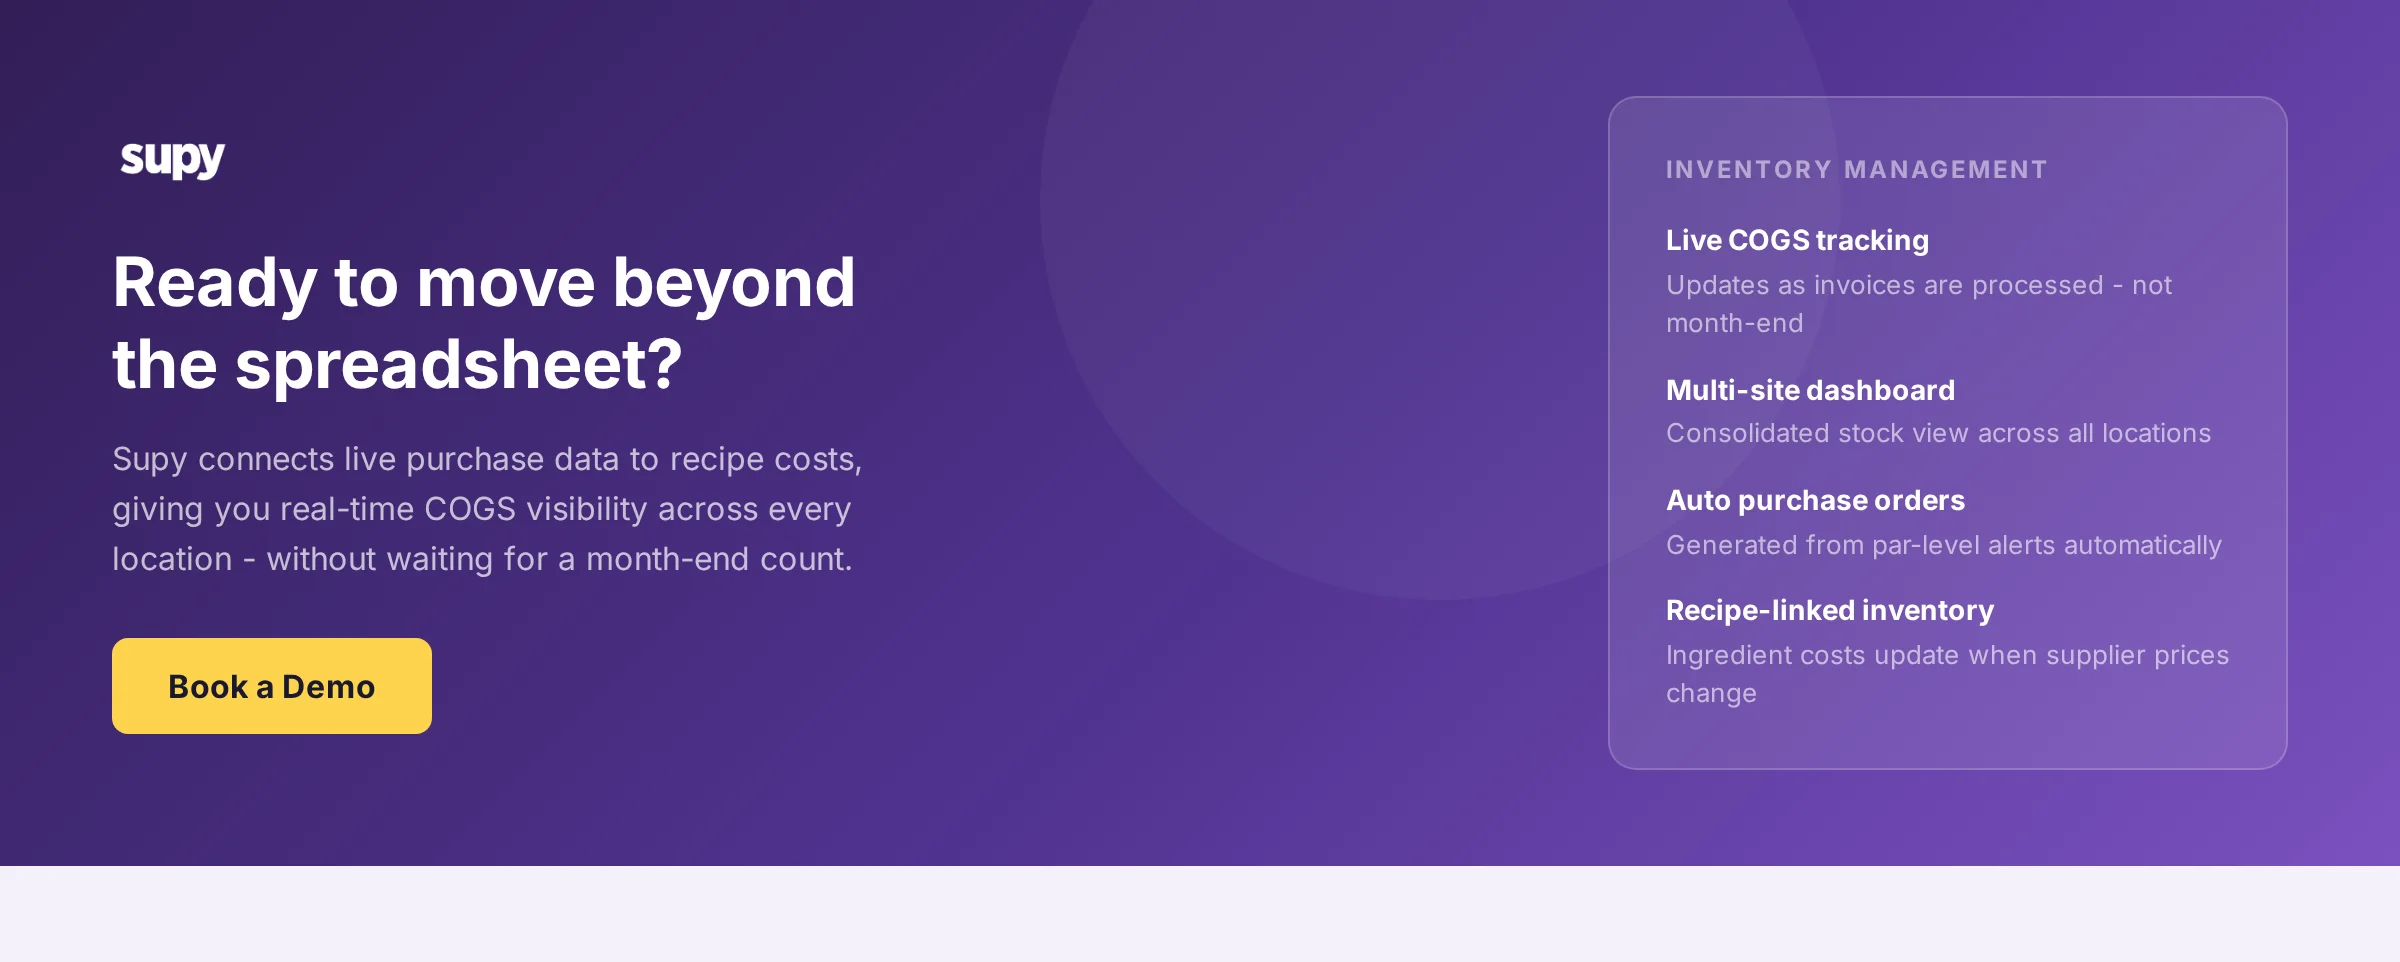
About Supy
Supy provides digital back-of-house solutions designed for multi-unit restaurant operators, covering procurement, inventory management, and business intelligence. The platform connects live purchase data to recipe costs, giving operations and finance teams real-time visibility into food cost without waiting for a monthly count. Supy's inventory module handles stock counts, par-level alerts, automated purchase order drafting, and multi-location consolidation - the workflows that a spreadsheet manages manually. To see how the platform handles your specific operation size and structure, book a demo with Supy.