.jpg)


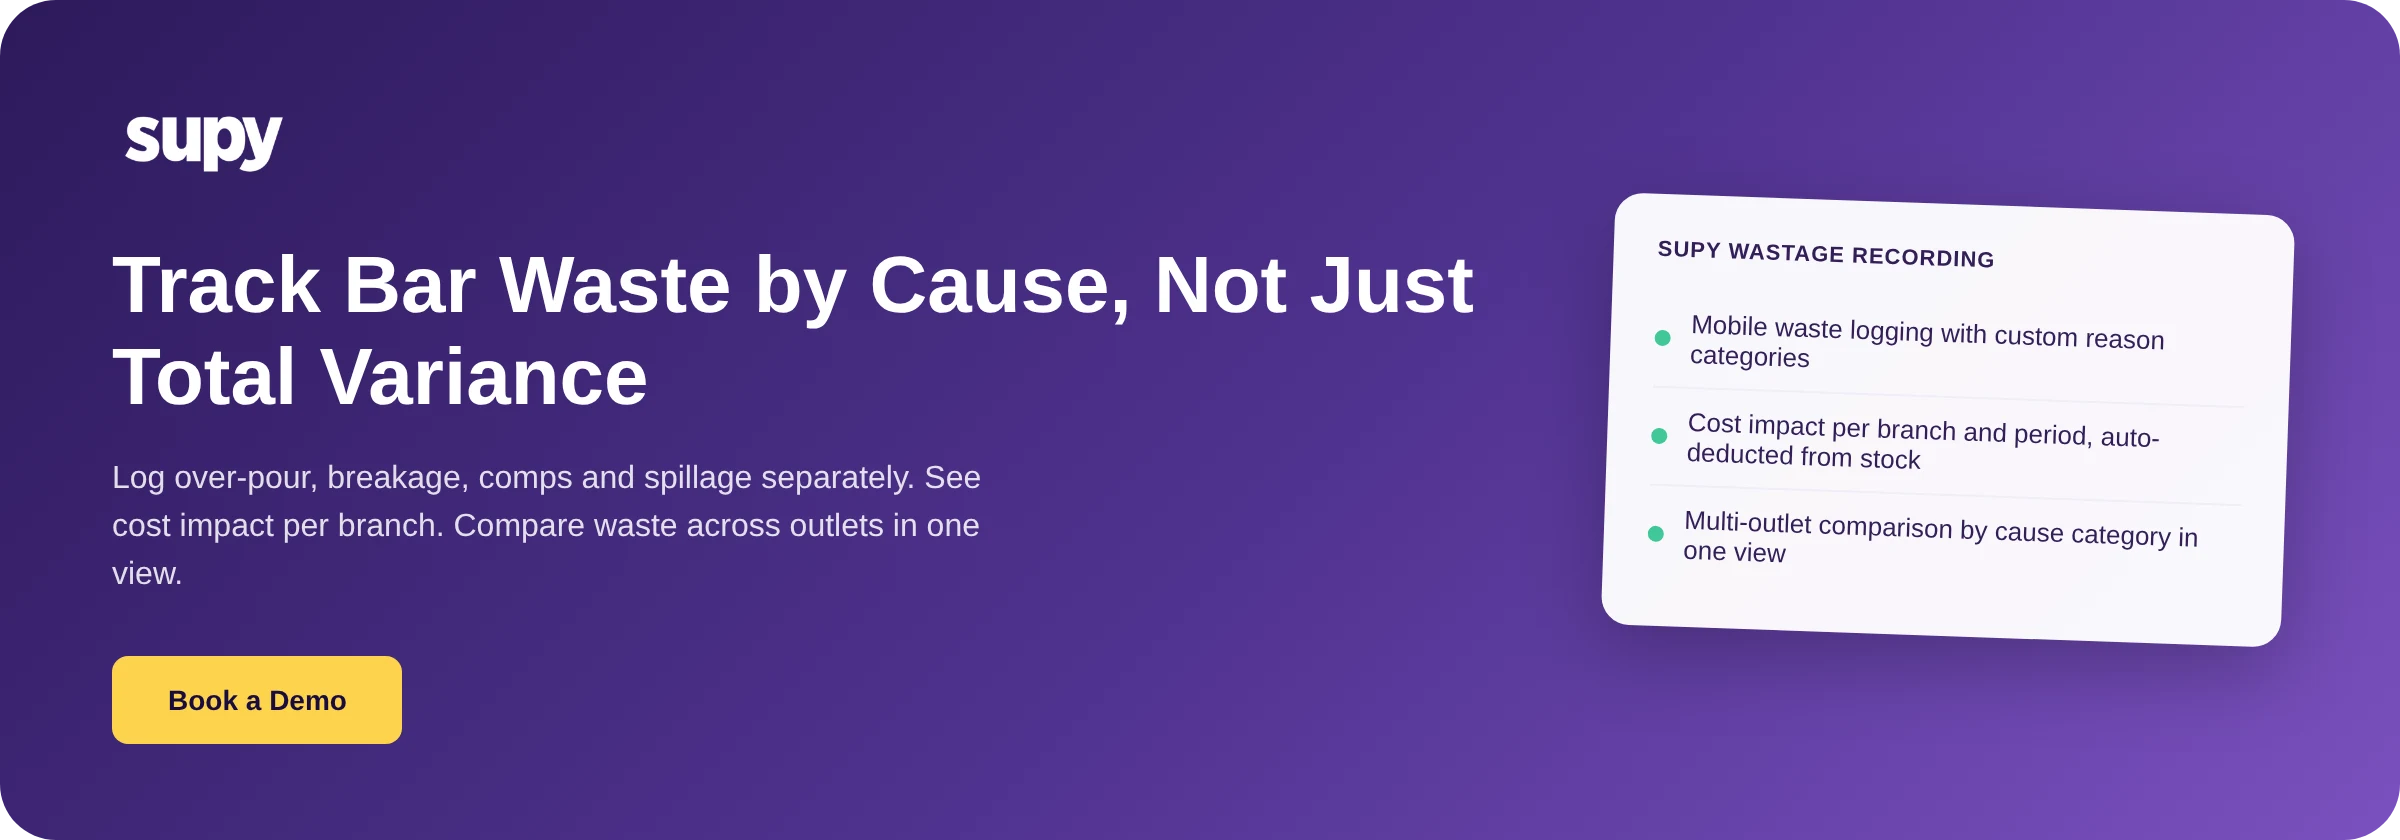
Bar Inventory Waste and Breakage Tracking: Why Variance Reports Fail Bar Operators
Bar Inventory Waste Tracking: Why Your Variance Number Cannot Tell You What to Fix
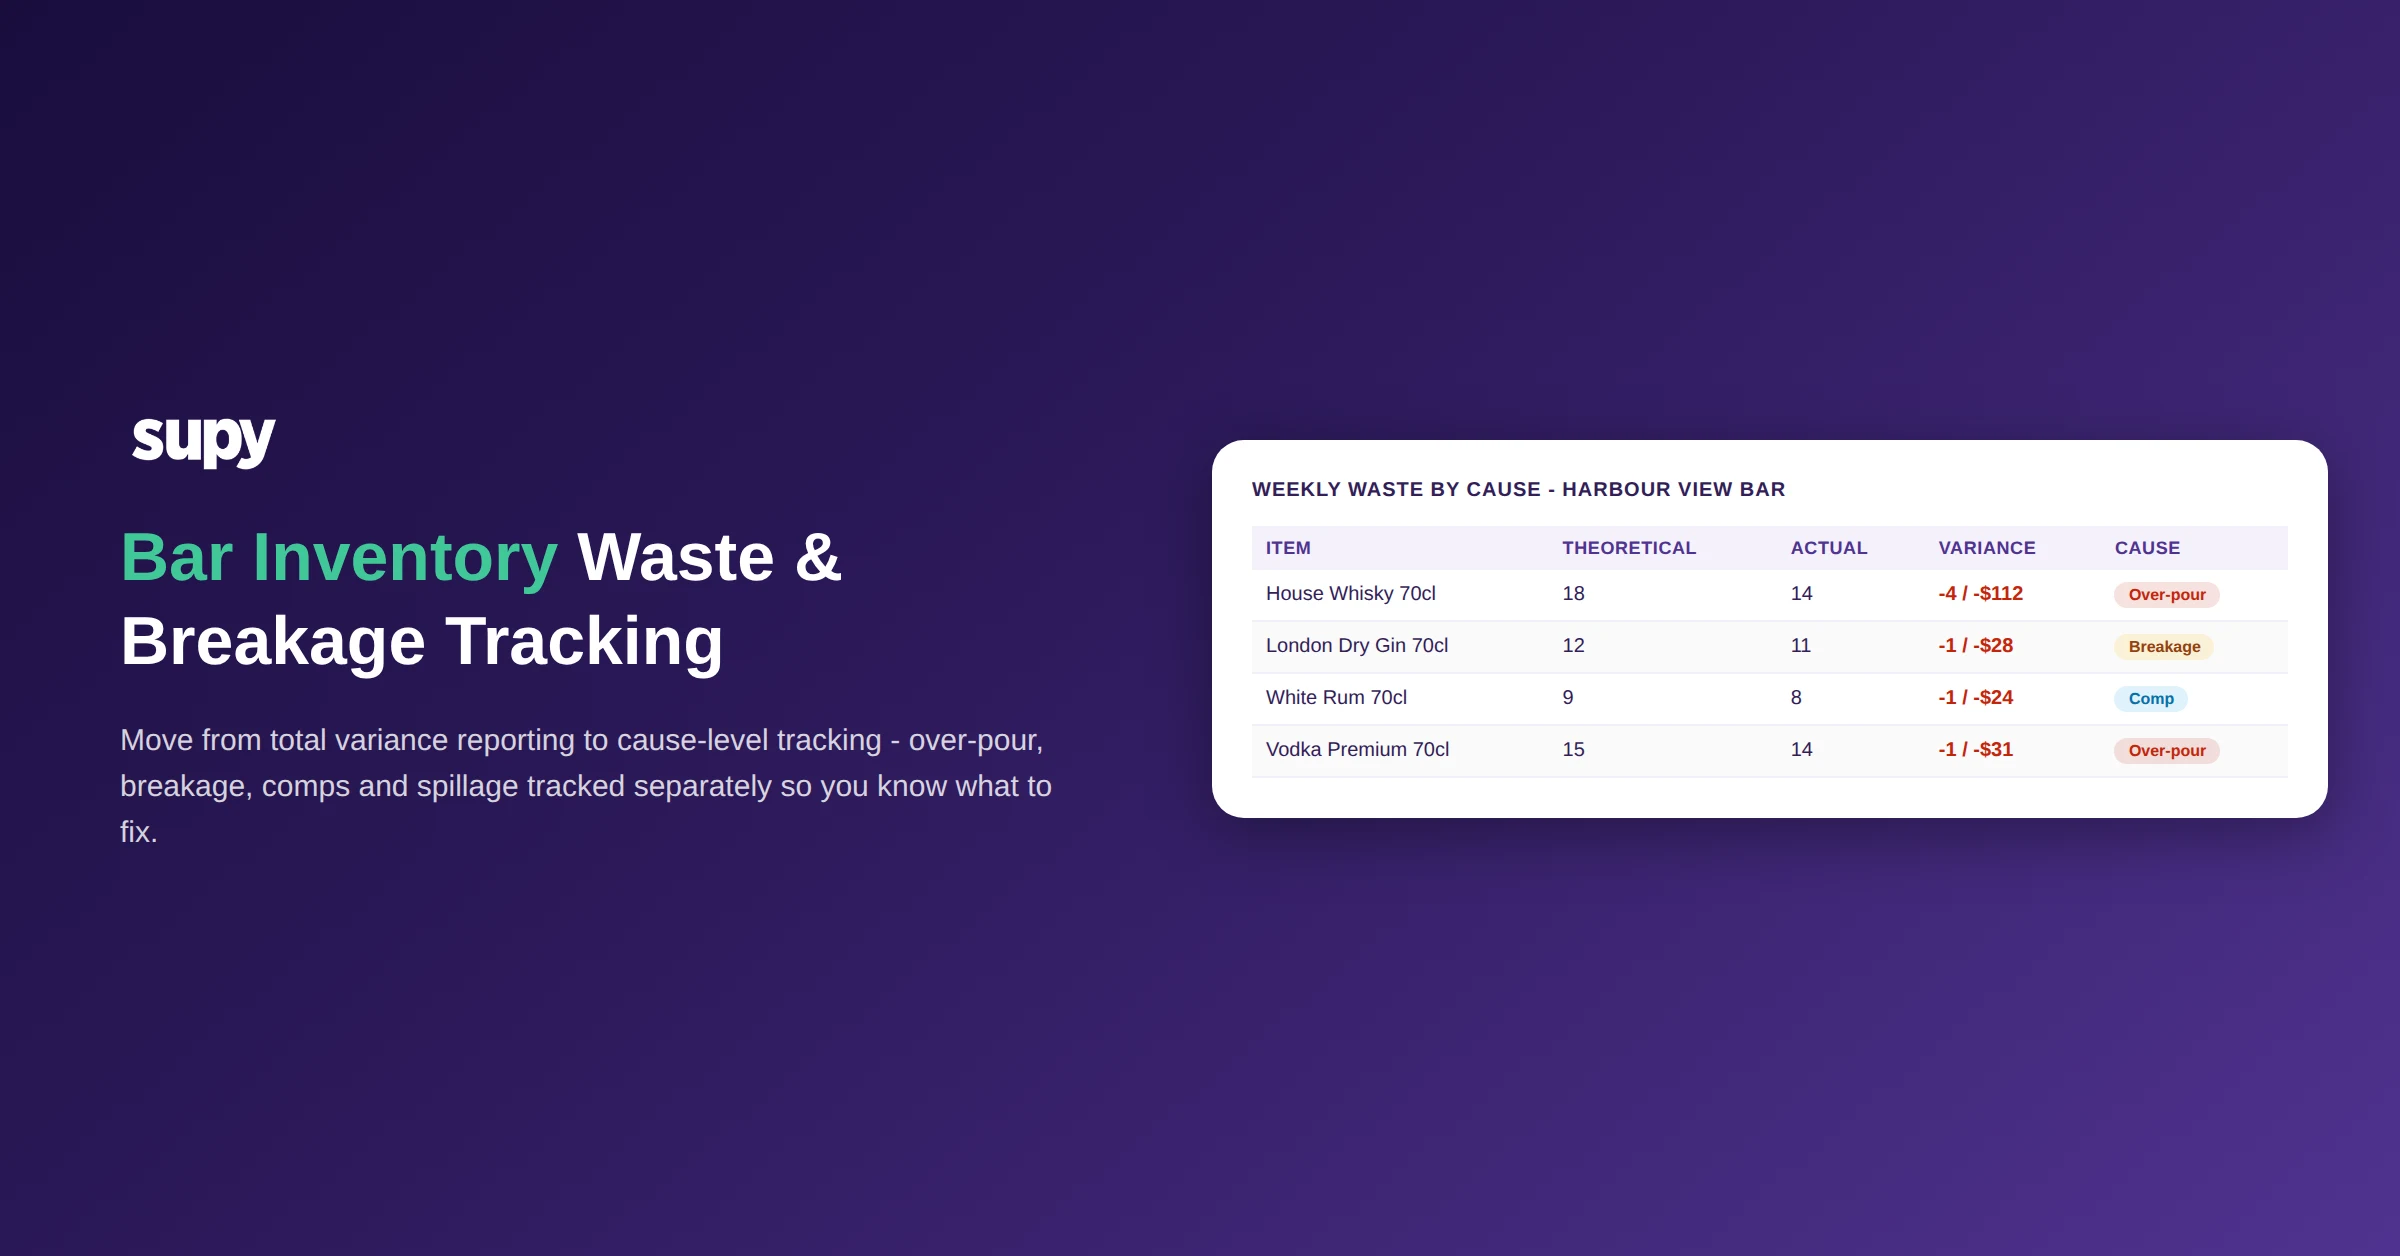
Industry benchmarks indicate bars without dedicated waste and variance controls lose between 15% and 20% of beverage inventory to shrinkage. That range is the starting point for most bar managers when they first see their pour cost. What it cannot tell them is what proportion comes from over-pouring, what comes from breakage, what comes from comps, and what - if anything - looks like misappropriation.
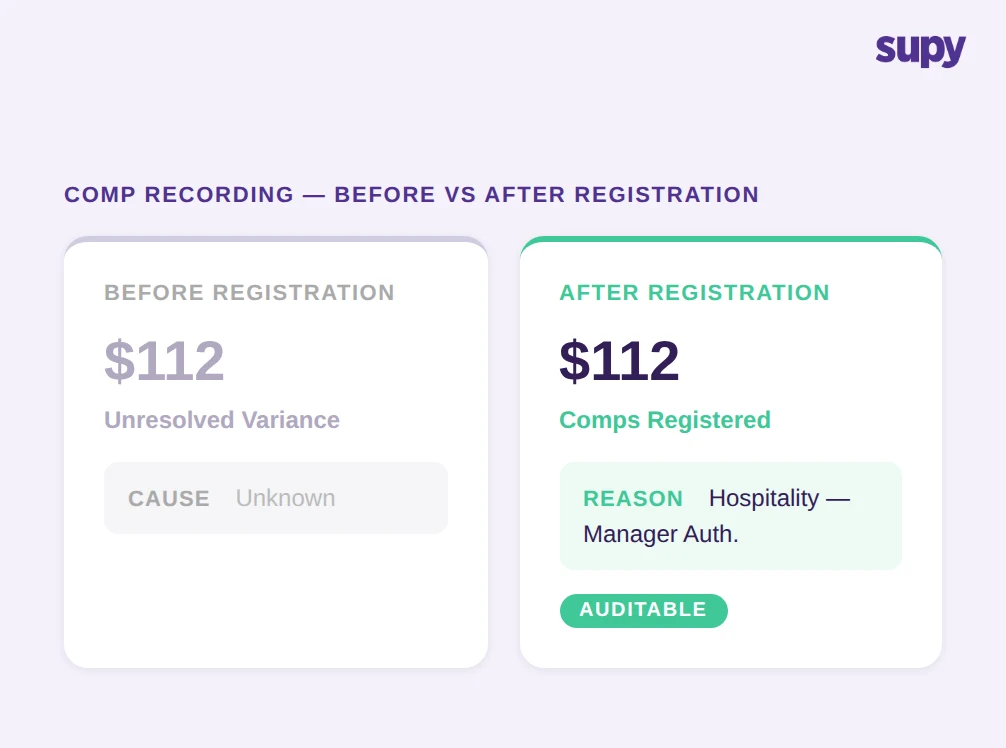
A variance figure produced by basic stock counting gives you theoretical consumption minus actual consumption. If theoretical was 100 bottles and actual stock accounts for 83, there are 17 bottles to explain. A total variance report stops there. The 17 bottles could have been poured consistently at 10% above recipe across 3,000 drinks. They could include 20 broken bottles that were swept up and discarded with no record. They could include $112 in unregistered comps issued across a high-cover Friday. Without separate tracking for each category, every one of those explanations fits the same number.
The corrective actions for each category are completely different. Over-pouring requires jigger enforcement and staff retraining. Breakage requires storage procedure and handling reviews. Comps require a register requirement and policy enforcement. Theft requires investigation. A bar manager who cannot distinguish between causes cannot design a targeted intervention - and a generic "reduce variance" directive will not move any of them.
Over-Pouring: The Invisible Compounding Loss
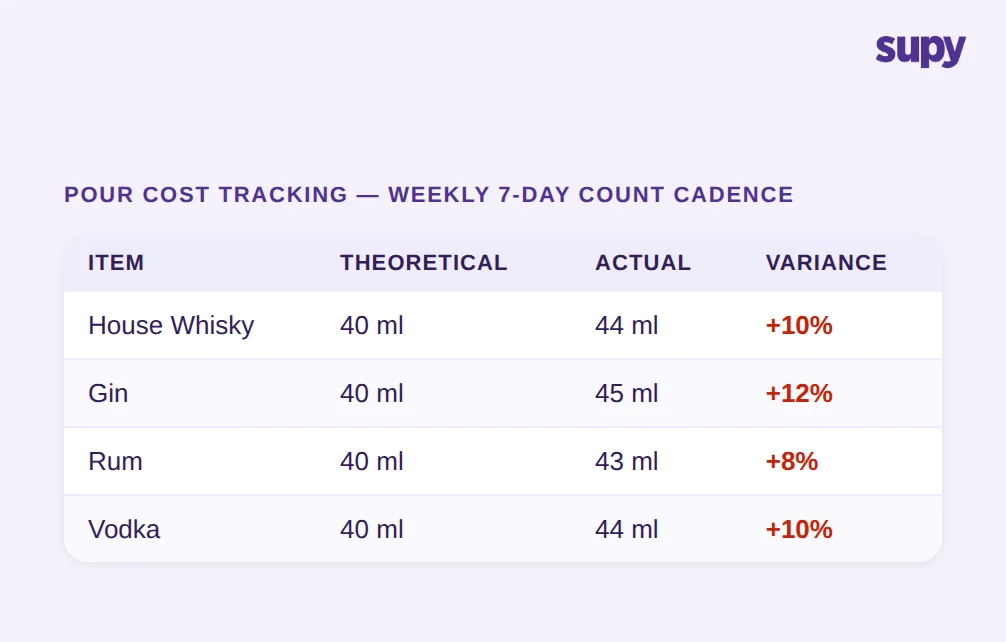
Over-pouring is the highest-volume cause of beverage variance in most bar operations. A consistent 10% over-pour on every spirit measure is imperceptible at the individual drink level. A bartender free-pouring whisky at 44ml instead of 40ml will not register it as an error, and no floor manager watching the service will catch it. Across a 300-cover Saturday night, however, 300 spirits each at 10% above recipe adds up to the equivalent of several full measures lost per session - and that is before you account for cocktail recipes where multiple over-measured spirit components compound the effect.
The only reliable method for detecting over-pouring is weekly physical stock counts compared against POS-calculated theoretical usage. A 7-day corrective action window - where the count reveals a discrepancy and the bar manager can adjust technique before the next count - is what keeps over-pour from compounding. Monthly stocktakes arrive too late: by the end of the month, a bartender free-pouring at 12% above recipe for four weeks has consumed the equivalent of several bottles' worth of margin with no prior visibility.
Pour cost tracking that compares theoretical consumption based on POS sales against actual consumption from physical counts is the mechanism. Without it, over-pouring is invisible. With a weekly cadence, it becomes a 7-day feedback loop that can be acted on before the cost compounds. For good inventory management software context on count workflows, the frequency argument extends well beyond bars.
Breakage: The Cost That Disappears Before It Is Recorded
Broken bottles and glasses in a bar are immediately cleaned up. No one reaches for an inventory system mid-service to record a breakage event. The bottle's theoretical contribution to stock is already counted - it was in the opening stock figure. At the next physical count, it simply will not be there. The result: broken inventory absorbs silently into variance, indistinguishable from over-pouring or theft.
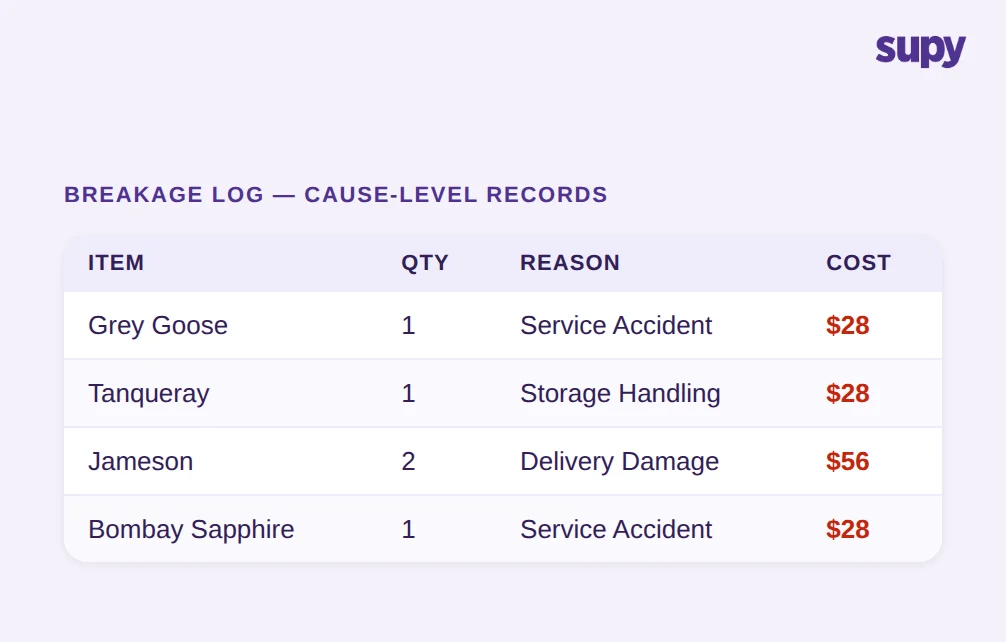
A bar running 50 service covers per shift across five nights a week will accumulate meaningful breakage across a month. At $28 per mid-range spirit bottle, two breakages per week adds up to more than $220 a month in unexplained variance. Over a year, that is a line item large enough to distort pour cost benchmarks and make staff performance comparisons unreliable - but without a separate breakage log, none of that cost can be extracted from the variance total.
Dedicated breakage tracking requires a named log entry at the point of breakage: item, quantity, reason (service accident, storage handling, delivery damage), cost impact. The log does not eliminate the cost - breakage is a real operational expense - but it separates it from the variance categories that require corrective behaviour change. A bar manager reviewing a 15% variance who can identify that 3% of it is recorded breakage can focus their intervention on the remaining 12%.
Comps and Spillage: The Unregistered Costs
Unrecorded complimentary drinks are the least visible category in bar variance because their origin is legitimate hospitality - a manager sending a round to a long-standing guest's table, a bartender topping up a cocktail that spilled during service. The problem is not the comp itself. The problem is that when a comp is issued without registration in the POS or a waste log, the resulting variance is structurally indistinguishable from theft or over-pouring.
When a bartender issues an unregistered comp, the theoretical consumption for that drink is still calculated - the POS recipe model expects that bottle to have been sold. At stocktake, it is absent. The variance report sees a shortfall. The bar manager cannot determine whether the cause was a legitimate hospitality decision or a stock discrepancy that warrants investigation. Variance investigation becomes structurally impossible when comps and spillage are not recorded: the total shortfall number fits too many explanations simultaneously.
Required comp registration converts the comp from an invisible cost into an auditable line item. Over time, a comp log shows whether comp volume is policy-driven or accumulating through staff non-compliance. The same applies to spillage: a spilled cocktail that gets logged tells the bar manager something useful about service conditions; one that goes unrecorded simply makes the variance figure harder to explain.
Count Frequency: The Mechanism That Makes Tracking Actionable
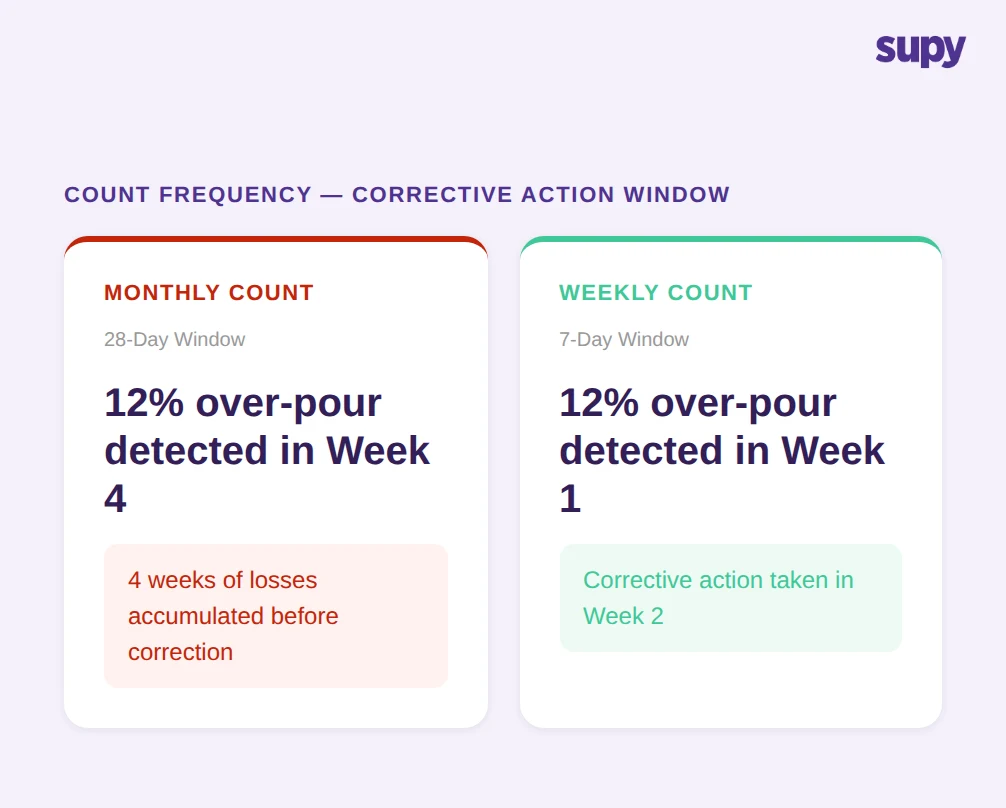
The categories above are only as useful as the count frequency that surfaces them. A comprehensive waste log with four cause categories and a monthly stocktake still has a corrective action window of 28 days. By the time the count reveals that over-pouring has been running at 12% for the past month, the cost is already embedded in the period's results.
Weekly physical counts convert waste tracking from a reporting exercise into an operational control. A 7-day corrective action window means that when a count surfaces a 12% over-pour variance, the bar manager has the following week to enforce jigger use, check recipes, and watch service before the next count confirms whether the behaviour has changed. A bar that switches from monthly to weekly counts and implements cause-level waste tracking will, in most cases, surface systematic over-pouring patterns that had no prior visibility in monthly reporting.
The practical requirement for weekly counts is speed. A count template designed in shelf order, with a mobile interface that allows a single counter to work through the bar storage in sequence, removes the barrier to frequency. The count that takes three people three hours monthly can, with the right count structure, take one person 40 minutes weekly. For operators managing bar management in large chains, count frequency is one of the key levers separating bars that control pour cost from those that report on it after the fact.
Multi-Outlet Waste Benchmarking: Turning Local Data Into Group Intelligence
A single bar's waste log, however detailed, does not tell the group F&B director whether that bar's breakage rate is normal. Without a centralised view that shows waste by category across multiple outlets simultaneously, the head of F&B is reading individual variance reports and making informal comparisons.
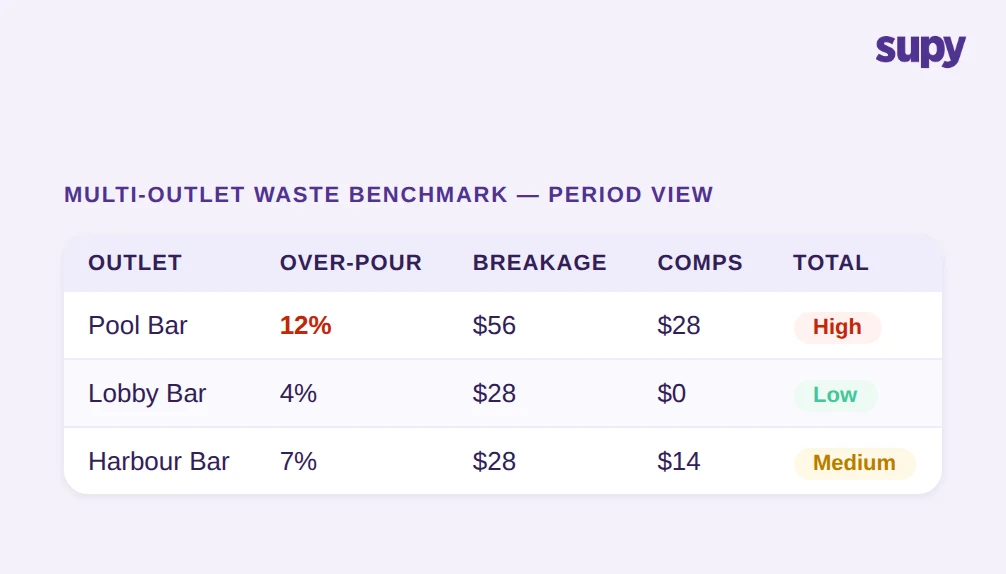
A multi-site hotel group running a lobby bar, a pool bar, and a restaurant bar from the same inventory platform can compare over-pour variance across all three outlets in a single view. If the pool bar shows 12% over-pour variance and the lobby bar shows 4%, the comparison immediately directs management attention. Without a centralised categorised tracking system, that comparison requires someone to manually compile three separate variance reports and subtract the breakage and comp figures from each - work that, in practice, does not get done.
Multi-outlet waste benchmarking by cause category converts local variance figures into group-level operational intelligence. When one outlet's breakage rate is consistently higher than peers, it signals a handling or storage issue specific to that location. When comp variance is elevated at one bar but not others, it may indicate a policy compliance gap at the outlet level. The group F&B director can direct targeted interventions at the outlet level rather than applying group-wide directives that address no specific cause at any specific location.
Supy Wastage Recording: Bar Inventory Breakage Tracking From Variance to Cause-Level Visibility
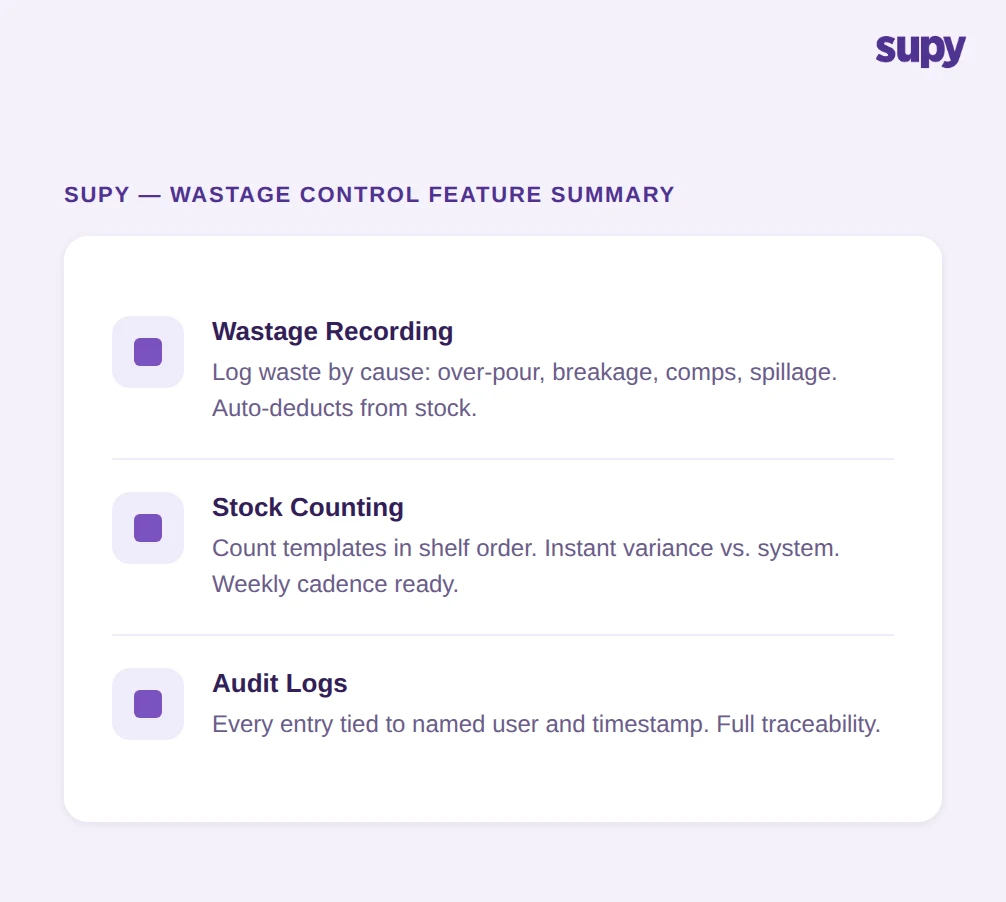
Supy's Wastage Recording module is designed for the workflow described throughout this article. Bar staff log waste on mobile or desktop in seconds - item, quantity, reason category - and the entry auto-deducts from stock and generates a cost-impact record by branch and period. Reason categories are customisable: over-pour, breakage, spillage, comp, unrecorded consumption are each a separate field rather than a single variance bucket.
Across multiple outlets, Supy's multi-site comparison shows waste cost and cause breakdown by branch in a single view - the group F&B director can see which bar has elevated breakage, which has a comp recording gap, and which has an over-pour pattern that weekly counts have failed to correct. Combined with Stock Counting (templates in shelf order, parallel counting with user attribution, instant variance vs. system) and Audit Logs (every action tied to a named user and timestamp), the platform converts a total variance number into an investigatable, cause-attributed record.
Every Supy claim in this article traces to confirmed live product features. Wastage Recording, Stock Counting, and Audit Logs are all live across supported markets.
If your current process ends at the variance number, that is where to start. Cause-level bar inventory waste and breakage tracking is not a reporting upgrade - it is the mechanism that makes corrective action possible.