.jpg)


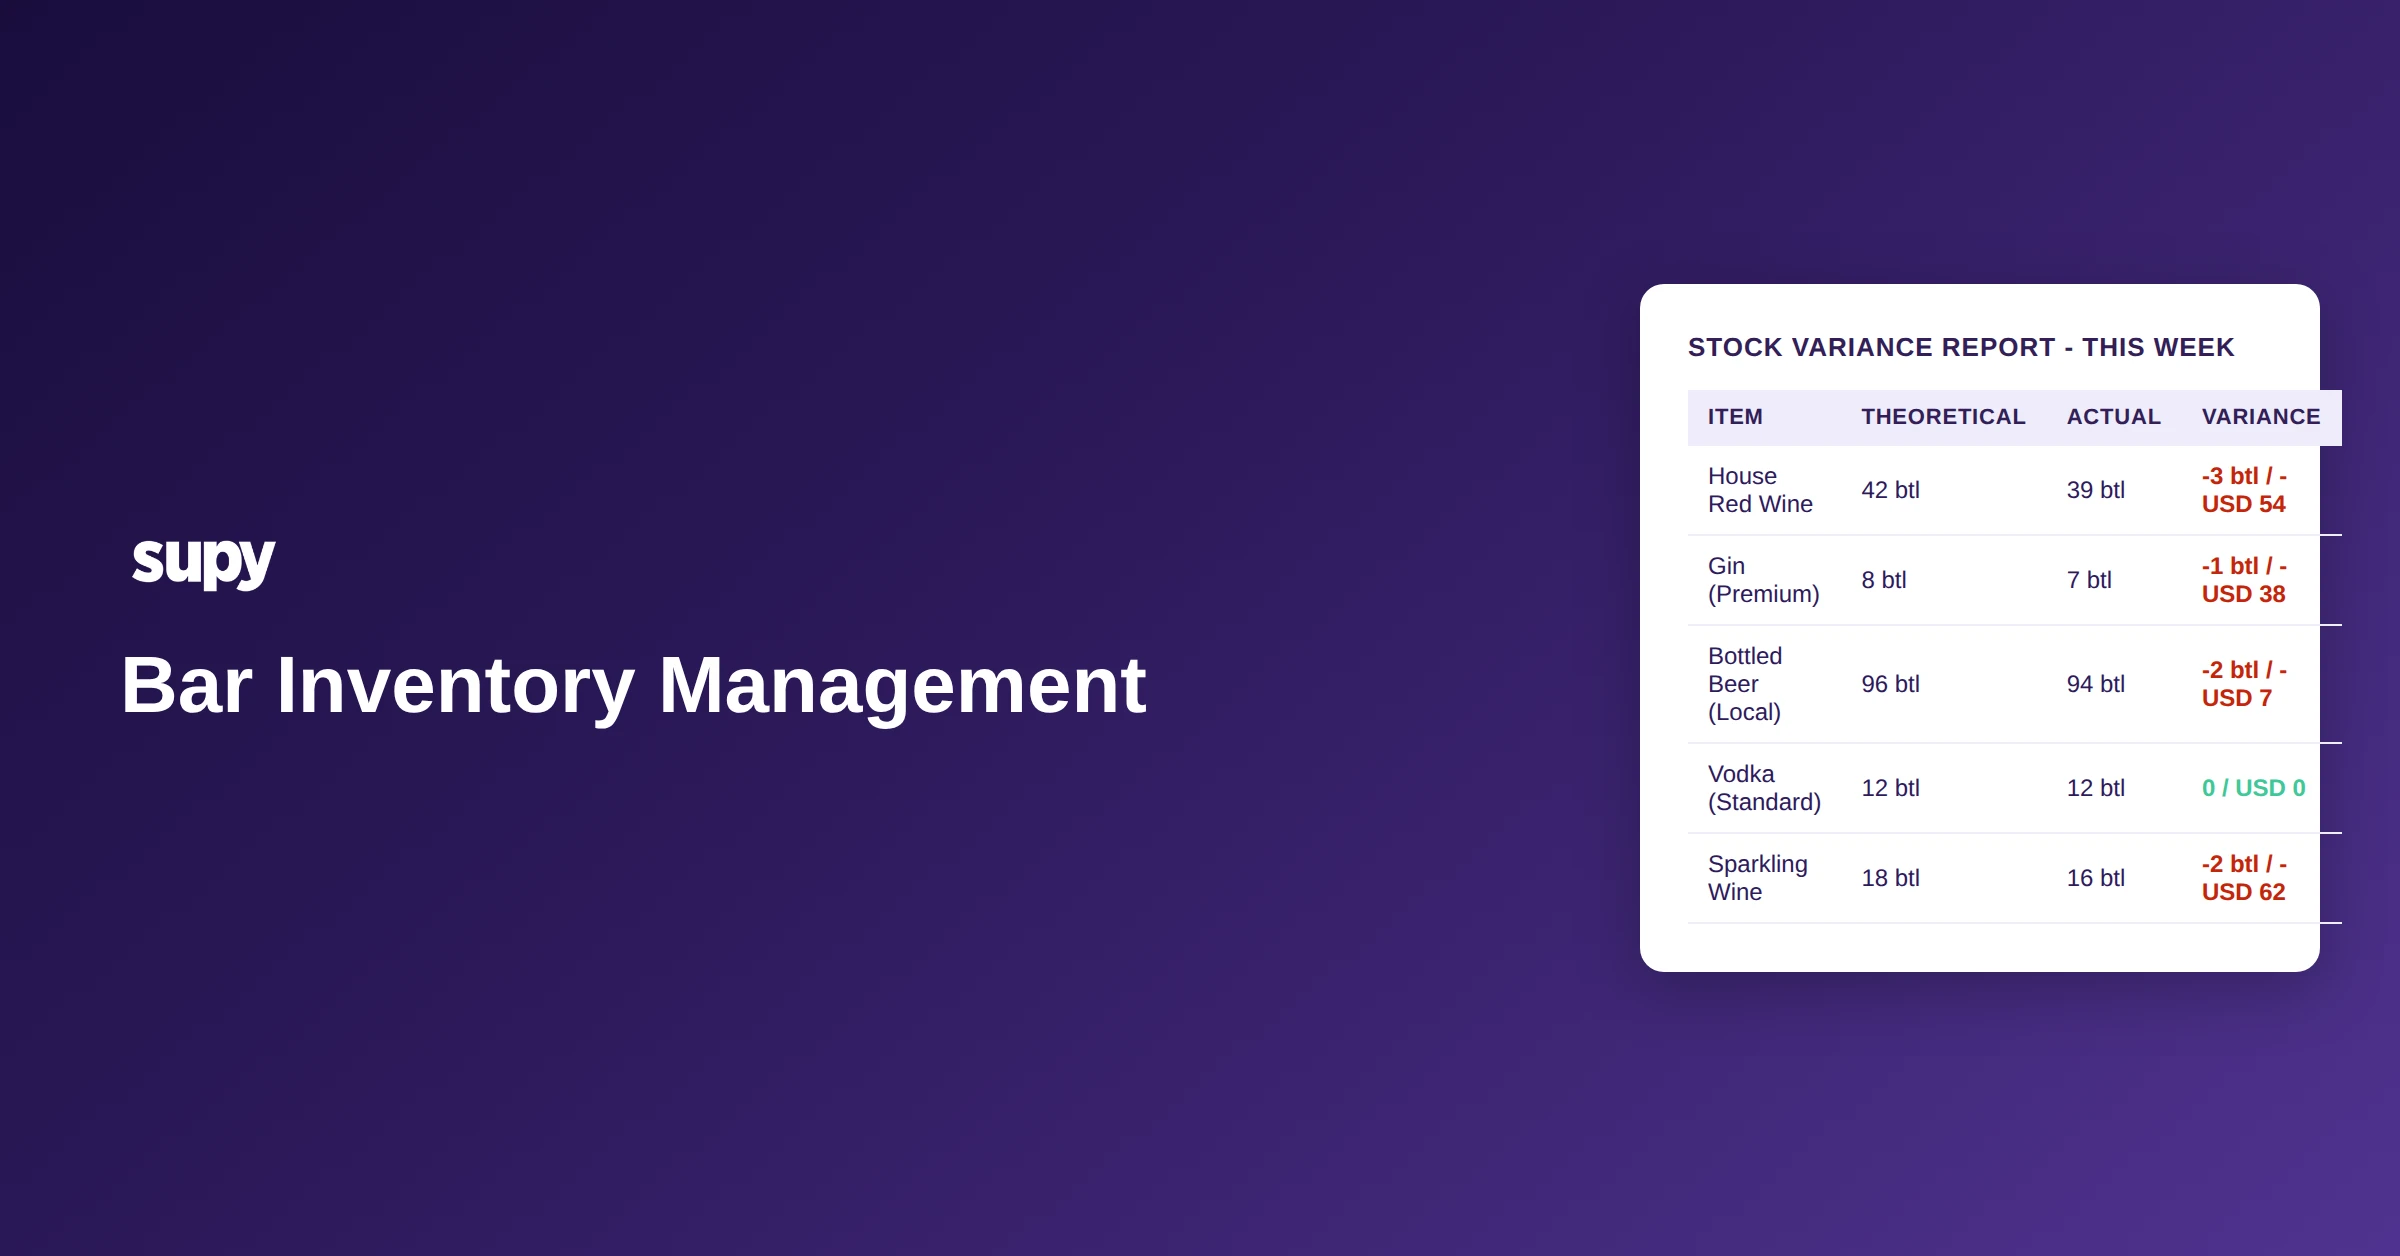
Bar Inventory Management: Why Multi-Location Groups Can't Run It the Same Way as a Single Bar
When Manual Bar Inventory Stops Working Across Locations
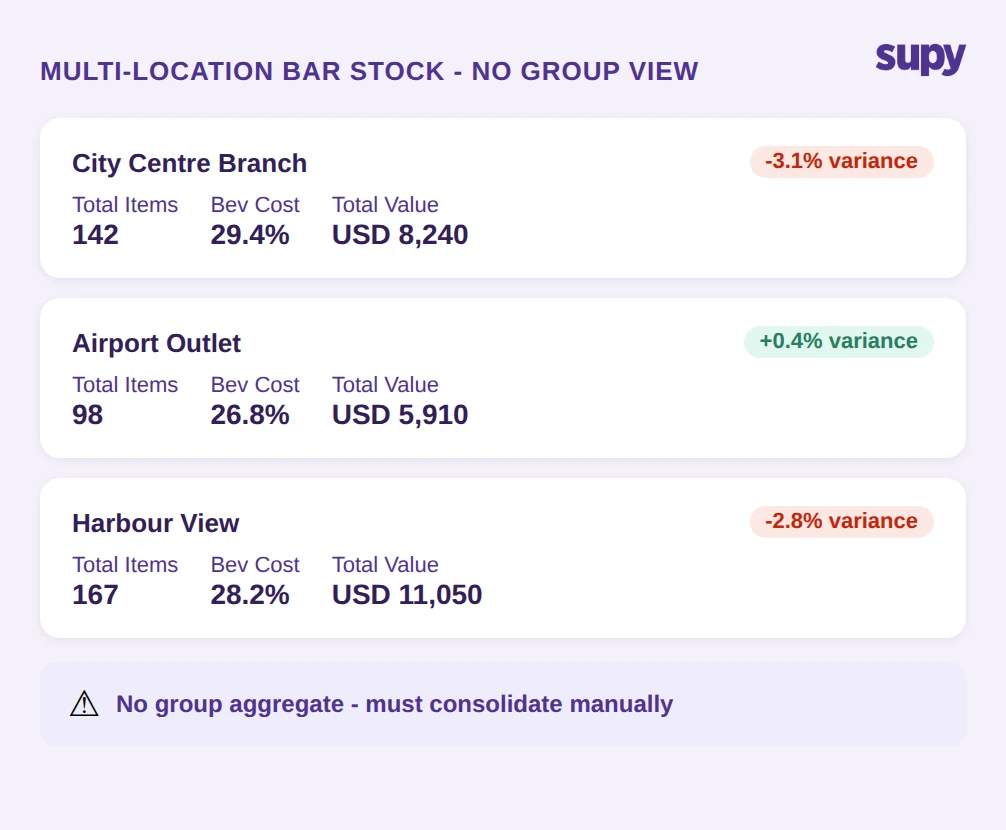
The first thing that breaks in a multi-location operation is the group view. A single bar can run bar inventory management on a spreadsheet with reasonable accuracy. The bar manager knows the stock, knows the par levels, and can spot a discrepancy without needing a system to surface it. That logic does not transfer to a group with 5 locations.
Each site tracks its own stock independently. Each brand may have a different format, a different spreadsheet template, a different counting schedule. When the ops manager or finance director needs a consolidated figure - group-level beverage cost, total variance, which sites are running over par - there is no single source to look at. Someone has to build that view manually, every time.
The operational cost of this is not just the hours spent consolidating. It is the delay. By the time a consolidated variance figure exists, the count data feeding it is already stale. If one location has a 3% unexplained shrinkage rate and another has none, the group view - when it eventually exists - cannot explain why. It can only show that the numbers are off.
This is where connected bar inventory management changes the operating model: a system that holds stock data across all locations in one place means the group view is not a manual assembly job. It exists by default. Before choosing a system, ask: does your current bar inventory system produce a consolidated view across all sites without manual consolidation?
The "People Problem" Objection and What It Misses
One objection that appears often in multi-location operations is the argument that inventory problems are a people problem, not a system problem. The logic runs: if staff are doing the counts correctly, the numbers will be right. If there are variances, it is because someone on the floor is not doing their job. The system is fine; management needs to tighten up.
This objection is understandable. When a director of operations is looking at a negative variance across several sites, blaming in-store management feels more actionable than questioning whether the tooling is adequate. But the objection has a structural flaw.
Manual bar inventory management creates conditions in which people problems are invisible. If a count is entered incorrectly in a spreadsheet, there is no check against what the theoretical usage should have been. If a par order is placed that duplicates stock already in transit, no alert fires - because the system does not know about the transit stock. If wastage at one site is recorded inconsistently compared to another, the variance figures are not comparable across locations even if every individual did their job.
The system does not cause all of these problems. But it fails to prevent any of them. A connected bar inventory system does not remove human error. It surfaces it, attributes it, and creates a correction path. Ask: if a staff member enters an incorrect stock count today, how would you find out, and how long would it take?
Undifferentiated Variance - Why Seeing a Negative Number Is Not Enough
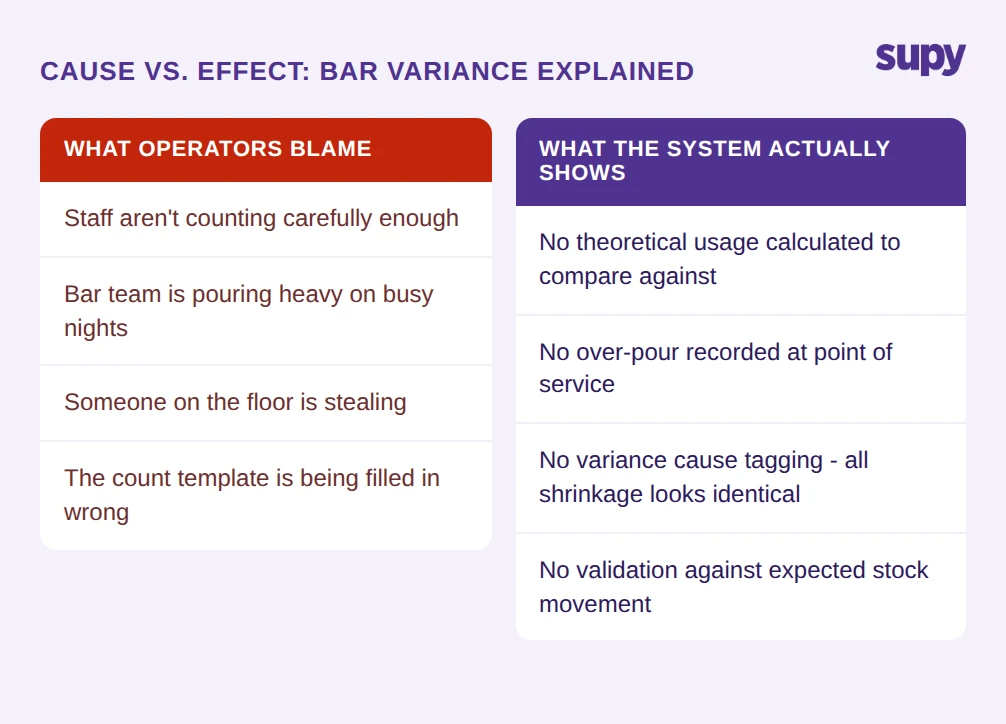
The most common variance report in manual bar inventory management shows one column: the difference between what should have been there and what was counted. A negative figure means stock is missing. That is the end of the information.
For a group running beverage cost at 28% of revenue across 5 locations, undifferentiated negative variance is not useful. It confirms a problem exists. It does not tell you whether the house wine is going out in staff drinks, whether the bottled beer shrinkage is from breakage on delivery, or whether the spirits variance is the result of free pours on busy service.
The operational consequence is that every location looks the same in the report - a number, positive or negative - regardless of the different root causes that produced it. A 3% variance at one site that is entirely attributable to documented wastage is a different situation from a 3% variance at another site with no documented cause. Manual bar inventory management treats them identically.
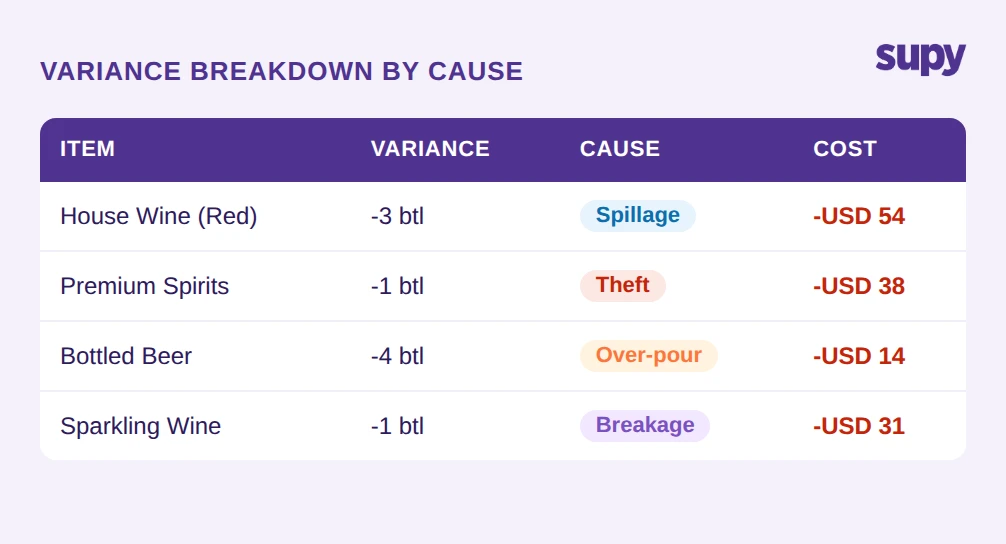
Cause-level variance tracking changes this. When bar staff record wastage at the point of occurrence - logging the item, the quantity, the reason, whether it is spillage, over-pour, breakage, or theft - the variance figure at period end has a breakdown attached to it. The unexplained portion is smaller, and it is more clearly the thing that requires investigation, rather than a large undifferentiated number that could mean anything. For more detail on how waste and breakage tracking works in practice, see our guide on bar inventory waste and breakage tracking.
Ask: can your bar inventory system break down variance by cause - spillage, theft, over-pour, breakage - per site, and compare them across the group?
Par Calculations That Ignore Open Orders - How Duplicate Purchasing Happens
Par-level ordering is the standard method for bar inventory replenishment. When stock falls below the par threshold, a reorder is triggered. The logic is straightforward and works well when the par calculation has access to complete information. It breaks when it does not.
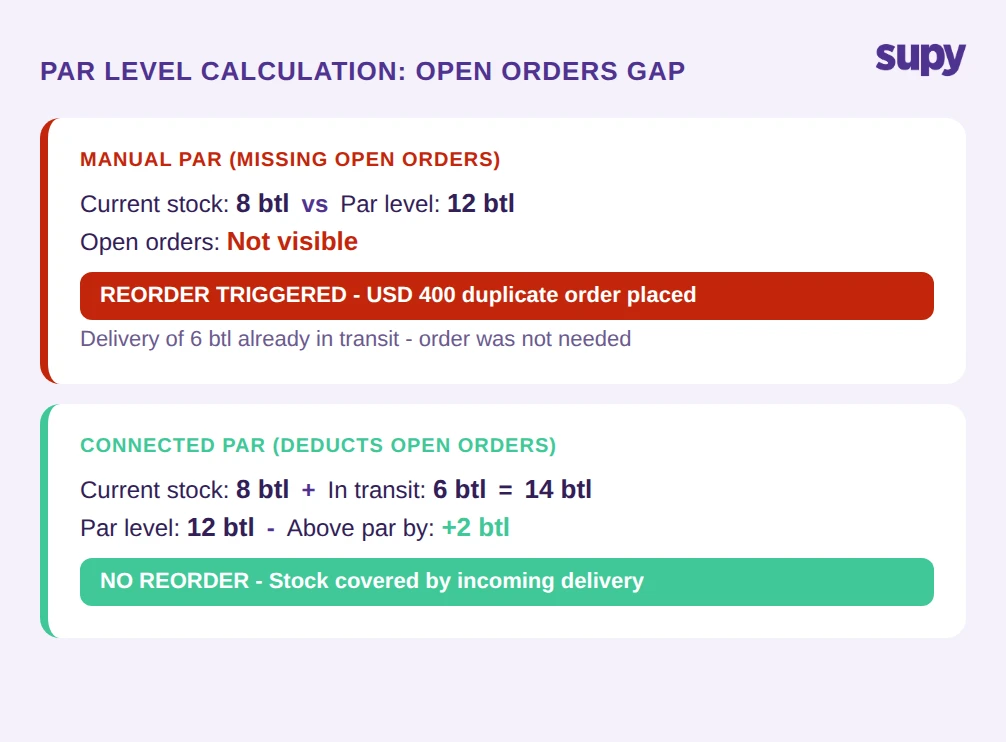
The specific failure mode is the open-orders gap. When a location's bar inventory system calculates par and does not account for purchase orders that are already placed but not yet received, the math produces a false picture. Stock is below par. An order is due to arrive. The system does not know the order exists. The system triggers a reorder.
The result is duplicate purchasing: two orders for the same stock, placed days apart, both arriving at the location. One was necessary. One cost USD 400 - or more, depending on the volume - and will sit in the storage room, tying up cash and creating an overstock situation for that item.
For a single-location bar, this happens occasionally and gets caught manually. For a 5-location group placing orders across multiple sites, multiple categories, multiple suppliers, the open-orders gap is a recurring cost that is difficult to attribute without the right system. A connected bar inventory system closes this gap by making open purchase orders visible to the par calculation - before a reorder fires, the system checks whether stock is already in transit. Ask: when your bar inventory system calculates whether a reorder is needed, does it deduct quantities already on open purchase orders from the calculation?
What a Connected Bar Inventory System Actually Changes
A connected bar inventory system does not primarily change what information is collected. It changes what is visible, when, and to whom. The bar manager doing a weekly stock count is still counting. The difference is that the count result feeds into a system that also holds the theoretical usage from sales, the wastage records, the open orders, and the counts from every other location in the group.
For the ops manager spending a day each month consolidating spreadsheets: the group view exists without the consolidation task. Beverage cost by brand, by location, by category, is available on demand rather than built manually after the fact.
For the finance manager who could not explain variance without further investigation: the variance figure comes with a cause breakdown. The unexplained portion is separated from the documented wastage. The two numbers have different operational implications and can be acted on differently.
For the location manager whose par system was triggering duplicate orders: the open-orders gap is closed. Reorders only fire when incoming stock will not cover the shortfall.
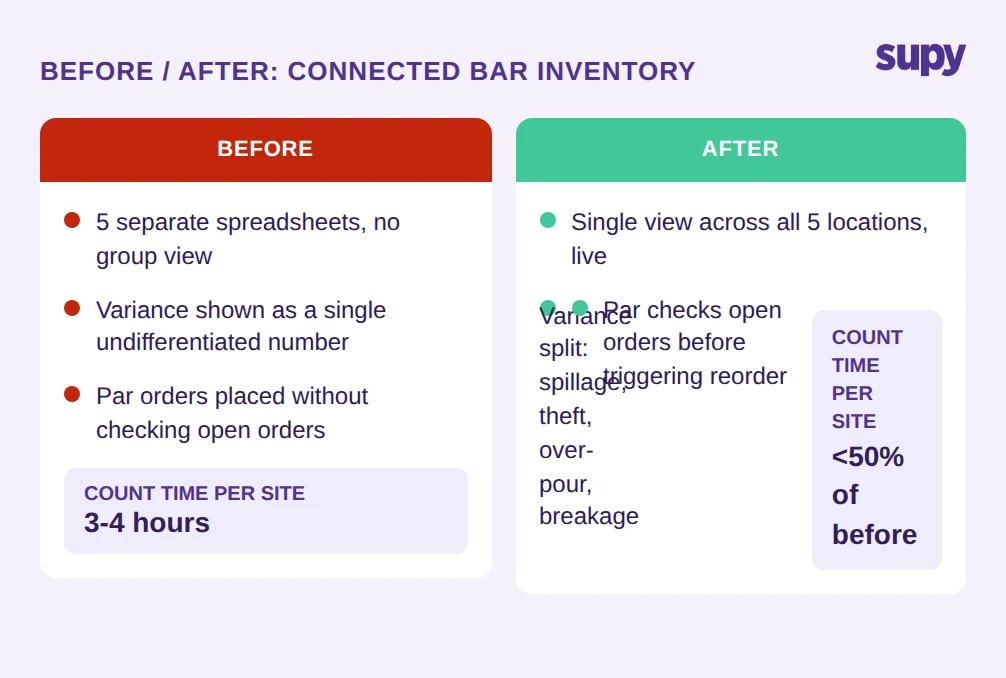
Groups that shift from manual to connected bar inventory management typically report stock count times cut by more than 50% due to mobile counting tools, template reuse, and parallel counting that merges results automatically. That time saving is real, but the larger operational value is the quality of the information that comes out of the count - information that can be acted on at the group level rather than site by site. Ask: if you connected your bar inventory across all locations today, which decisions would you be able to make faster?
Multi-location bar operations reach a point where manual bar inventory management is not just inefficient - it is structurally unable to produce the information the group needs. The variance is there, but you cannot explain it. The group view exists, but only after someone has spent time building it. The par orders are placed, but some of them are duplicates. These are not people problems. They are system problems that scale with the size of the operation.
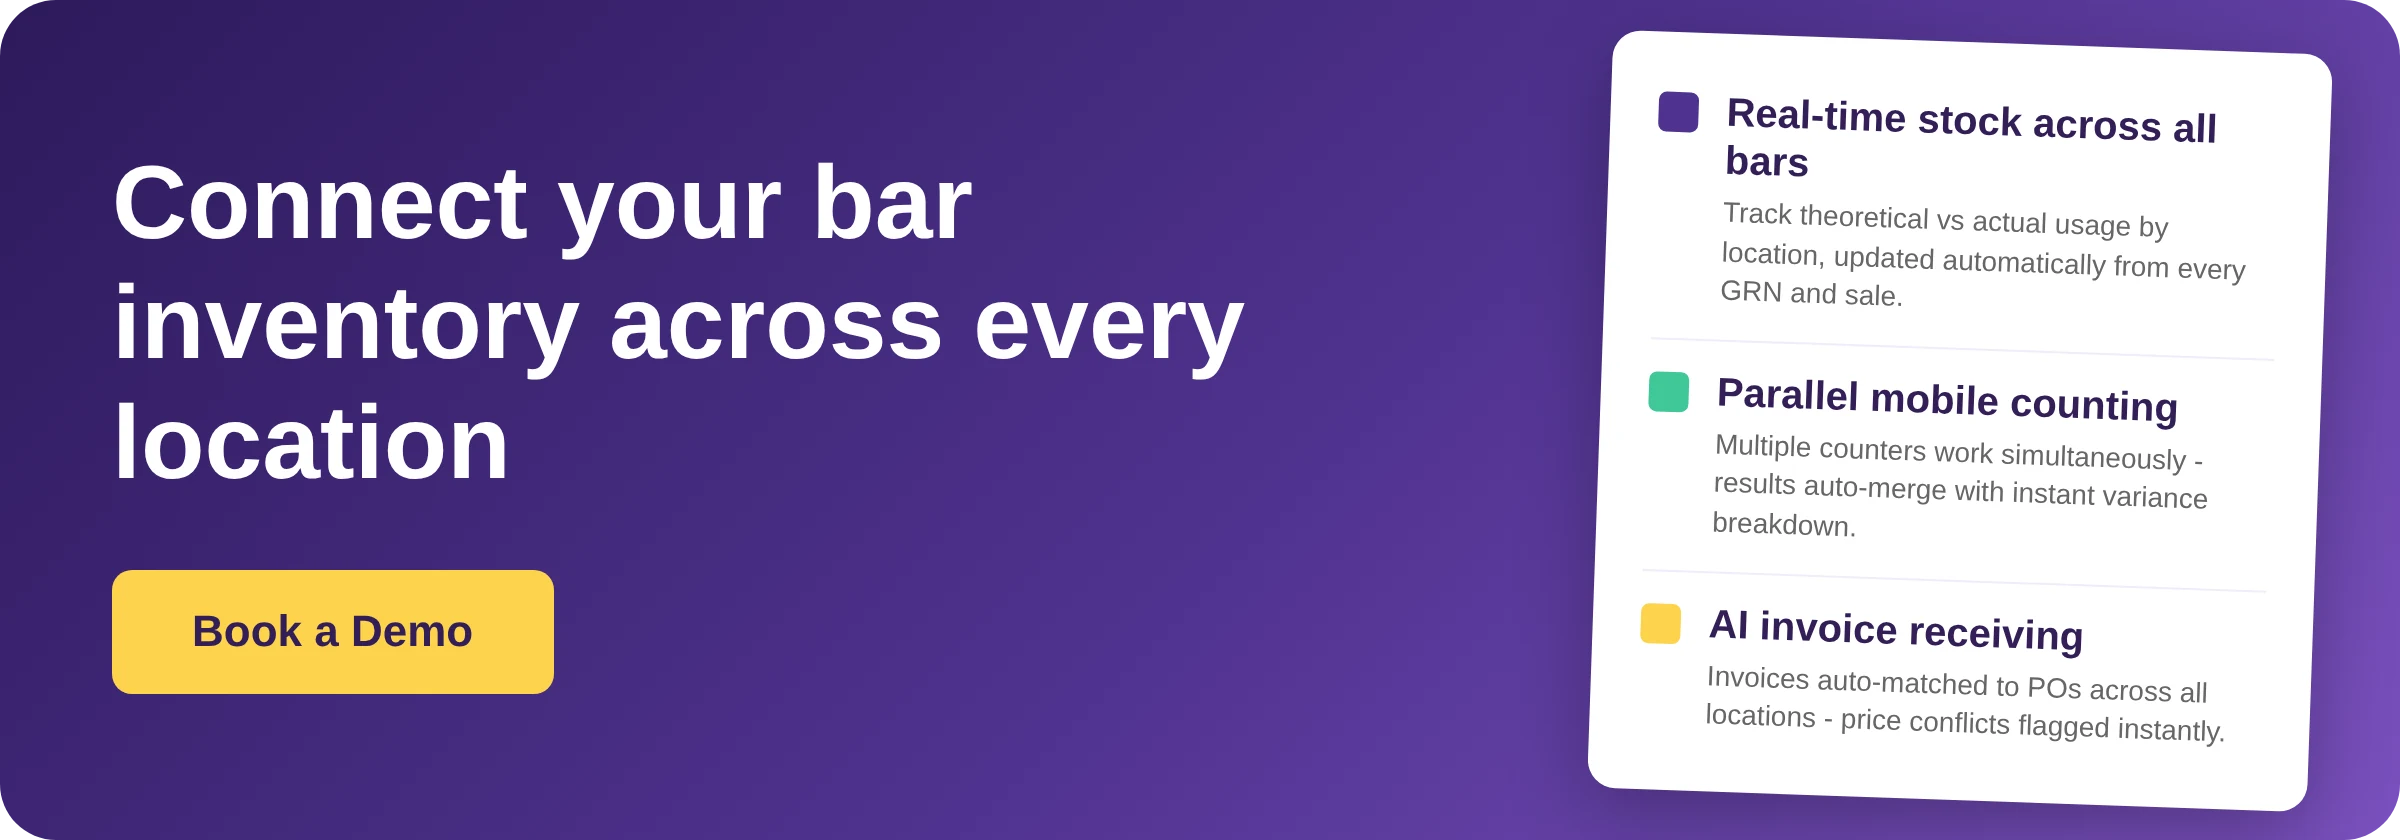
Supy gives multi-location F&B groups a single inventory system across all sites - covering real-time stock visibility, cause-level variance tracking, and par calculations that account for open orders. If you are running bar inventory management across more than two locations, book a demo to see how it works in practice.