.jpg)


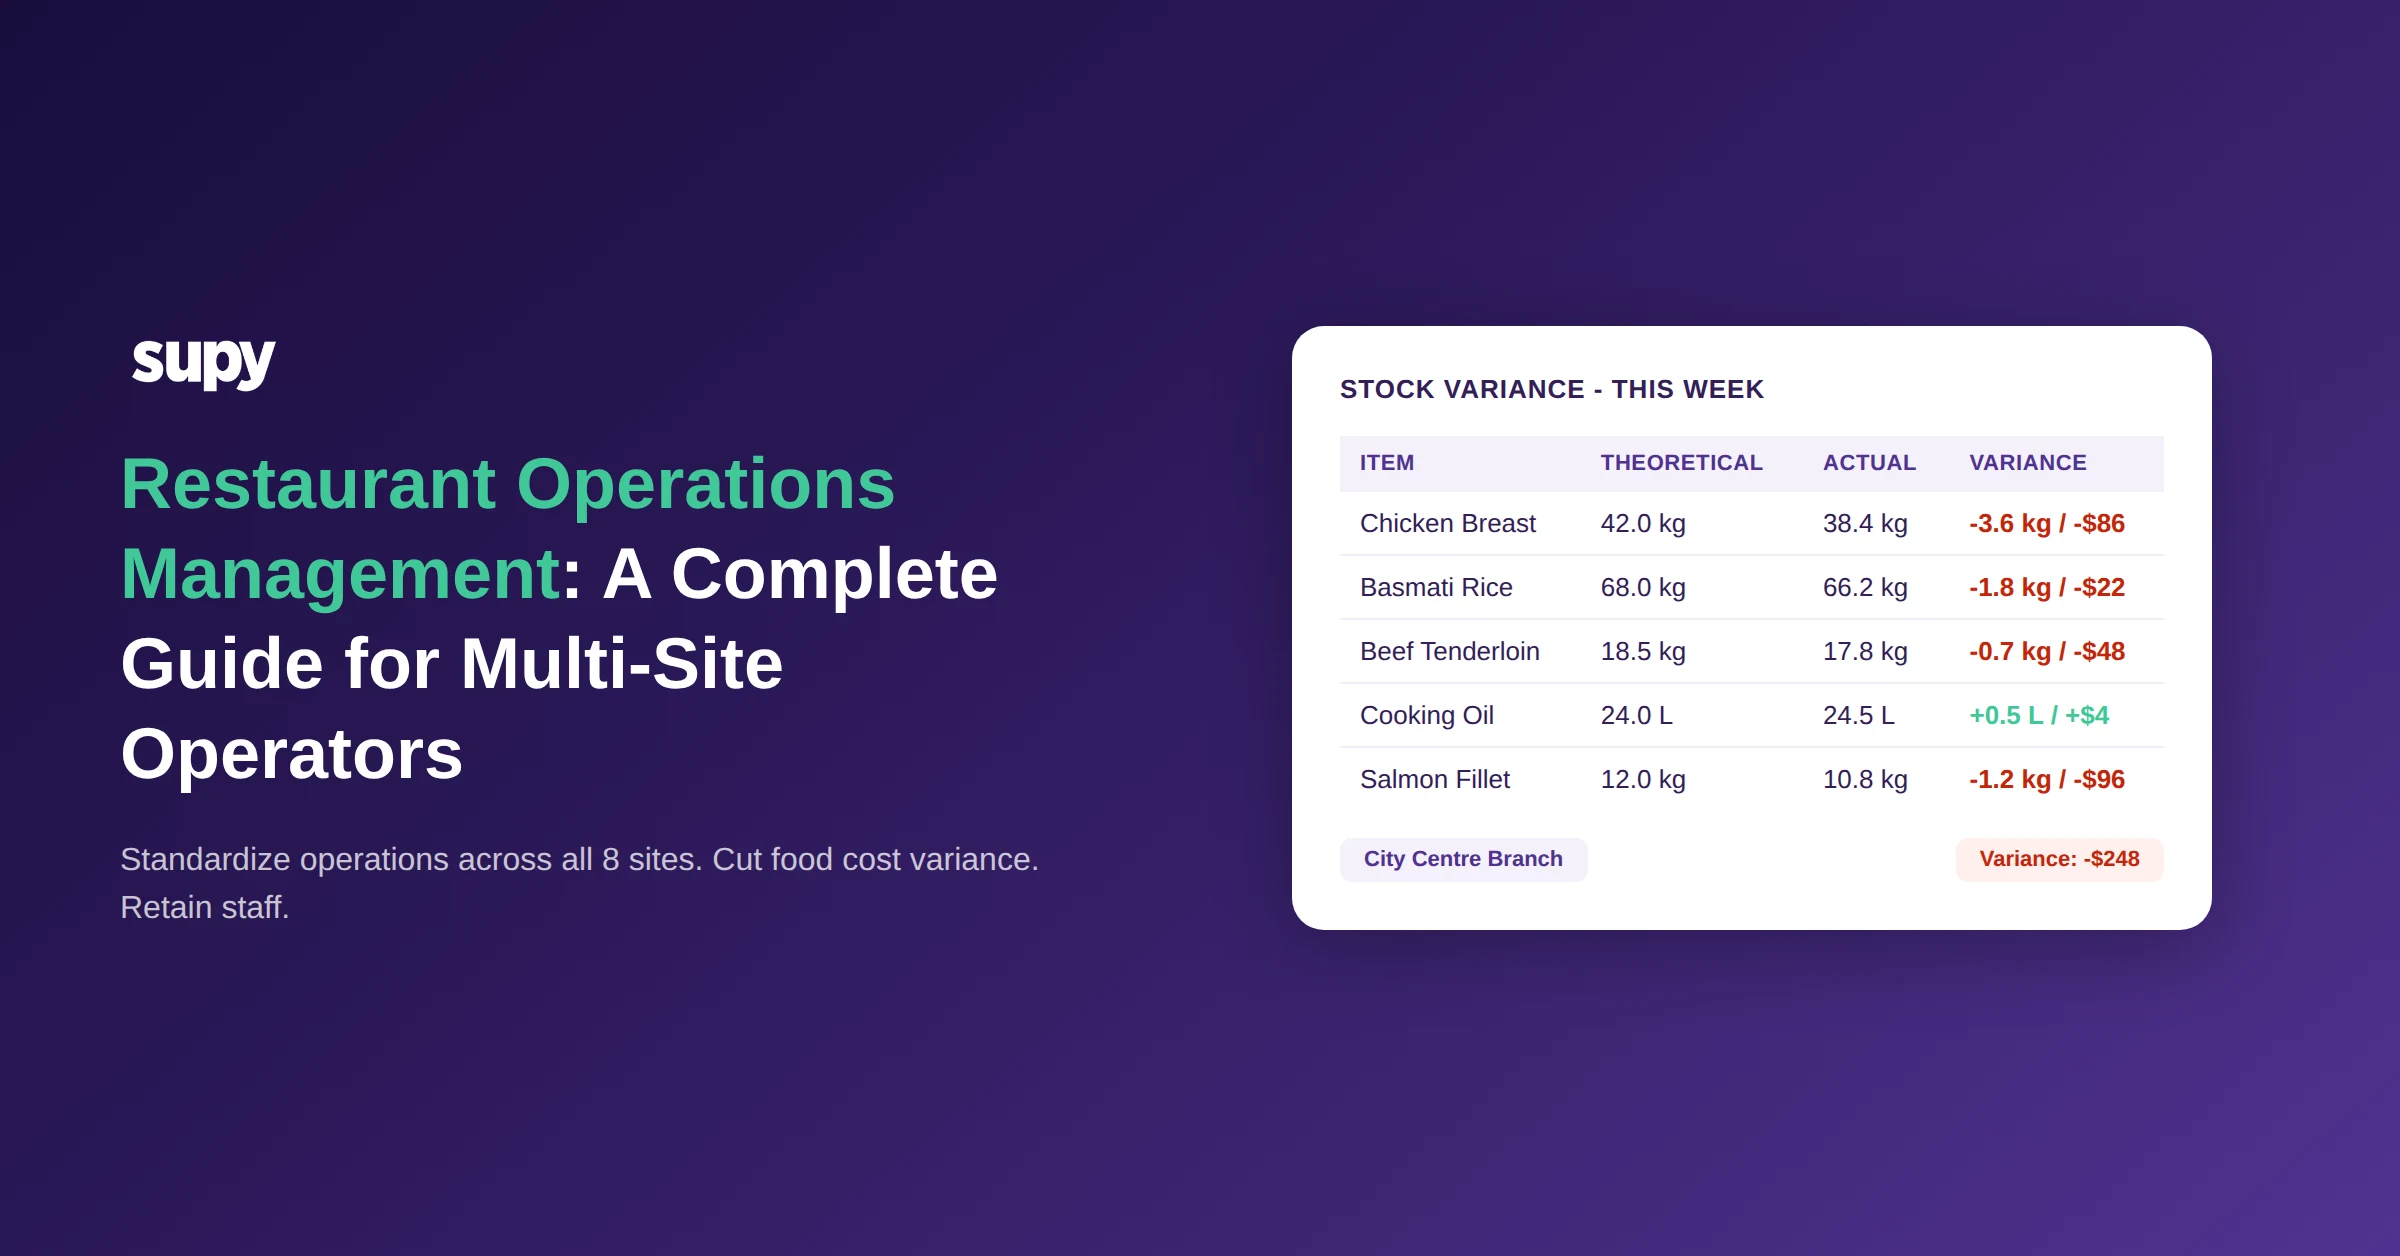
Restaurant Operations Management: A Complete Guide for Multi-Site Operators
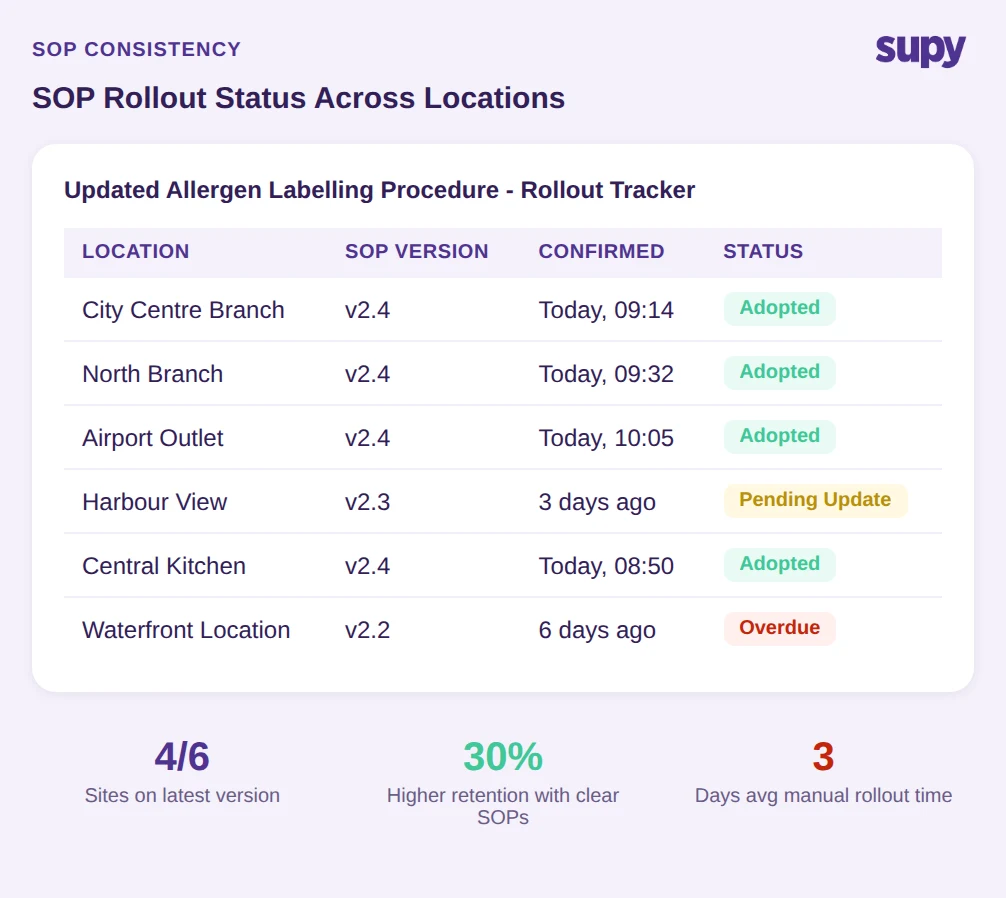
Why SOP Consistency Determines Multi-Site Performance
SOPs designed for a single location rarely survive contact with a second site without a system to enforce them. What works when a founder or senior manager is physically present breaks down when the same procedures must run reliably across 8 sites simultaneously. The result is operational drift - small deviations that compound over weeks into measurable food cost variance and inconsistent guest experience.
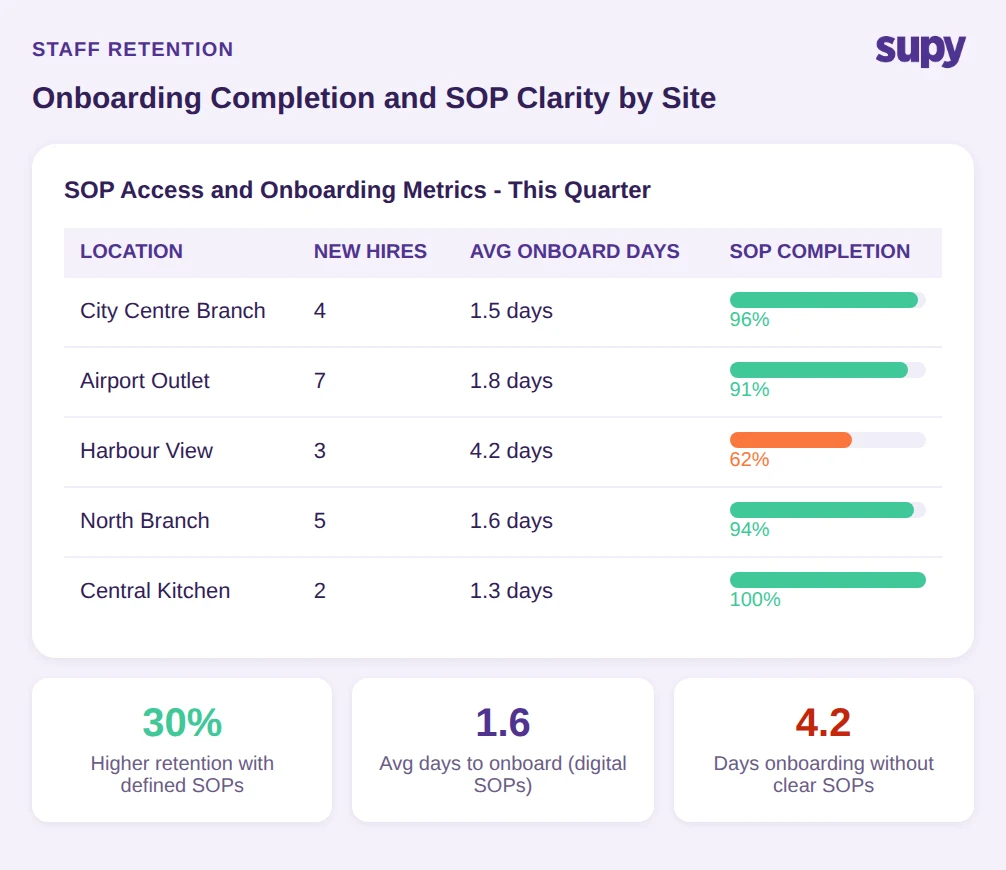
The data supports this. Restaurants with well-defined SOPs experience up to 30% higher staff retention because job clarity reduces training ambiguity and gives staff a clear operational framework. For multi-location groups, that retention lift only materializes when SOPs are enforced digitally - not stored in a shared folder that managers may or may not open.
The practical fix is a system where corporate teams manage master procedures and updates publish to all locations simultaneously. When a procurement policy changes or a new prep recipe is adopted, every site receives the same update at the same time. An operator running 8 sites without this process typically takes 3 days to roll out a single SOP update manually - with no guarantee of consistency across branches.
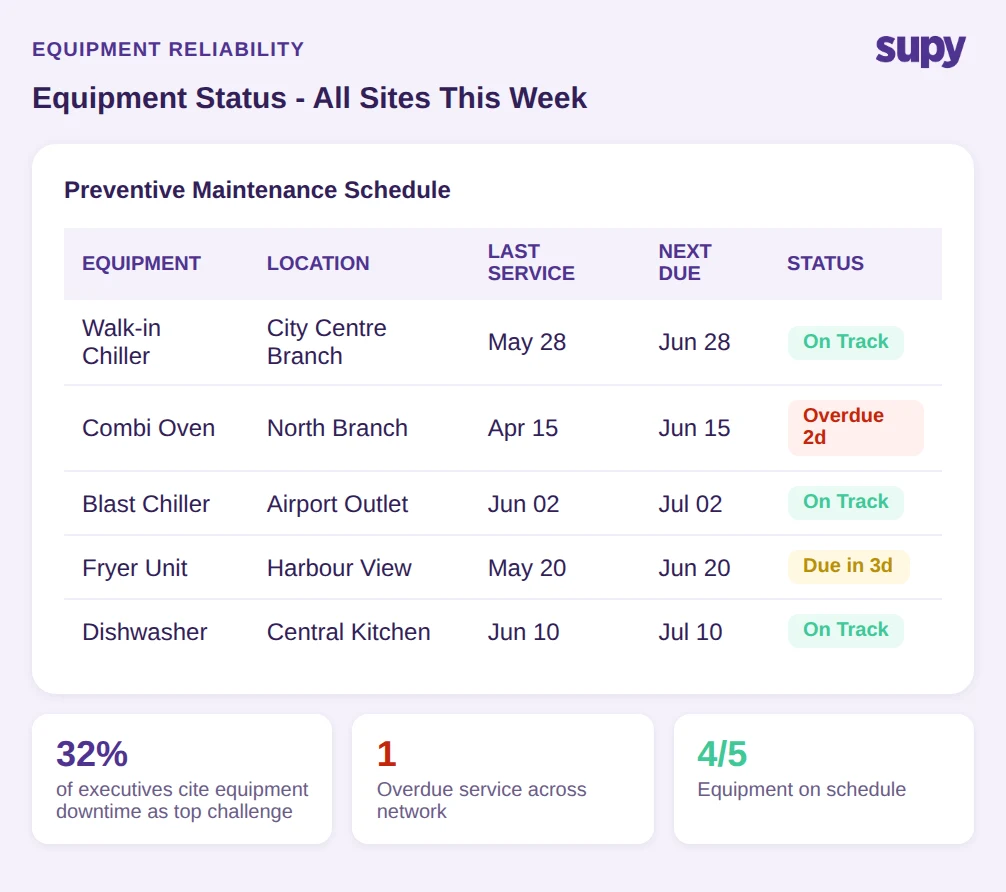
Equipment Reliability as a Managed Asset, Not a Surprise
Equipment downtime is the second most disruptive operational challenge in the restaurant industry. According to industry data, 32% of restaurant executives cite minimizing equipment downtime and ensuring reliability as a top operational concern. The pattern is consistent: groups that treat maintenance reactively - fixing equipment after it fails - incur higher costs and more service disruption than those with proactive scheduling.
For multi-site operators, the stakes are higher because equipment failure at one site affects the entire network's output visibility. A cold storage failure at one branch creates a stock variance that cascades into procurement decisions at the central kitchen if the two systems are not connected.
Effective restaurant operations management treats equipment as a managed asset with a maintenance schedule, service history, and alert thresholds - not as a line item on the P&L that only appears when something breaks. Operators who integrate equipment status into their operational dashboards detect problems before they become downtime events.
Real-Time Data and the Hours-Not-Weeks Advantage
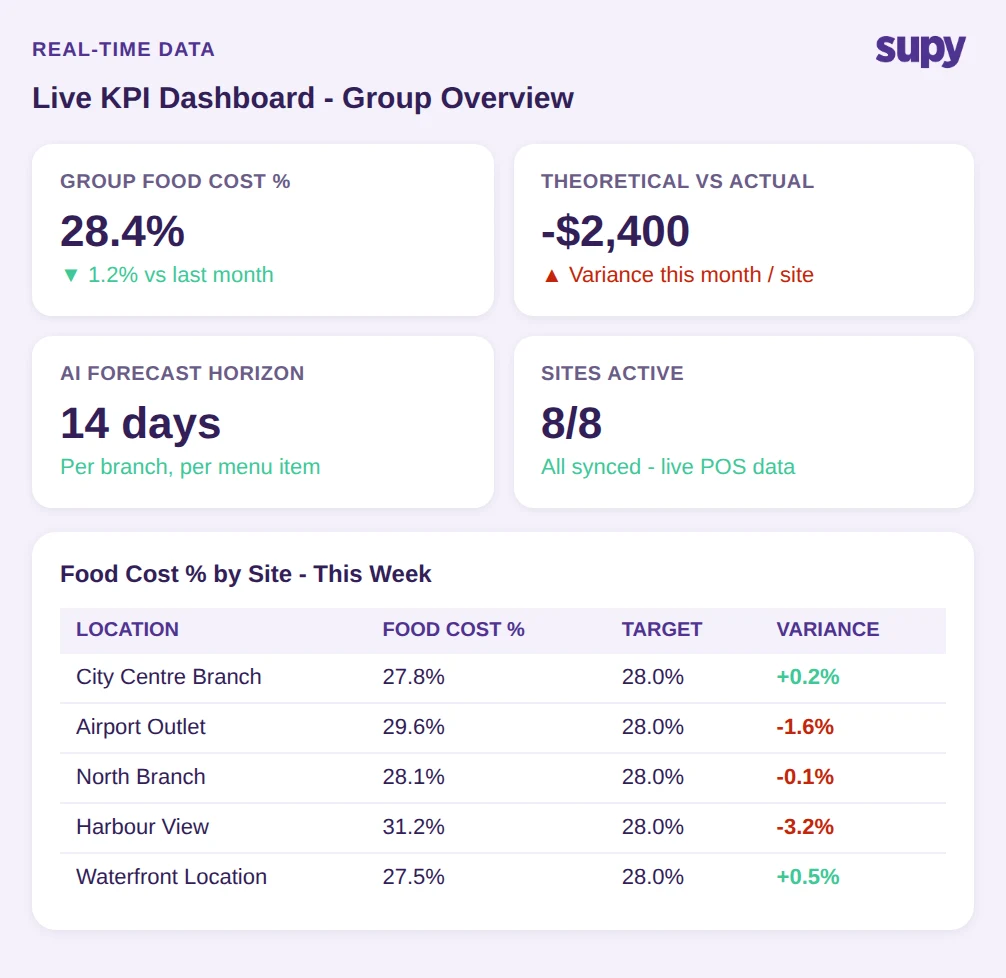
The gap between operators who catch food cost variance in hours versus those who catch it in weeks is the defining operational advantage in multi-site restaurant management. Top-performing groups centralize POS, inventory, and HR data in real time, standardize KPIs on a single reference framework, and use AI to forecast demand site by site - adjusting labour and inventory before variance appears.
Supy's AI Sales Forecasting predicts daily sales by branch for the next 14 days, down to individual menu items. The forecast runs against an 8-week historical average with daily POS sync, and managers can apply overrides for local events or seasonal factors. From that forecast, Supy's AI Predictive Ordering builds ready-to-submit purchase orders automatically - calculating what each branch needs through recipes, adjusted for current stock on hand.
For a group running 8 sites, each carrying around 340 ingredients, the manual alternative - weekly stock counts, manual PO calculations, and email-based approval chains - produces a lag of days before variance is visible. By that point, the operator has already absorbed the cost. Real-time inventory visibility that flags theoretical-versus-actual variance at the line-item level closes that gap. Explore how Supy's live stock visibility works across multi-site networks.
Compliance Readiness Without the Manual Tracking Burden
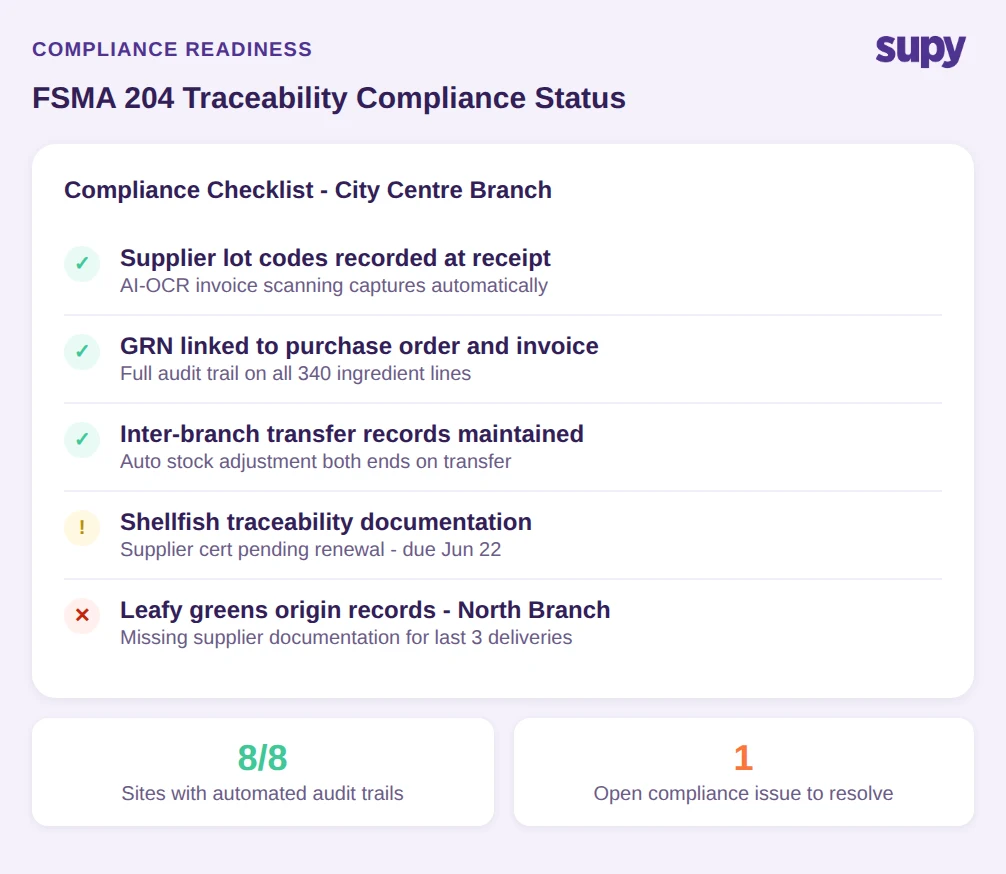
FSMA 204 traceability requirements are adding a new compliance layer for multi-site restaurant groups. The rules require detailed food tracking across the supply chain - lot codes, supplier records, and movement documentation that must be retrievable in an audit. For operators running patchwork systems across locations, compliance risk compounds with each additional site.
The operational problem is not just the audit risk - it is the manual workload required to maintain compliant records site by site when procurement, receiving, and stock movement happen in disconnected tools. Groups that have centralized their procurement and inventory data into a single platform already generate the traceability records that FSMA 204 requires as a natural output of daily operations.
Supy's invoice scanning uses AI-OCR to auto-populate delivery records and flags price or quantity conflicts at the point of receipt. Every goods received note, transfer, and stock adjustment creates an audit trail automatically. For multi-site groups, this means compliance readiness is a by-product of the same system used for day-to-day restaurant operations management - not a parallel administrative process.
Staff Retention Starts With Operational Clarity
Staffing remains the most persistent challenge in restaurant operations in 2026. High turnover is partly a labour market condition, but it is also an operational design problem. When staff cannot find clear guidance on procedures, when training materials are outdated or inconsistent across sites, and when onboarding requires significant manual instruction from managers, turnover accelerates. The cost is not just the recruiting expense - it is the operational knowledge that leaves with each departing employee and the weeks of reduced output while their replacement gets up to speed.
Restaurants with defined SOPs see up to 30% higher staff retention because operational clarity reduces the friction that drives early departures. Staff who know what is expected, have accessible reference materials, and can complete tasks without waiting for manager intervention are more productive and more likely to stay.
For multi-location groups, the calculus is direct: management tools that require significant training investment become a liability when trained staff leave. Platforms with intuitive mobile interfaces and minimal manual entry reduce the onboarding cost per hire and maintain operational continuity when turnover occurs. Supy's mobile-first design means a new team member at any branch can run a stock count, submit a requisition, or receive a delivery within their first shift - without a multi-day training cycle.
How Top Performers Set KPIs Across Every Location
KPI alignment is the structural layer that holds multi-site restaurant operations management together. Without a single reference framework, each site reports differently, comparisons become unreliable, and the group loses its ability to identify which locations are performing and which are drifting.
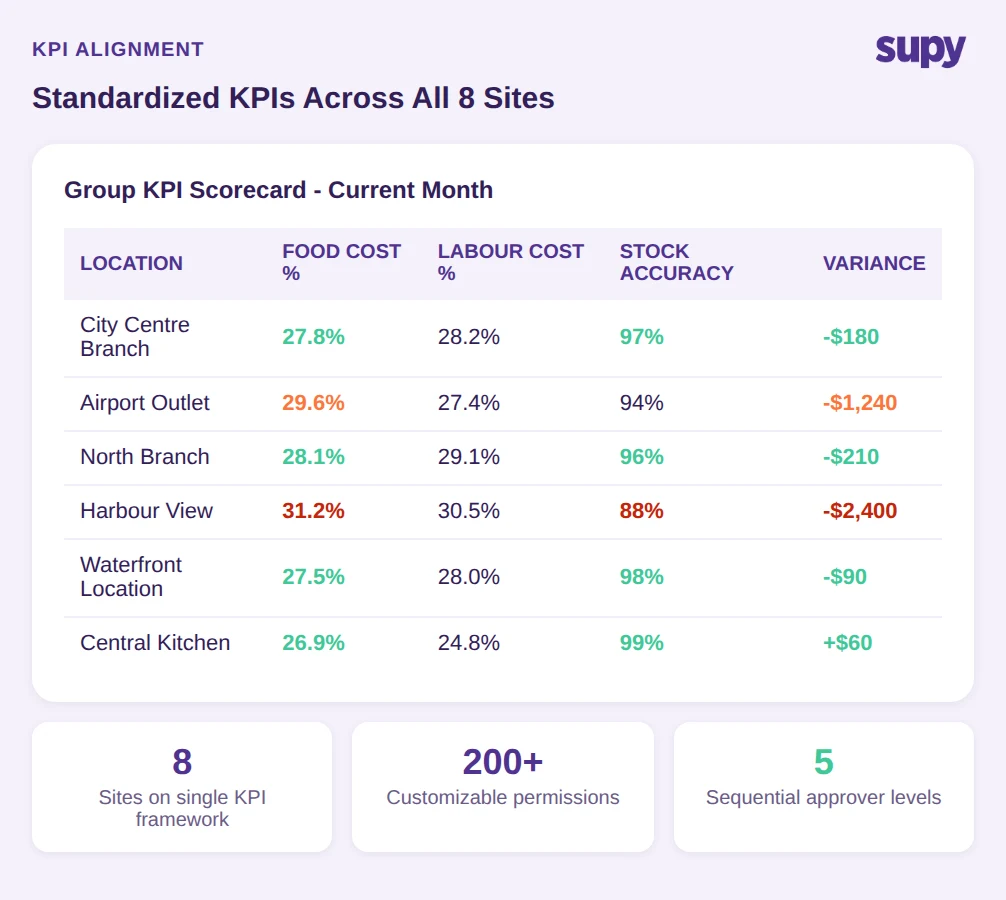
Top-performing multi-location networks standardize on a core KPI set: food cost percentage by site and by menu category, theoretical-versus-actual variance, labour cost as a percentage of revenue, and stock count accuracy. These metrics are meaningful only when they are calculated consistently - using the same recipe data, the same cost inputs, and the same counting methodology across every location.
Supy's interactive dashboards show live COGS and food cost percentage at group level, by site, and by menu category. Theoretical-versus-actual variance and wastage figures update in real time as stock movements are recorded. For a group running 8 sites with average food cost variance of $2,400 per site per month, the dashboards surface where that variance is concentrated - which site, which category, which ingredient - rather than presenting a blended number that obscures the signal.
The permission and approval architecture supports this: Supy's sequential approval system supports up to 5 approvers with 200+ customizable permissions, allowing operators to set the right governance level for each role across their network without creating operational bottlenecks. A procurement manager at a single site can be permitted to approve orders up to a set threshold, while group-level finance retains visibility and sign-off authority for larger purchases - all within the same platform that tracks inventory and recipes.
Restaurant operations management at scale is not a single practice - it is a coordinated set of systems that must run in parallel across every location. SOP consistency, equipment reliability, real-time data, compliance tracking, staff retention, and KPI alignment are not separate workstreams. They are interdependent: a gap in one creates pressure in the others. A group that has strong KPI visibility but no digital SOP enforcement will see its metrics improve at sites where managers happen to run tight operations and degrade everywhere else. A group with excellent SOP adoption but no real-time stock data will still absorb food cost variance that a connected system would surface in hours.
The operators who scale successfully treat these as an integrated system from the start. They invest in platforms that connect procurement, inventory, recipes, and reporting in a single data model - so that a change in a supplier price automatically flows through recipe costs, purchase orders, and food cost reporting at every site. They use AI forecasting to anticipate demand rather than react to it. And they build approval and permission structures that give the right people the right access at every level of the organization.
For operators currently managing on spreadsheets and disconnected tools, the transition to a centralized platform typically surfaces $2,400 or more in monthly food cost variance per site that was previously invisible - not because the variance did not exist, but because the data was not connected enough to show it.