.jpg)


Restaurant Inventory Control: How to Stop Losing Money on Waste and Shrinkage
Every week across multi-unit restaurant groups, uncontrolled inventory losses add up. A 12-site casual-dining group running an average of 8% weekly variance on $45,000 in food spend loses $3,600 each week - or roughly $187,000 annually - to waste, shrinkage, and counting errors alone.
What makes this worse: many operators don't know it's happening until the profit margin has already eroded. Inventory control sounds like a back-of-house chore. It's actually the fastest way to unlock cash that's sitting invisible in your stockrooms and food waste bins.
This guide covers what restaurant inventory control actually means, the five core methods every operation needs, how to spot the mistakes that kill discipline at scale, and why operators who've implemented proper inventory control consistently cut food spend variance from 8-12% down to 4-6%.
What Restaurant Inventory Control Actually Means
Inventory control isn't the same as inventory management. Management is the broader operation - how you buy, store, and deploy stock across your locations. Control is the disciplined practice of knowing exactly what you have, catching loss as it happens, and preventing it from recurring.
Specifically, inventory control means:
- Establishing target stock levels (par levels) for every item at every location based on actual demand and shelf life
- Tracking what leaves through daily or weekly variance reporting that flags unexpected swings
- Counting stock systematically - not once a year, but frequently enough to catch loss patterns before they compound
- Analysing loss by type - differentiating spoilage (preventable through storage and rotation), waste (preventable through process), shrinkage (loss detection), and theft (investigation and policy)
- Acting on variance quickly - using data to adjust processes within days, not months
An operations director at a 12-site casual-dining group put it plainly: "We thought variance tracking was compliance. Turns out it's the fastest way to catch process problems before they cost us. Once we started acting on weekly variance swings, our food spend dropped $2,100 a week across the group."
The distinction matters. Groups can run manual inventory control with par levels, weekly variance checks, and fortnightly cycle counts. Software accelerates it, reduces human error, and scales it - but discipline comes first.
The Real Cost of Poor Inventory Control
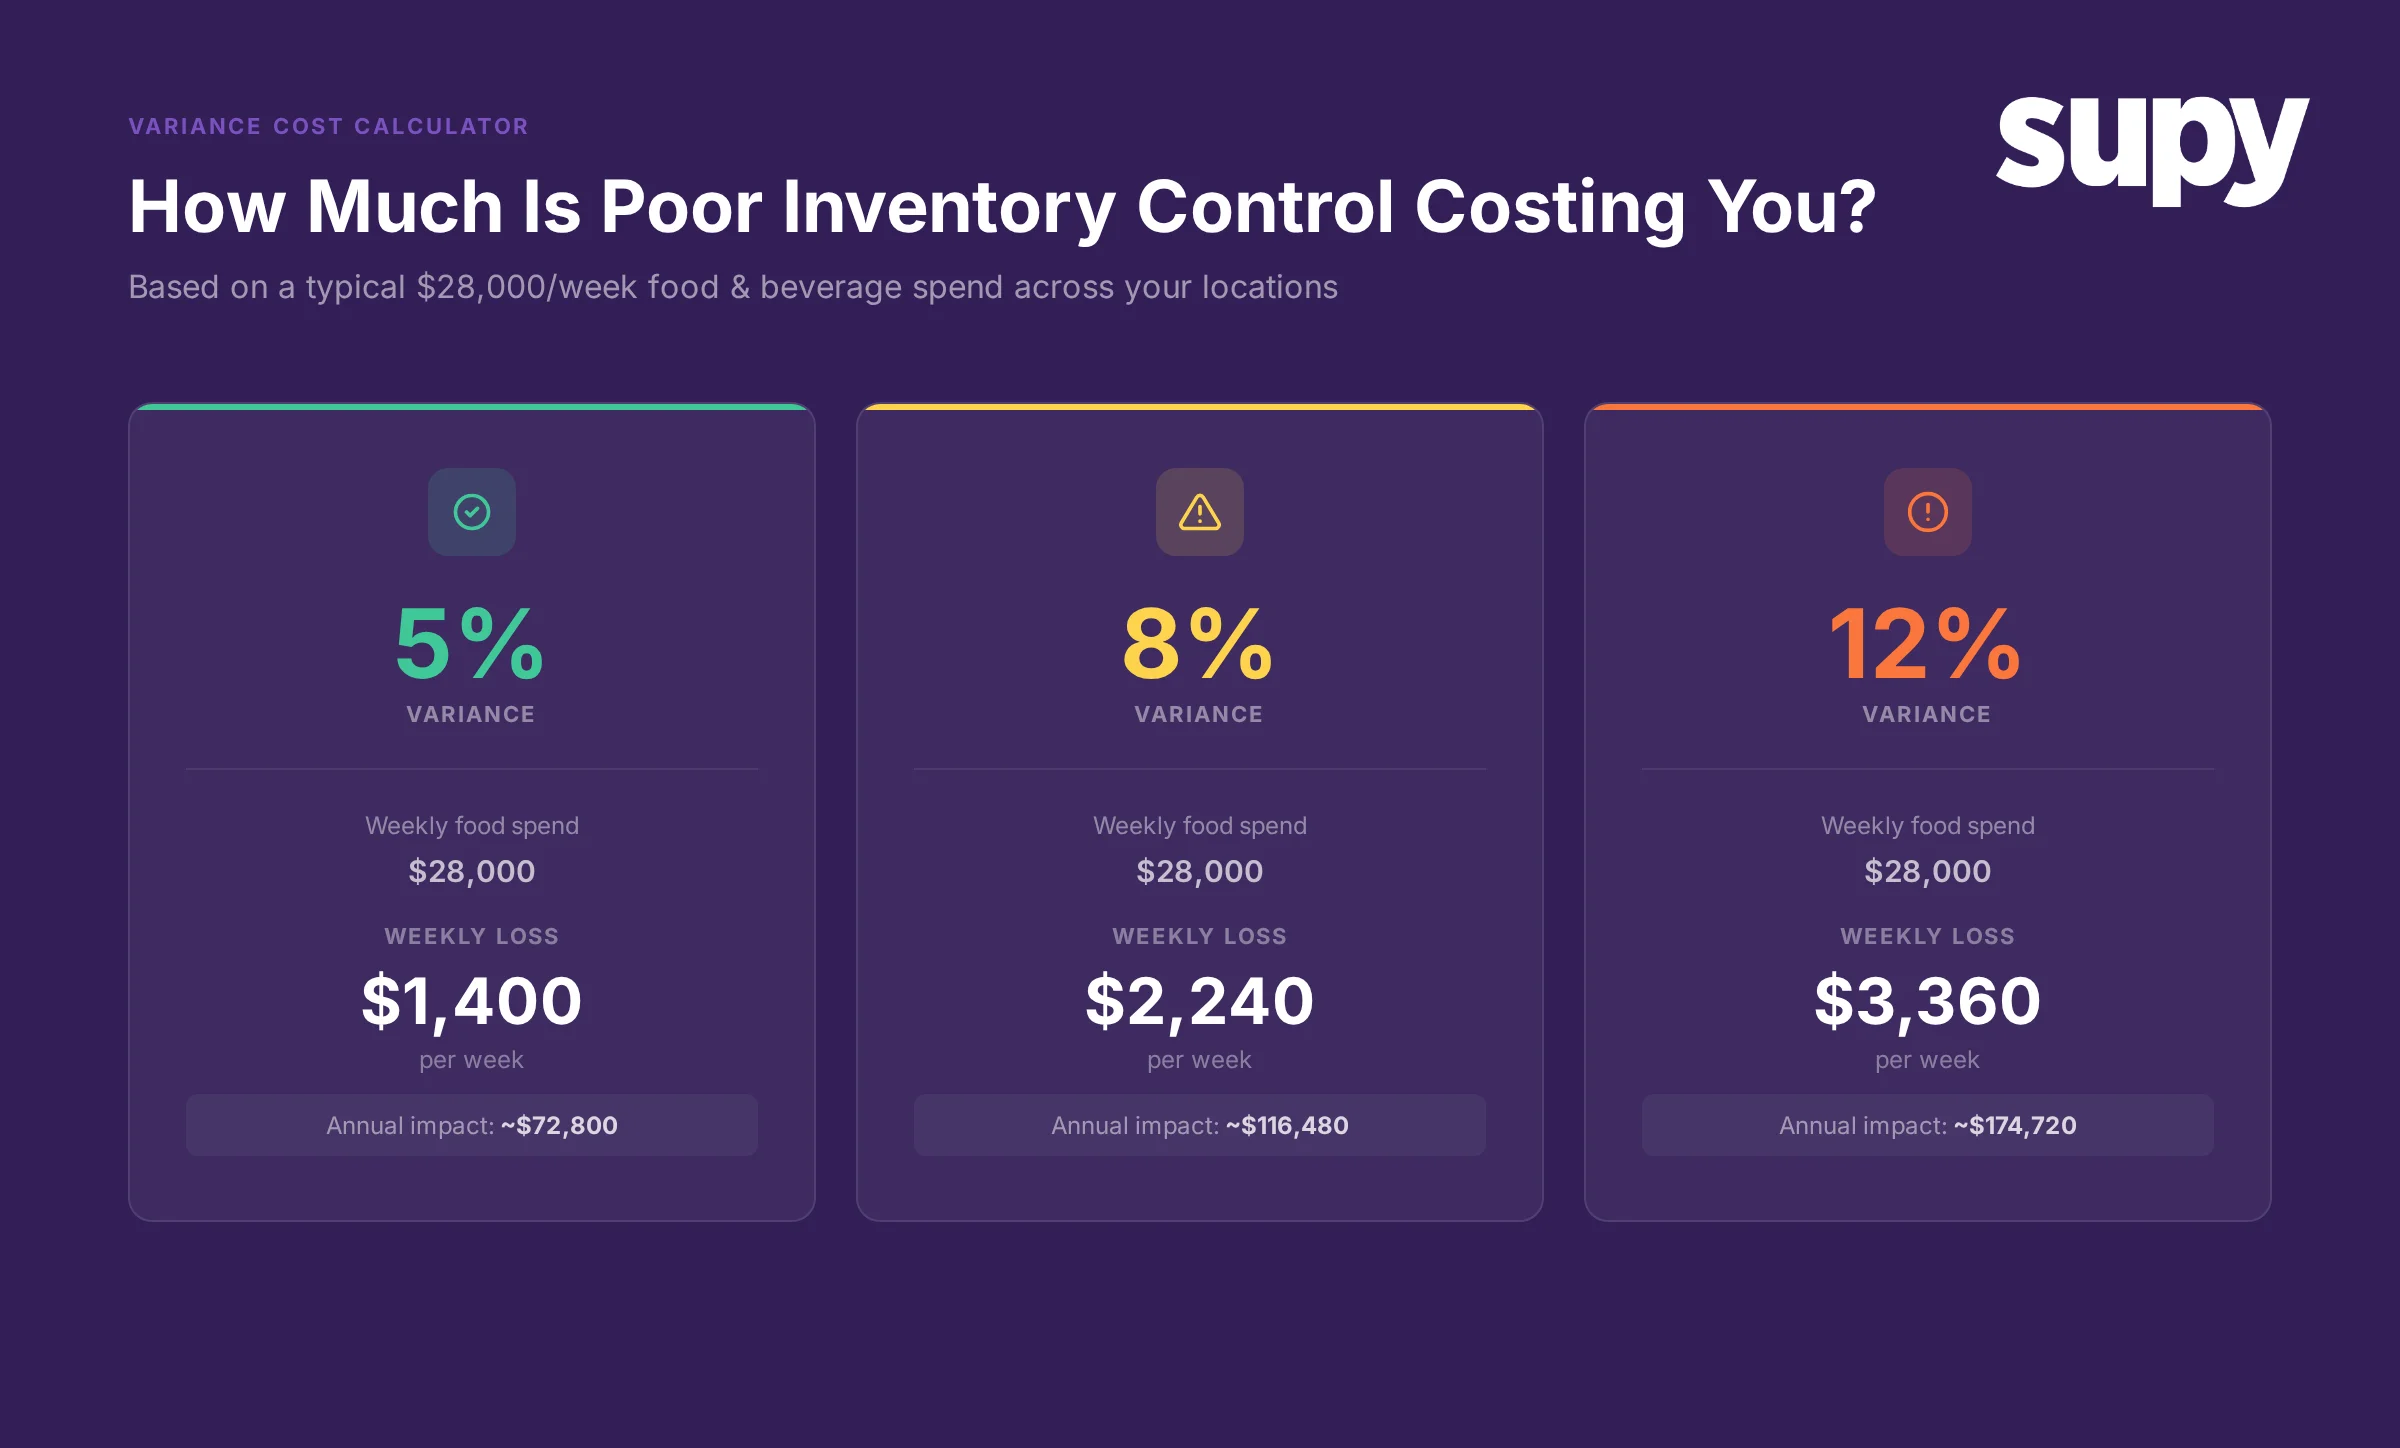
Most operators know they're losing money. What they often underestimate is the magnitude.
Across restaurants Supy works with, uncontrolled food spend variance typically sits between 4-12% of total weekly food spend. That looks like this across three operational sizes:
8-Site Independent Fast-Casual Group
Weekly food spend: $28,000 | Running variance: 7% | Weekly loss: $1,960 | Annual cost: $101,920
4-Site Casual-Dining Group
Weekly food spend: $18,000 | Running variance: 8% | Weekly loss: $1,440 | Annual cost: $74,880
15-Site Multi-Unit Group
Weekly food spend: $65,000 | Running variance: 6% | Weekly loss: $3,900 | Annual cost: $202,800
But the cost compounds faster than the maths suggests. Groups with poor variance control spend labour hours chasing down loss after it's happened - running emergency stocktakes, investigating shrinkage spikes, re-ordering when stock runs out unexpectedly. A group reducing variance from 8% to 5% doesn't just save the 3% in direct loss; it also eliminates the labour cost and operational disruption of managing crises.
The Five Core Inventory Control Methods
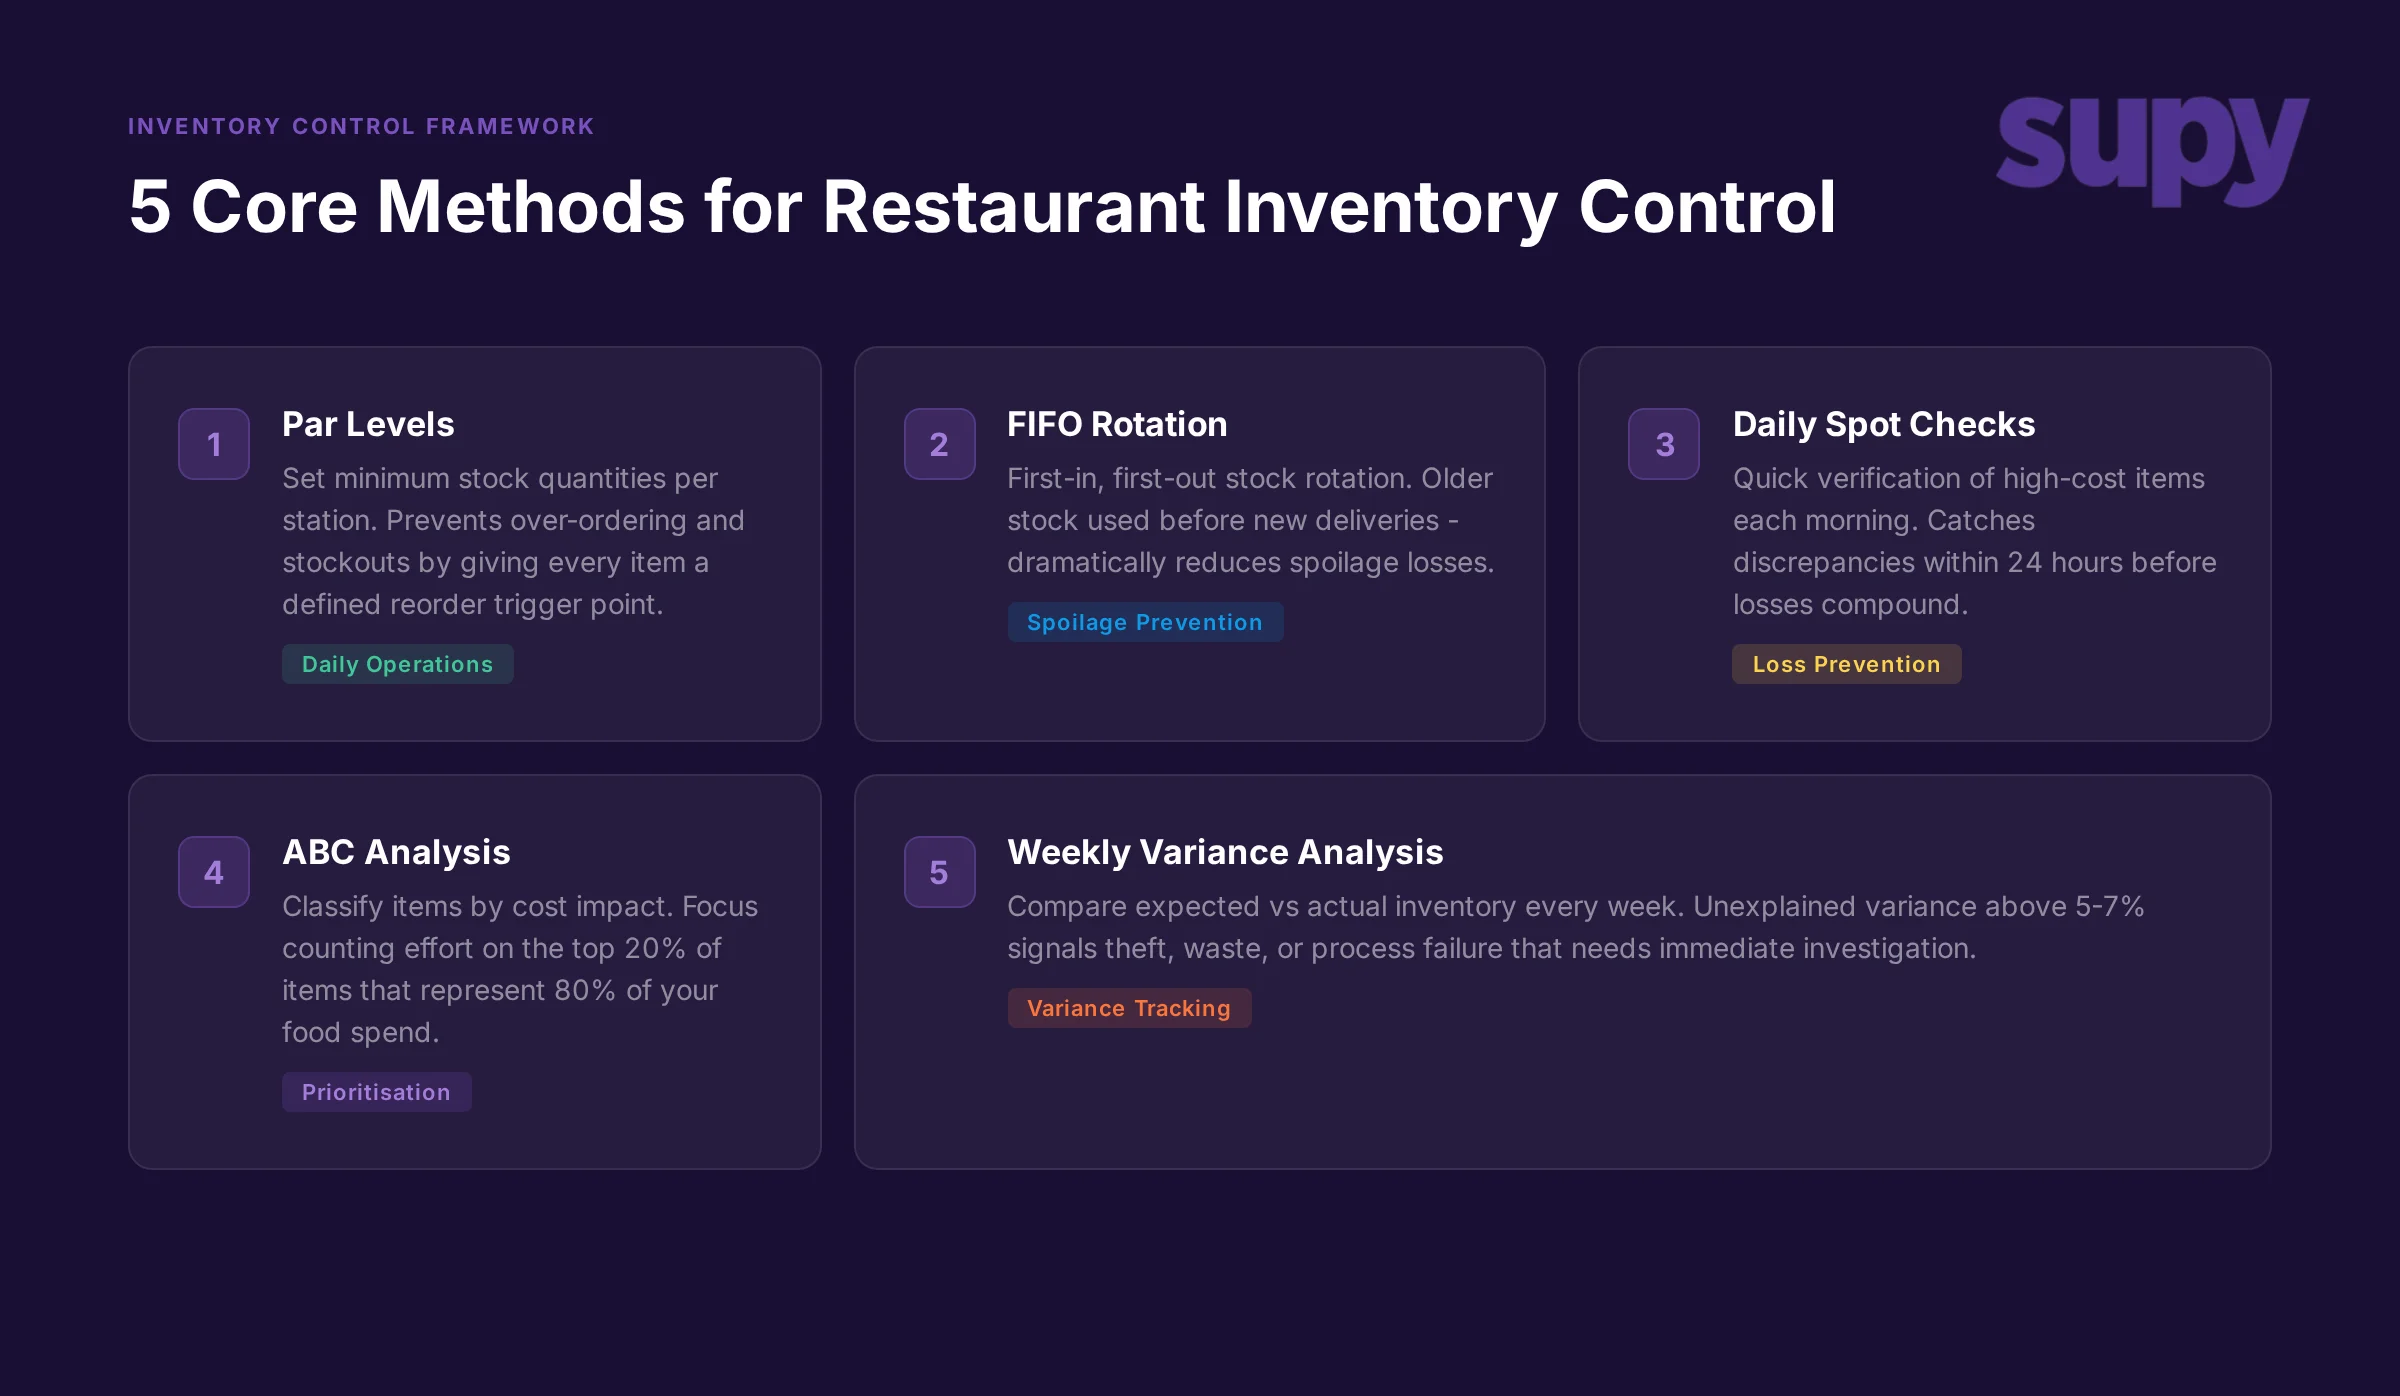
Effective inventory control rests on five integrated practices. They work better together than separately.
1. Par Levels (Target Stock Quantities)
A par level is the optimal stock quantity for a given item at a given location - the amount needed to cover demand during your supplier lead time, with a safety buffer for unexpected spikes. It is not a ceiling or a maximum; it's the target. Calculated based on: daily usage rate, lead time from supplier, and shelf life.
Simple example: your kitchen uses 40 pounds of olive oil per week, your supplier delivers every Tuesday (7-day lead time), par level for olive oil is 40 pounds - one week's supply to cover lead time.
Critically, par levels must account for physical storage capacity. A par level of 50kg for chicken is meaningless if your cold store holds 30kg - your effective par level is 30kg. One well-known pizza chain uses this as a management tool: each location is limited to a fixed number of fridges. Staff cannot hoard stock even if they want to. The physical constraint enforces ordering discipline without management intervention, eliminating the most common form of overstocking.
Par levels work because they prevent the two biggest contributors to loss: overstocking (which leads to spoilage) and understocking (which leads to waste and emergency ordering at premium prices). Groups that update par levels monthly and execute daily par level checks report 60% fewer emergency orders and 3-5% lower food spend variance overall.
A head chef at a 6-site fast-casual group: "Par levels changed everything. We were ordering what felt right. Now we order what the data tells us - our stockroom is half as full, our waste is way down, and prep is never waiting for ingredients."
2. FIFO (First In, First Out)
FIFO means older stock moves out before newer stock. It's the single most important defence against spoilage. But FIFO alone doesn't work - most operators assume FIFO is self-managing and it isn't.
Effective FIFO requires: labelling stock by date received, physically rotating stock so older product is in front, and weekly or bi-weekly stock reviews to identify items approaching expiry.
The leverage comes when you combine FIFO with variance analysis. A procurement lead at a 15-site group: "FIFO alone wasn't working - we still had spoilage. But once we started tagging stock by order date and running weekly inventory checks, we knew exactly which items were sitting longest. We moved more slow-moving stock between locations and eliminated the guessing game."
Operators running FIFO systematically alongside variance tracking report 15-25% lower spoilage rates than those using FIFO alone.
3. Par Level Checks (Daily Verification)
A par level check is a quick daily or shift-level count of key items to verify you're staying within target. Not a full stocktake - just checking that critical, high-cost, or high-turnover items are at target.
What to check: proteins (beef, chicken, fish), expensive oils and specialty ingredients, high-turnover items (produce, dairy).
The discipline: if olive oil should be at 40 pounds and you find 62 pounds, something's wrong - either you over-received, usage dipped, or you're over-pouring. Catching this in a daily check means you fix it before a week's worth of loss accumulates.
4. ABC Inventory Analysis (Prioritisation by Value)
Not all inventory loss matters equally. ABC analysis categorises your stock: A items (10% of items, 70% of cost) - proteins, alcohol, premium ingredients. B items (30% of items, 25% of cost) - mid-range staples. C items (60% of items, 5% of cost) - condiments, dry goods, low-cost items.
Why it matters: you count A items fortnightly, B items monthly, C items quarterly. This focuses your effort where the financial impact is highest. A 2% loss on A items costs you far more than a 10% loss on C items.
5. Weekly Variance Analysis and Thresholds
Variance is the difference between what your system says you should have and what you actually count. Calculated as: (Expected inventory - Actual inventory counted) / Weekly food spend x 100.
Example for a 4-site group: weekly food spend $18,000, expected inventory $8,200, actual $7,900. Variance: ($8,200 - $7,900) / $18,000 = 1.67%.
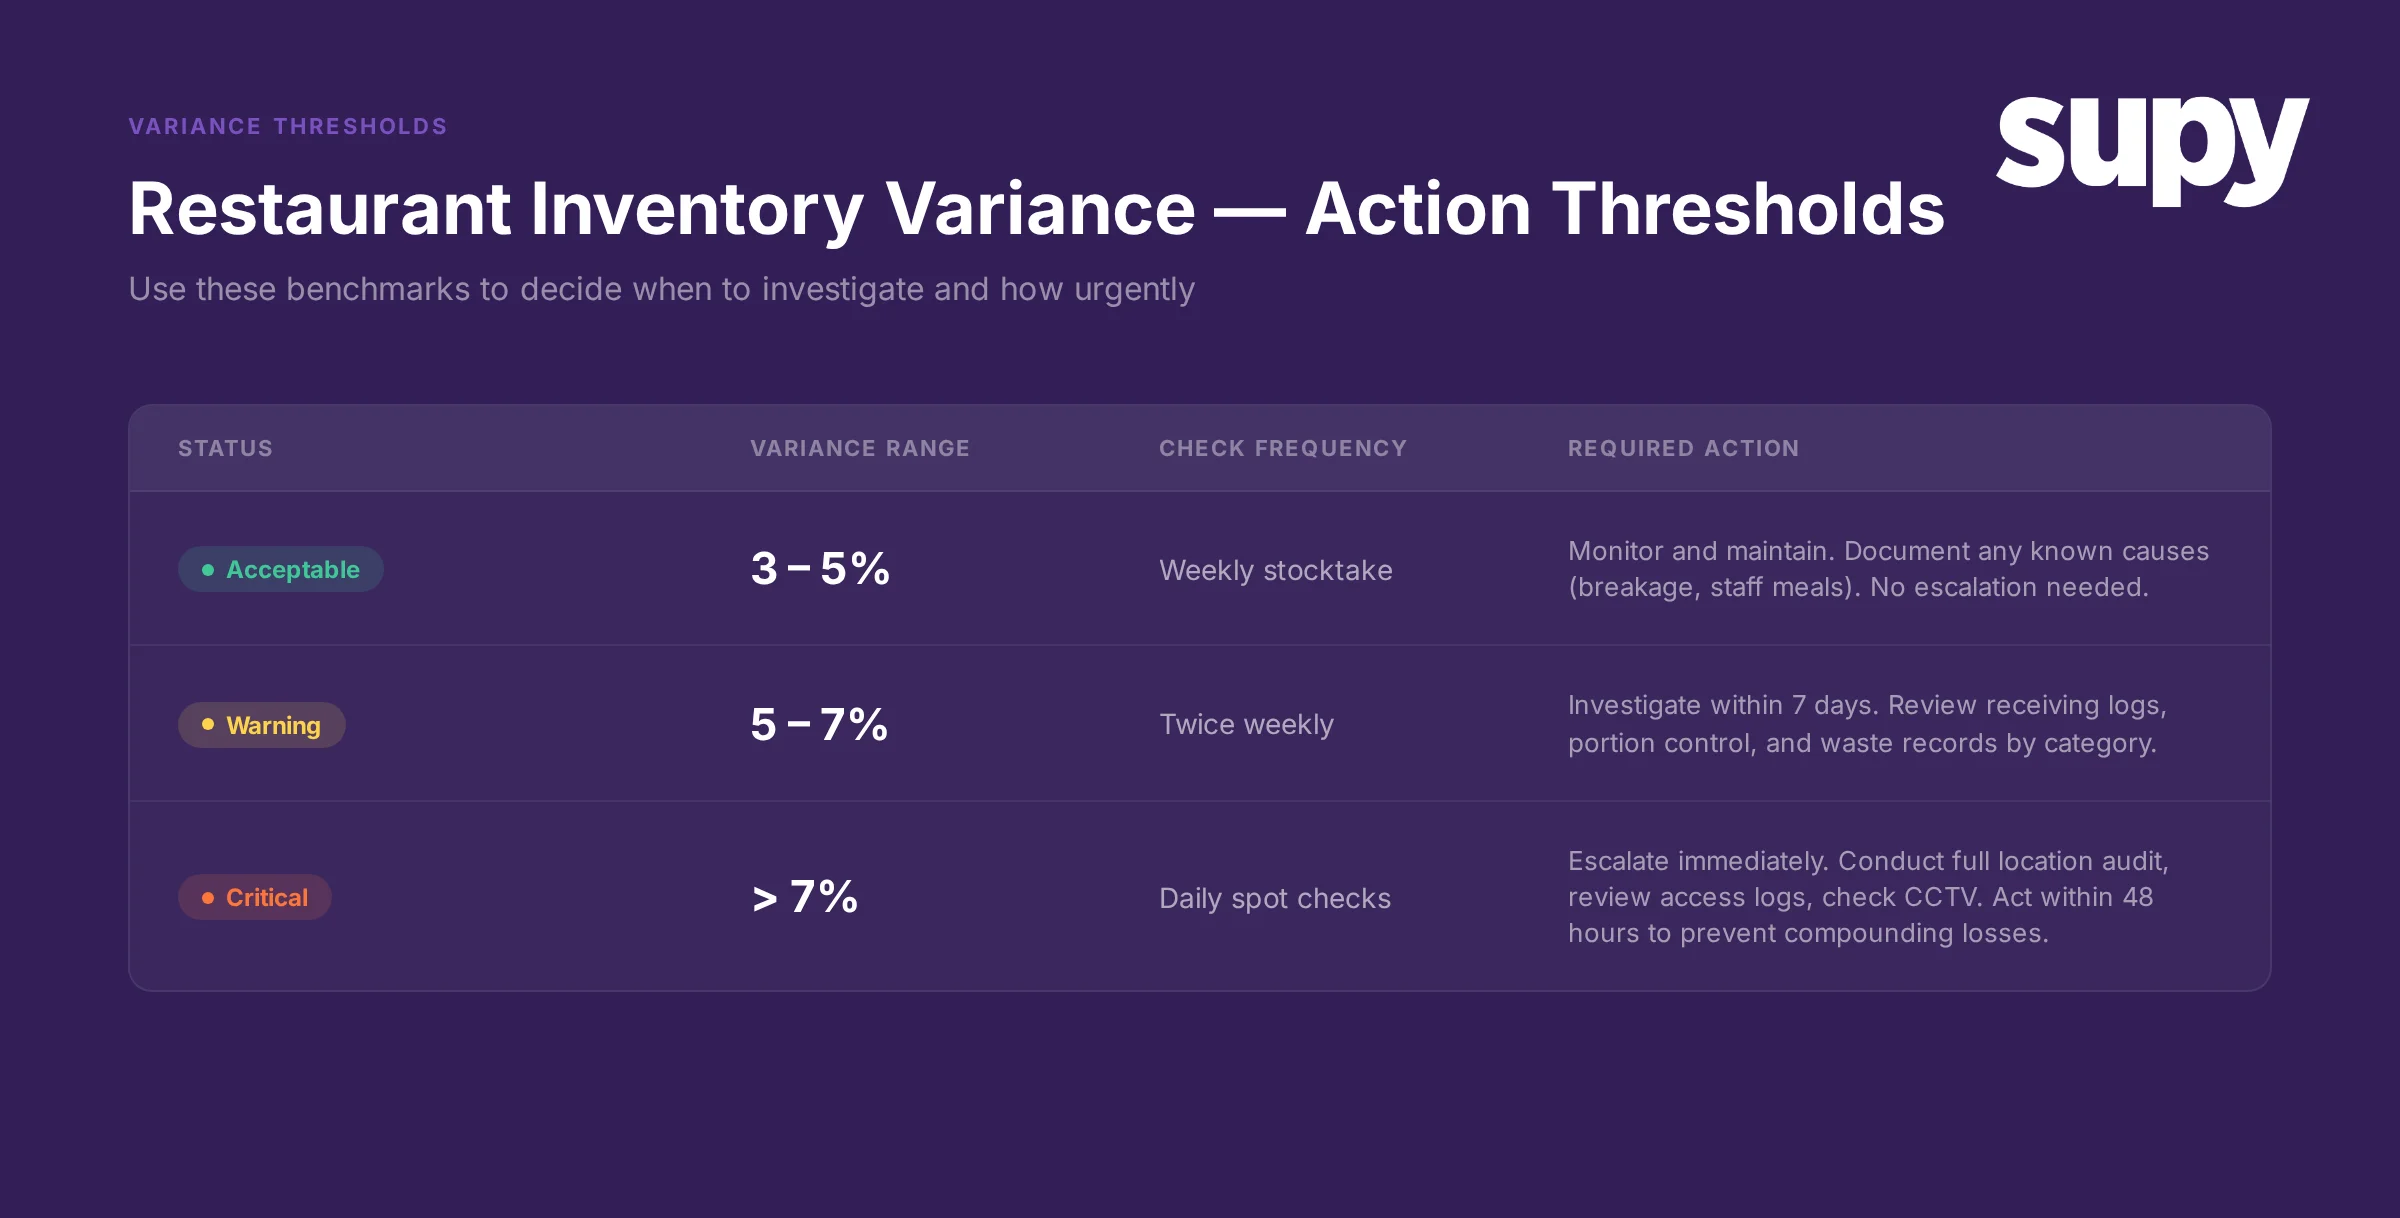
What's healthy? 3-5% variance is acceptable (accounts for rounding, human error, minor shrinkage). Above 7% signals systemic issues - usually overordering, spoilage, or untracked usage. Below 1% suggests either exceptionally tight control or under-counting.
The critical step many operators skip: acting on variance within 7-10 days. Groups with weekly variance audits catch shrinkage patterns within 7-10 days. Those performing monthly audits or relying on year-end counts lose 2-4 weeks of visibility, allowing controllable loss to compound.
Common Inventory Control Mistakes (And How to Avoid Them)
Mistake 1: Treating All Loss the Same
This is the biggest leverage point. Loss breaks into four categories, each requiring a different fix: Spoilage (preventable through storage and rotation) - fix with FIFO, par level discipline, and proper storage. Waste (preventable through process) - fix with portion control training and prep discipline. Counting errors (preventable through systematic counting) - fix with bi-weekly cycle counts. Untracked use or theft (requires investigation) - flag through variance analysis, then investigate.
A multi-unit manager at an 8-site group: "Variance analysis showed us 40% of our loss was waste and spoilage - totally preventable. Once we saw that breakdown, we stopped treating all shrinkage the same and actually fixed the process issues."
Mistake 2: Doing Annual Stocktakes Only
One full physical count per year gives you a single data point. By the time you find a shrinkage problem, it's been happening for months. Bi-weekly cycle counts (counting a subset of inventory, rotating through categories) catch loss as it emerges.
A general manager at a 4-site independent group: "The difference between a full stocktake once a year and bi-weekly cycle counts is night and day. With cycle counts, we catch shrinkage the moment it starts happening. With annual counts, you're six months behind fixing it."
Mistake 3: Not Updating Par Levels Seasonally
Par levels that work in January don't work in July. Usage patterns shift, supplier lead times change, and seasonal items need different targets. Without quarterly reviews, you either overstock (spoilage) or understock (emergency ordering).
Mistake 4: Implementing Software Without Discipline First
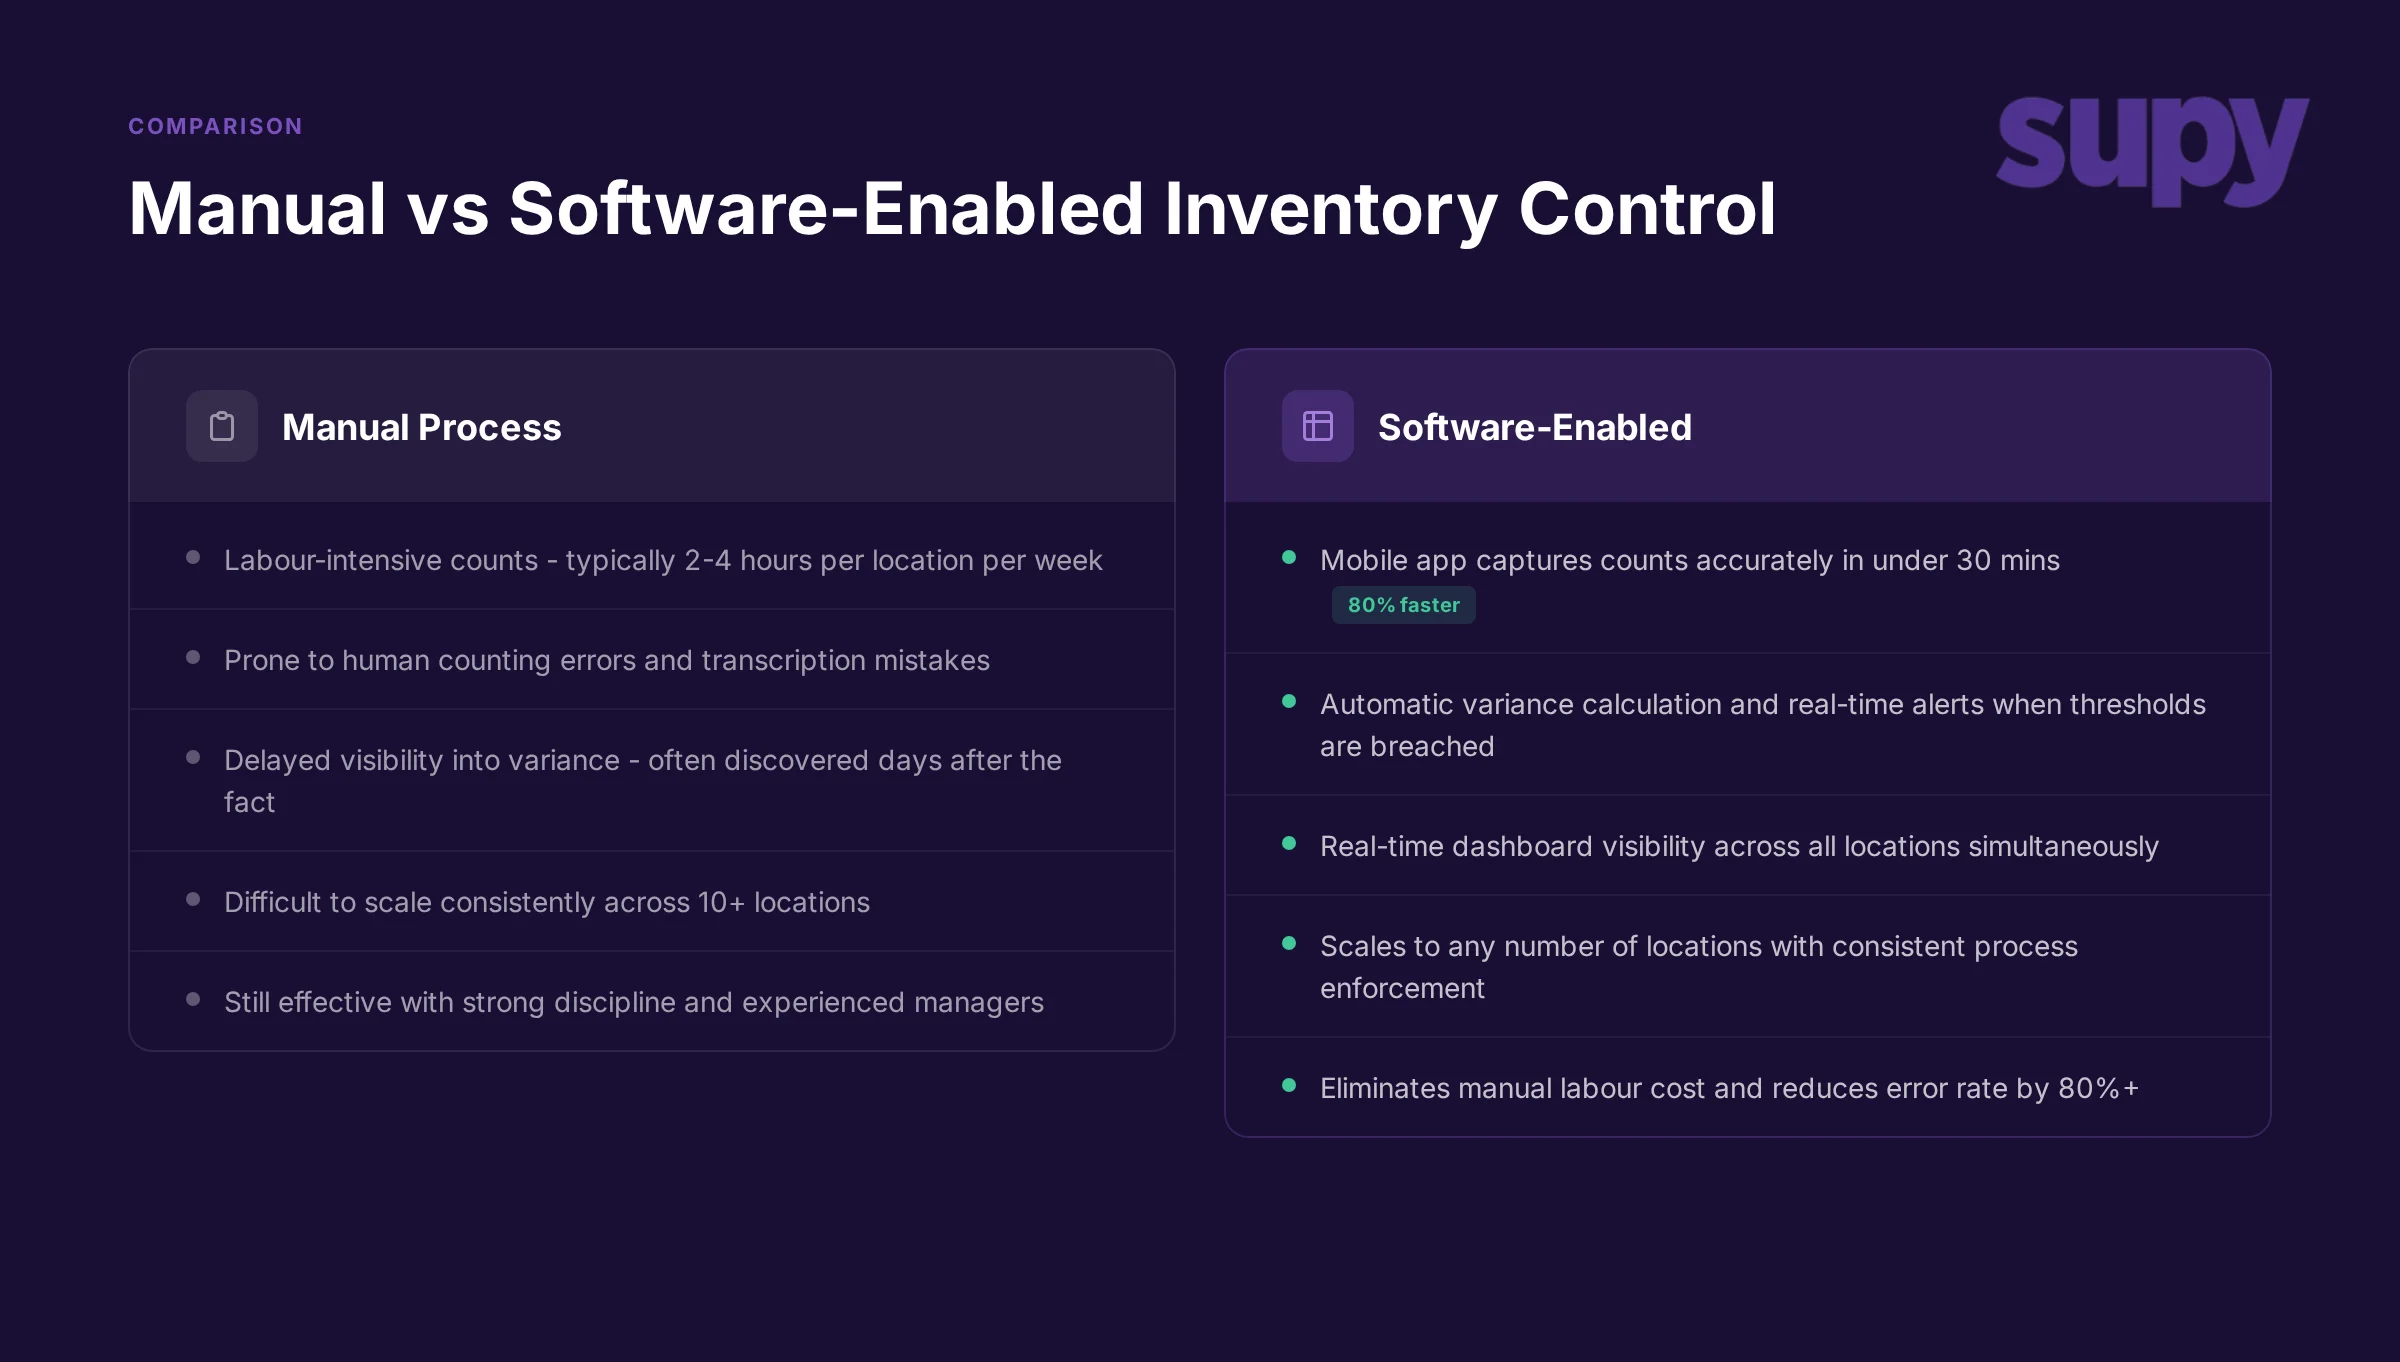
Many groups buy inventory software hoping it will solve the problem. It won't. Software automates discipline - it doesn't create it. A group with poor par level discipline and no variance reviews will still lose money with software; it'll just lose money with better reporting.
The opposite works: a group with tight manual discipline - par levels, weekly variance checks, cycle counts - will see immediate ROI from software because it eliminates labour and error.
Mistake 5: Not Assigning Accountability
Inventory control fails when it's "everyone's job" because it's no one's. Assign one person (or one person per location in a multi-unit) to own par levels, count schedules, and variance reviews. They don't need to do all the counts - they need to ensure they happen.
What Good Inventory Control Looks Like at Multiple Locations
Multi-location groups face an added challenge: variance hides location-level problems. A group running 6% overall variance might have one location at 2% (tight control) and another at 10% (severe loss). Without location-level breakdown, you never fix the outlier.
The multi-location system: centralised par levels (head office sets them, updates quarterly); location-level variance reporting (each location counts and reports weekly, corporate flags outliers); peer accountability (share best practices from high performers); seasonal adjustments (summer/winter/special event par levels pre-set at head office).
Groups using this model report location variance ranging from 3-7% - tight control - rather than the 4-12% chaos of groups without location visibility.
How Supy Handles Inventory Control
Inventory control is foundational to how Supy approaches the restaurant back-of-house. The platform covers it across three layers.
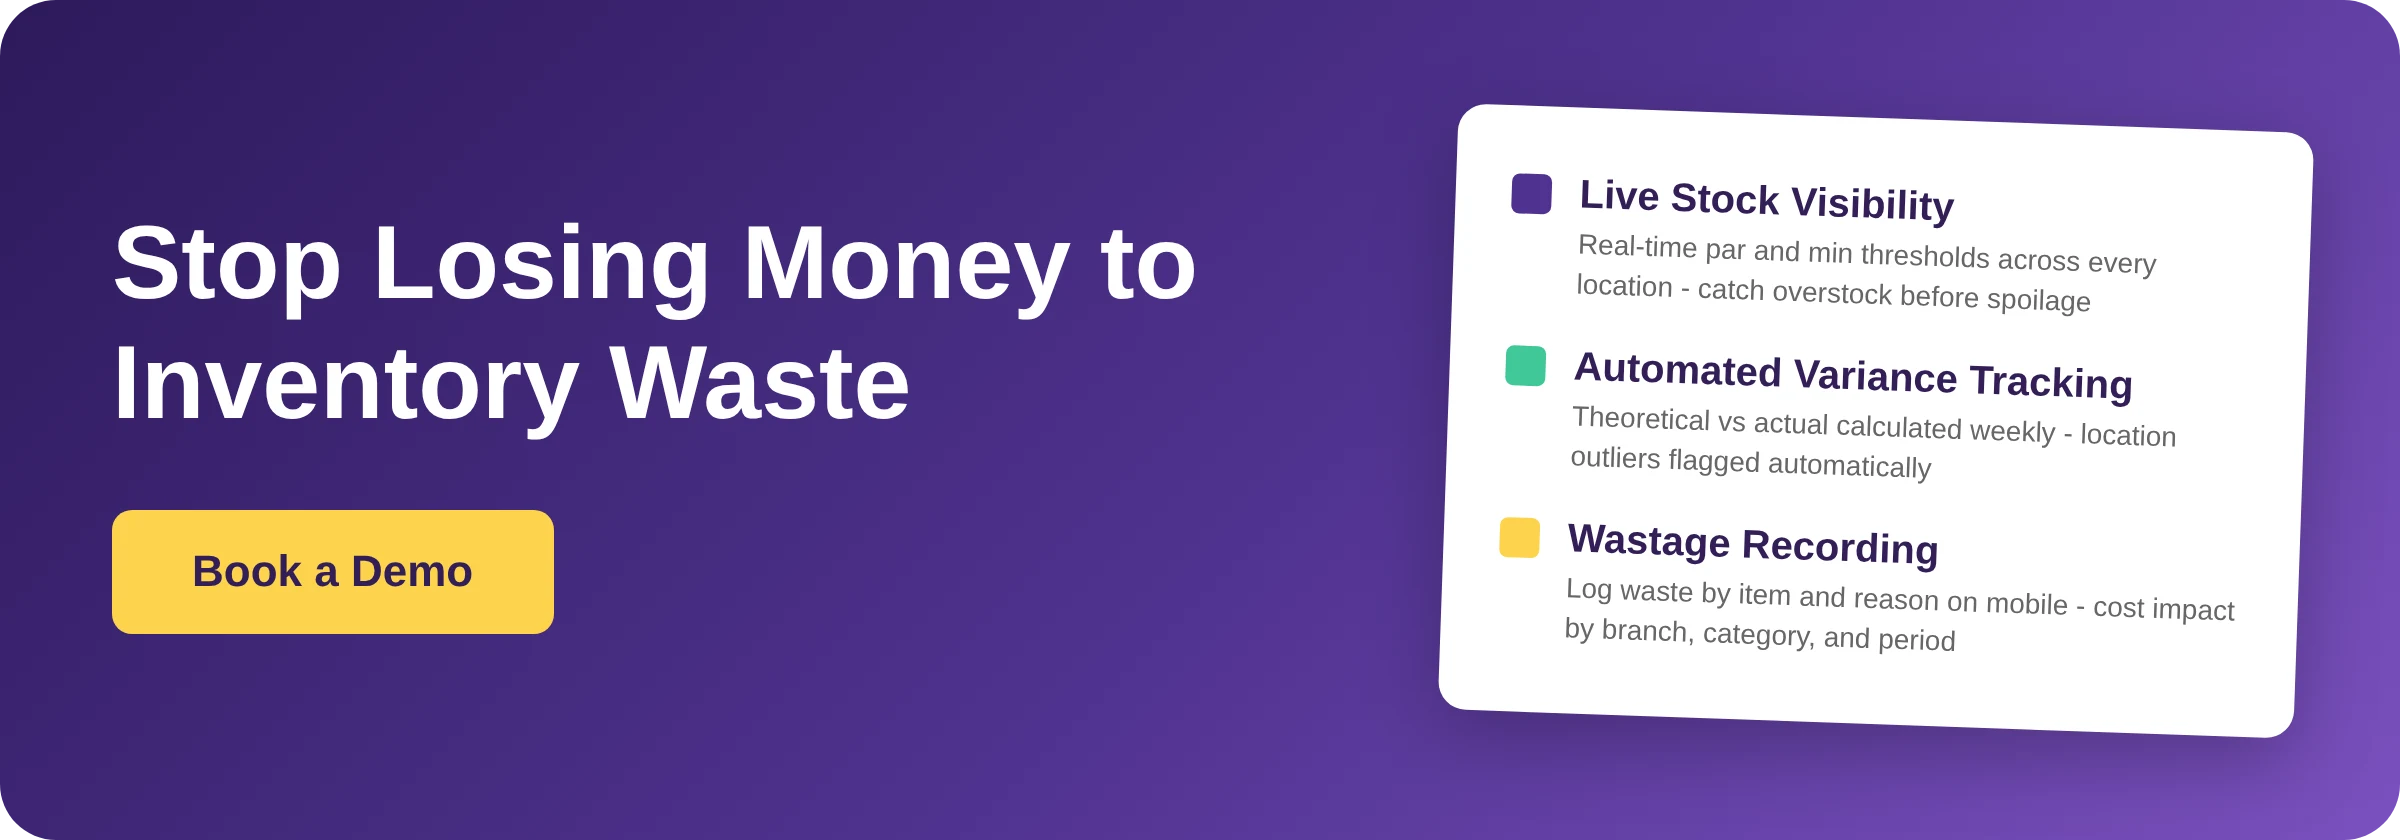
Par level management - Supy lets you set par levels per item per location, then flags when you're above or below par during daily operations. This catches overstocking before spoilage happens and understocking before it becomes an emergency.
Variance tracking and alerting - Weekly variance is calculated automatically. Supy flags locations that exceed your variance threshold (you set it - typically 5-7%) and breaks down variance by category, so you know whether it's spoilage, waste, or shrinkage.
Multi-location inventory visibility - All locations report to a single dashboard. You see par level compliance, variance, and stock levels across your entire operation in real-time. Location managers can't hide problems - and good performers become visible too.
The payoff: groups moving to Supy's inventory control features typically cut variance from 7-9% to 4-5% within 12 weeks because they go from reactive (annual stocktake discovery) to proactive (weekly variance, daily par checks).