.jpg)


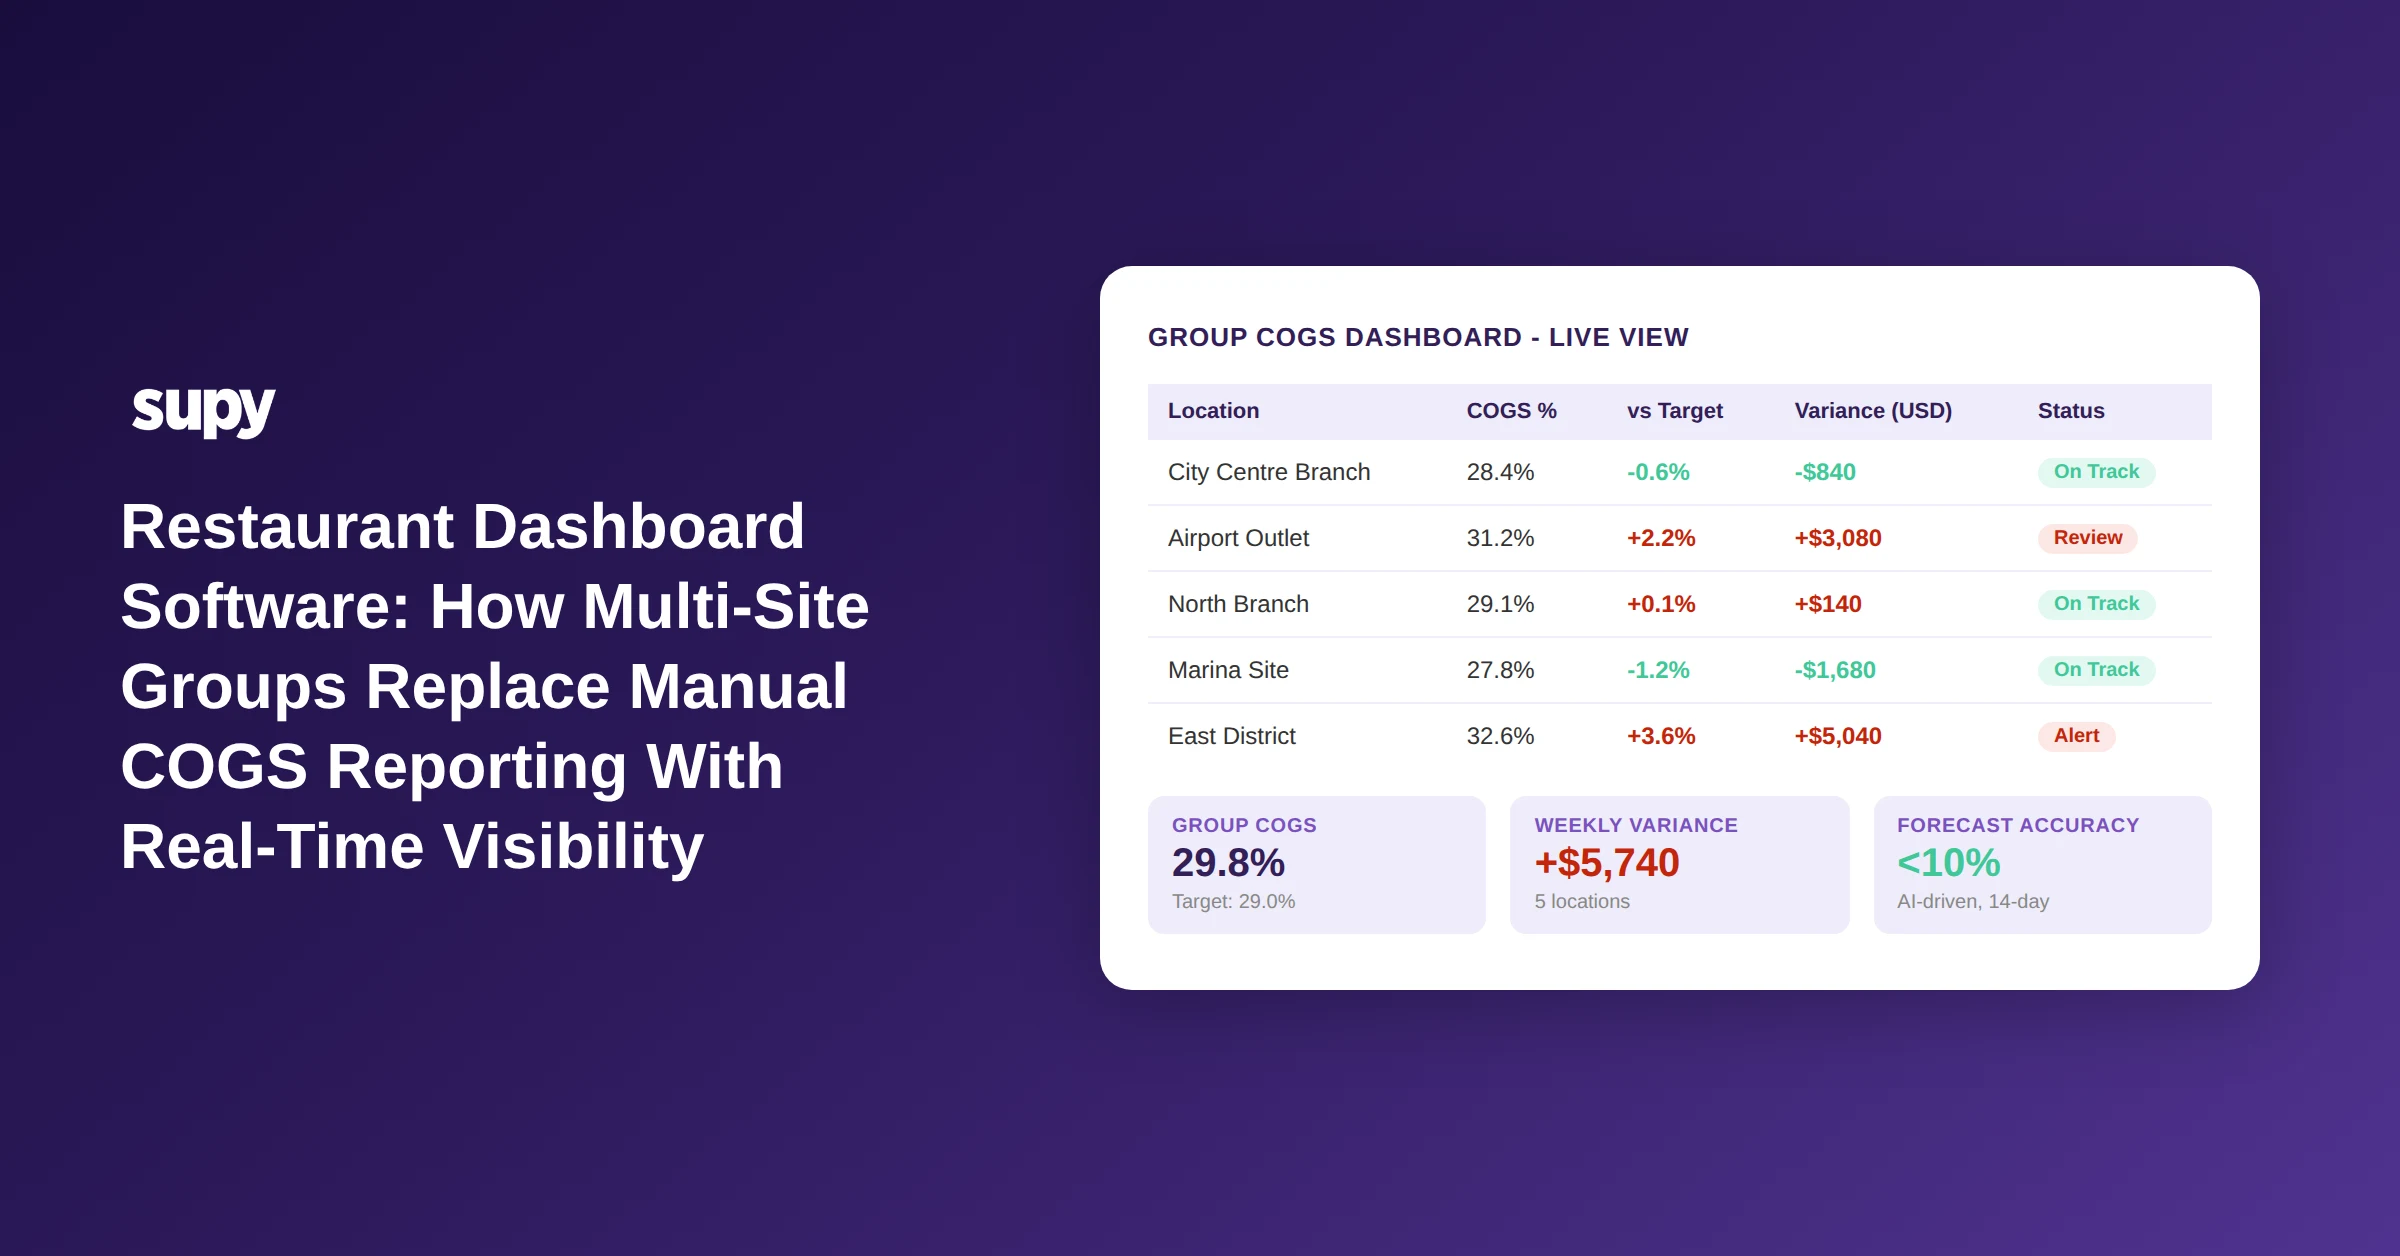
Restaurant Dashboard Software: How Multi-Site Groups Replace Manual COGS Reporting With Real-Time Visibility
What Restaurant Dashboard Software Does - and Why Single-Site Tools Fall Short
Multi-location restaurant operators who move from manual cost tracking to a unified restaurant dashboard software platform typically recover between 4 and 8 percent of annual revenue - revenue that was previously leaking through undetected food cost variances, slow inventory turns, and weekly reporting cycles that arrived too late to act on.
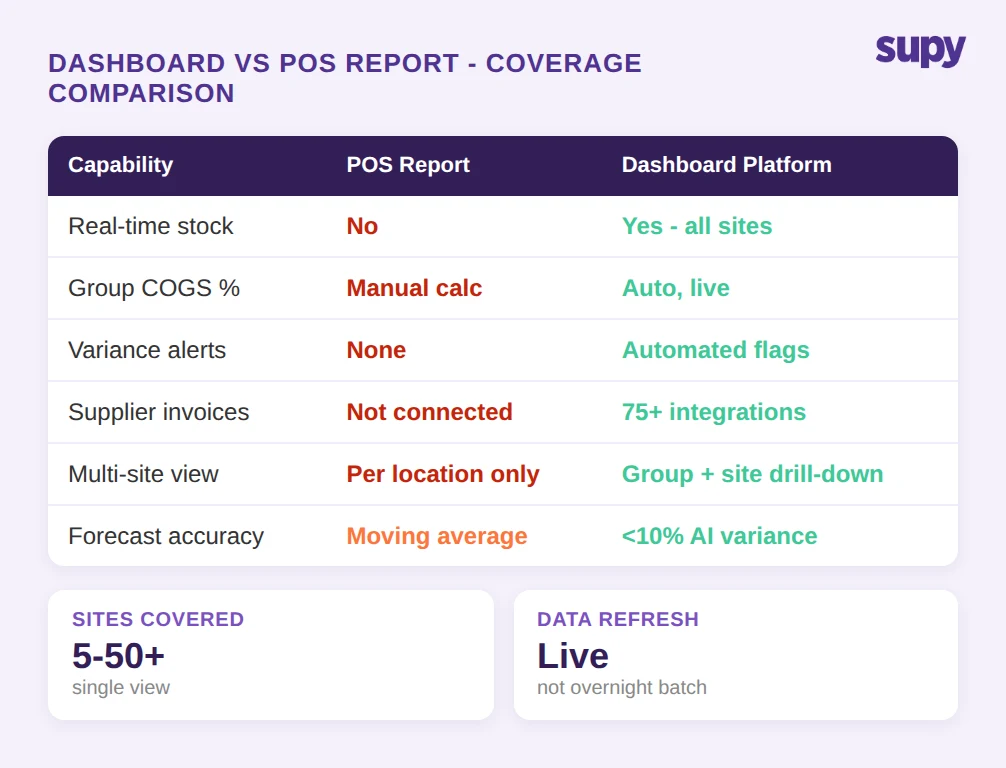
Restaurant dashboard software is a category of operations platform that aggregates purchasing, inventory, sales, and cost data from every location into a single view. For a single-site operator, a POS report or a spreadsheet is often adequate. For a group running five, ten, or twenty sites, the reporting model breaks: each location generates its own data, managers reconcile figures in separate files, and the finance team spends hours each week building a picture that is already out of date by the time it is shared.
The core promise of a restaurant dashboard platform is not just consolidation - it is the ability to detect a problem at one site on a Tuesday morning before it compounds through the rest of the week. That means real-time data flows from POS, supplier invoices, and stock counts, surfaced in a single interface that a head of ops can read without opening a spreadsheet.
A head of operations at a 5-location QSR group identified real-time inventory visibility across all sites from a single view as the number one requirement when evaluating any new dashboard or inventory software. That framing - one view, live data, every site - is the baseline expectation you should hold any platform to.
What to ask in a demo: Can the platform show me stock-on-hand and cost-of-goods-sold percentage for every location simultaneously, updated in real time from my POS and supplier data, on a single screen?
The Cost of Manual Variance Reporting
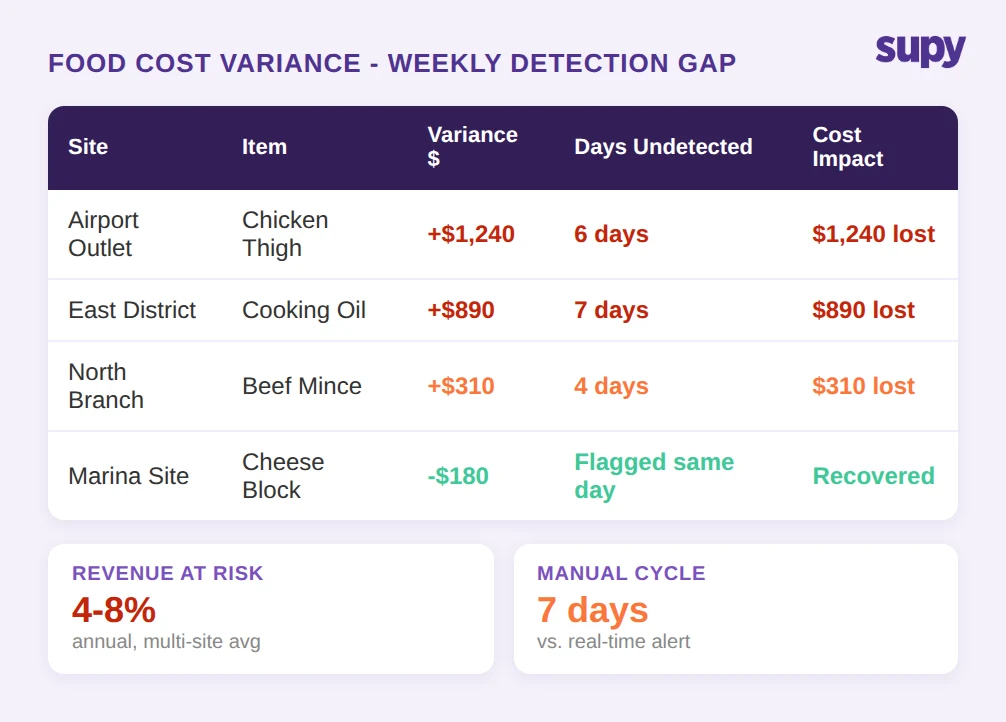
Food cost variance is the gap between what your recipes say you should have used and what your stock counts say you actually used. In a single-site operation, a weekly stock count catches most of it. Across multiple locations, the maths compounds fast.
Industry data indicates that 4 to 8 percent of annual revenue is lost to undetected food cost variances in multi-location groups. On a group turning $1.75 million per year across five sites, that is $70,000 to $140,000 in avoidable losses - and the window to recover them closes every week that manual reporting runs late.
The operational pattern is consistent: a manager at one location notices a high-variance week, sends an email to the ops team, and the figure is logged. But the logging happens days after the variance started, by which point the overage has repeated several times. Manual monitoring across location emails is the workaround - and it is the reason groups start evaluating restaurant dashboard software in the first place.
A platform that flags high-variance items automatically, per site and per category, closes that window from days to hours. The question is not whether variance detection matters - it is whether the platform you are evaluating detects it fast enough to act on.
What to ask in a demo: Show me how the platform surfaces a high-variance item at a single location. How quickly does the alert appear after a stock count is logged? Can I filter by site, category, and date range?
Real-Time Inventory Visibility Across Every Site
Inventory visibility is the foundation that variance detection, ordering, and cost reporting all sit on. Without a live stock position at each site, every downstream calculation - cost-of-goods-sold percentage, reorder point, waste percentage - is based on a figure that may be hours or days old.
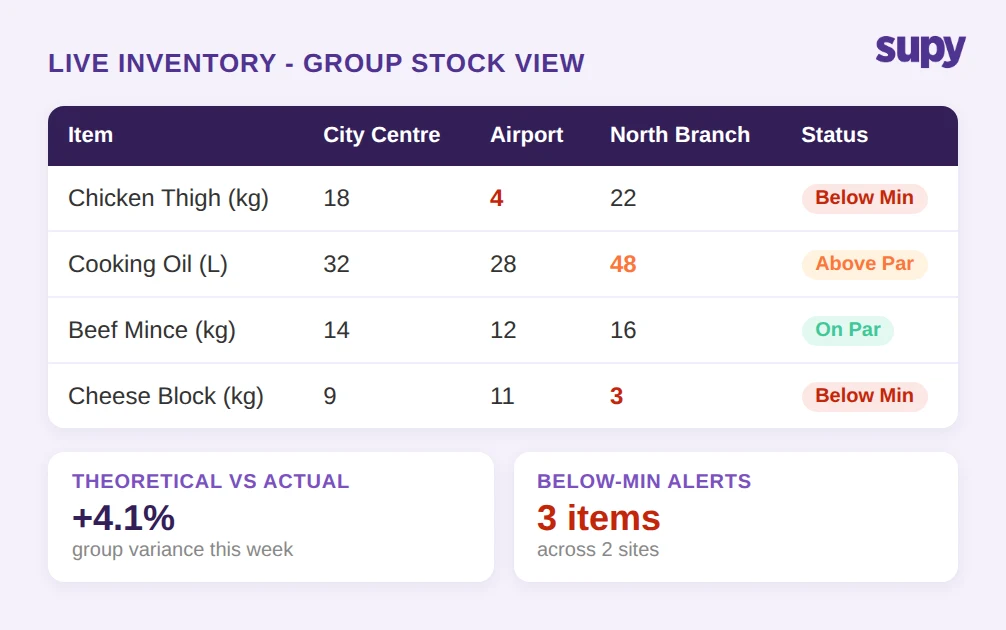
The capability that multi-location operators consistently prioritise is a single view showing stock-on-hand by location and category, updated automatically as stock movements are recorded. That means below-minimum flags appear without a manager having to run a report, and above-par positions - which tie up cash and increase spoilage risk - are equally visible.
The distinction between theoretical and actual stock usage is where the commercial value sits. Theoretical usage is what your recipes say should have been consumed given the sales mix. Actual usage is what stock counts confirm. A platform that surfaces that gap by item, by site, and by time period gives the ops team the data to investigate - whether the cause is waste, over-portioning, theft, or a data entry error.
What to ask in a demo: Walk me through how a stock count at one location updates the group-level inventory view. How does the platform distinguish theoretical versus actual usage, and can I drill down to individual items?
Automated Cost of Goods Sold Reporting
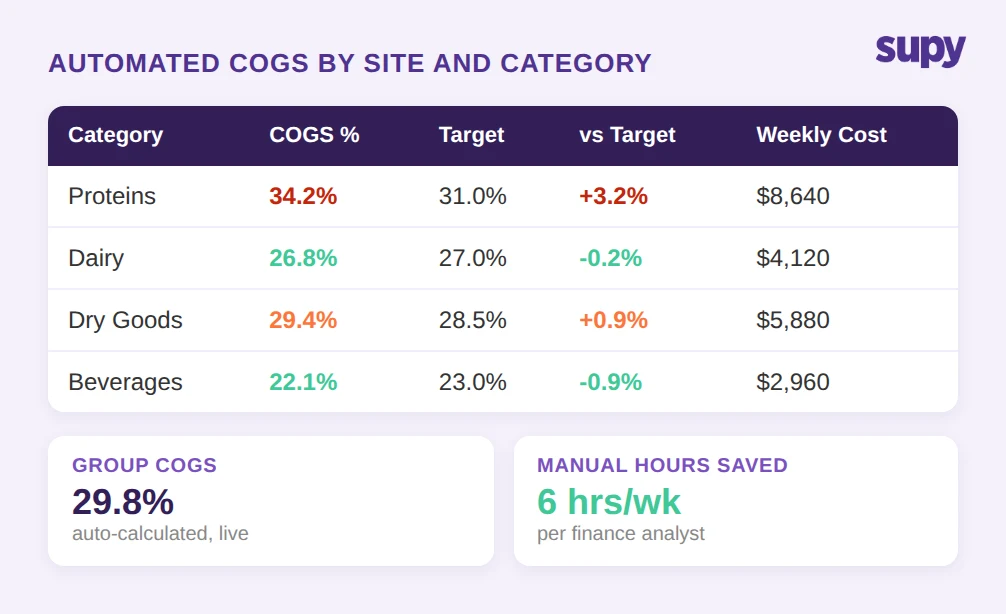
Cost of goods sold is the single most important cost line in a restaurant P&L, and it is also the one that takes the longest to calculate manually. Finance and ops teams at multi-location groups consistently identify manual cost reporting as a recurring pain point: pulling purchase orders, reconciling supplier invoices, adjusting for wastage and transfers, and calculating the percentage against revenue takes hours per week per site.
The automation case for restaurant dashboard software is clearest at this point. A platform that pulls procurement data directly from purchase orders and supplier integrations, adjusts for stock movements and wastage, and calculates cost-of-goods-sold percentage by site, category, and menu item - automatically, on demand - replaces a process that previously required an analyst and a day's work.
The downstream value extends to forecasting: if you know your cost percentage at category level across all sites, you can identify which sites are running above target and investigate before the monthly management accounts are prepared. Groups with automated cost reporting describe the shift as moving from retrospective accounting to active cost management.
What to ask in a demo: Show me how the platform calculates cost-of-goods-sold percentage for each site. Can I see it broken down by menu category? How does it handle wastage adjustments and inter-site stock transfers?
AI Sales Forecasting and What the Accuracy Gap Means for Ordering
Sales forecasting is where the gap between POS-native reporting and a purpose-built restaurant dashboard becomes most measurable. A POS system records what sold. It does not, in most cases, predict what will sell next week with enough accuracy to drive purchasing decisions.
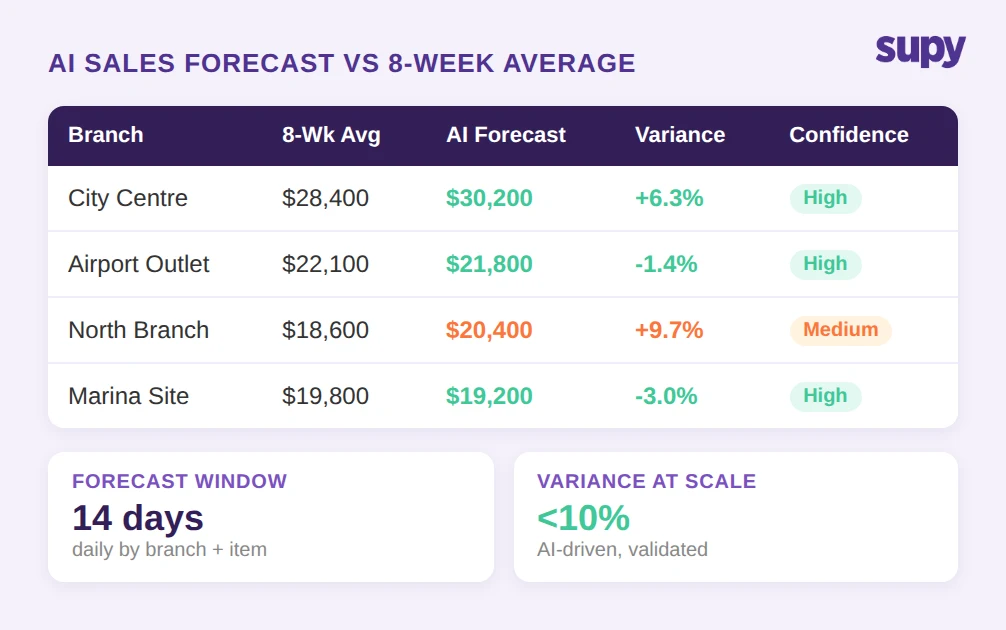
AI-driven forecasting models trained on historical sales, day-of-week patterns, and seasonal signals can deliver materially better accuracy than a manual estimate or a simple moving average. Validated AI sales forecasting at scale has demonstrated under 10 percent variance against actual daily sales by branch - a benchmark that matters because every percentage point of forecast error translates directly into over-ordering, food waste, or stockouts.
The operational application is direct: a forecast accurate to within 10 percent for the next 14 days, broken down to menu item level, gives a central kitchen or procurement team the data to build purchase orders that match demand without buffer stock. That reduces both food cost and waste simultaneously.
The forecasting capability also becomes a planning tool. When a manager can see the 14-day forecast against the 8-week historical average, deviations become visible before the event - a projected high-sales period triggers a procurement review; a quiet period triggers a waste-reduction conversation.
What to ask in a demo: What is the platform's documented forecast accuracy across multi-location groups? Can I see the forecast broken down by branch and by menu item for the next 14 days? How does a manager override a forecast that looks wrong?
Role-Based Access for Franchise and Multi-Entity Structures
Franchise restaurant groups have a structural access requirement that generic dashboard tools consistently fail to meet: each franchise owner or manager should see only their own financial data, while the franchisor's ops team sees everything.
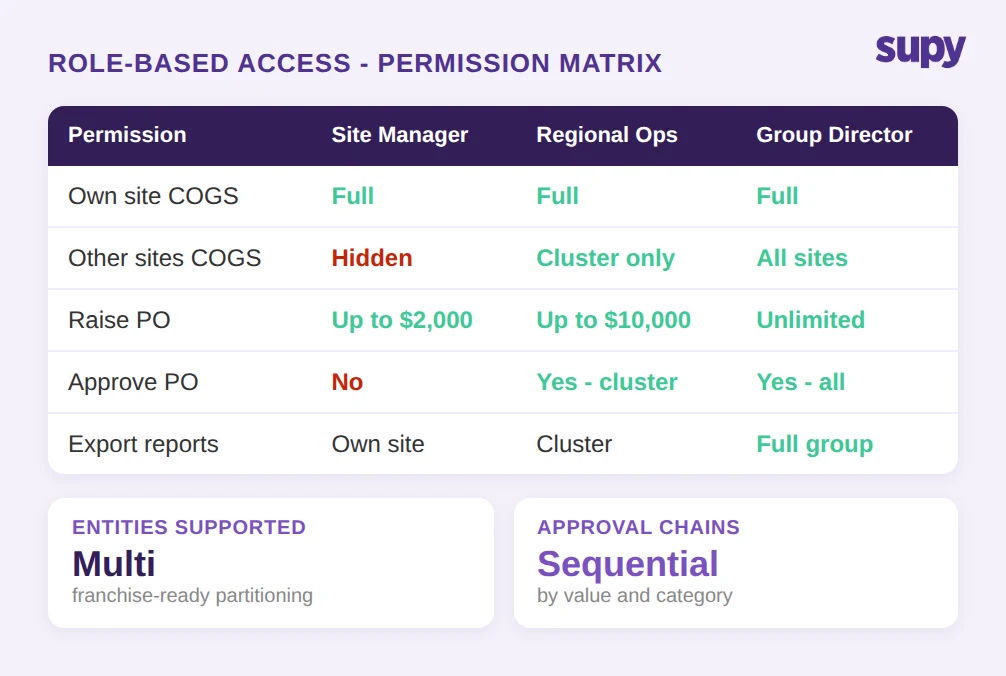
In practice, this means the platform needs to support role-based access at the entity level - not just user-level permissions on a shared dataset, but genuine data partitioning so that a franchise operator in one region cannot view the financial performance of another entity. For groups with investor-level reporting obligations or franchise disclosure requirements, this is a compliance matter, not just a preference.
The same logic applies to approval workflows. A multi-location group that allows every site manager to submit purchase orders without a central review creates cost control exposure. Sequential approval chains - where a site manager creates a purchase order, a regional manager approves it within a value limit, and a central finance team clears anything above threshold - enforce the cost governance that manual processes cannot reliably maintain.
What to ask in a demo: Show me how the platform separates financial data by entity for a franchise structure. How do I configure approval chains with value limits by branch or category? What does a site-level manager see versus a group-level ops director?
How to Evaluate Restaurant Dashboard Software: Four Criteria
Before committing to a platform, apply these four criteria in your evaluation.
Data connectivity. The platform is only as good as its integrations. Confirm it connects natively to your POS system, your supplier catalogue, and your accounting software. A platform with 75 or more live integrations across POS, accounting, ERP, and online ordering systems will cover most stacks without custom development. Ask for a specific confirmation of your POS provider before shortlisting.
Variance detection speed. Ask the vendor to walk you through a variance scenario end-to-end: a stock count is logged at a site showing 15 percent above theoretical usage on a high-cost item. How quickly does that appear in the group dashboard? What triggers an alert, and who receives it? The answer reveals whether the platform is genuinely real-time or whether it batches data overnight.
Forecast accuracy evidence. Generic claims about AI forecasting are not useful. Ask for documented accuracy data from multi-location deployments comparable to your group in terms of site count and cuisine type. Under 10 percent variance against daily actuals is a reasonable benchmark; ask how that figure was calculated and over what period.
Access control granularity. For any group with franchise entities, investor reporting, or separate legal entities per site, the access model is critical. Test it in the demo by creating a hypothetical franchise operator user and confirming what they can and cannot see. Role-based access should extend to approval limits, reporting exports, and purchasing categories.
Supy is a restaurant operations platform built for multi-location groups. The platform includes live cost-of-goods-sold and food-cost-percentage dashboards at group, site, and menu-category level; AI sales forecasting with under 10 percent variance validated at scale across multi-site QSR groups; real-time inventory visibility with theoretical-versus-actual variance tracking; one-click cost-of-goods-sold and procurement reports in Excel or CSV; and role-based access with sequential approval chains for franchise and multi-entity structures. Supy connects to more than 75 live integrations including Foodics, Oracle Micros, Revel, Lightspeed, Square, Clover, Toast, and Eats365. Explore the Supy platform to see how it fits a multi-location group.