.jpg)


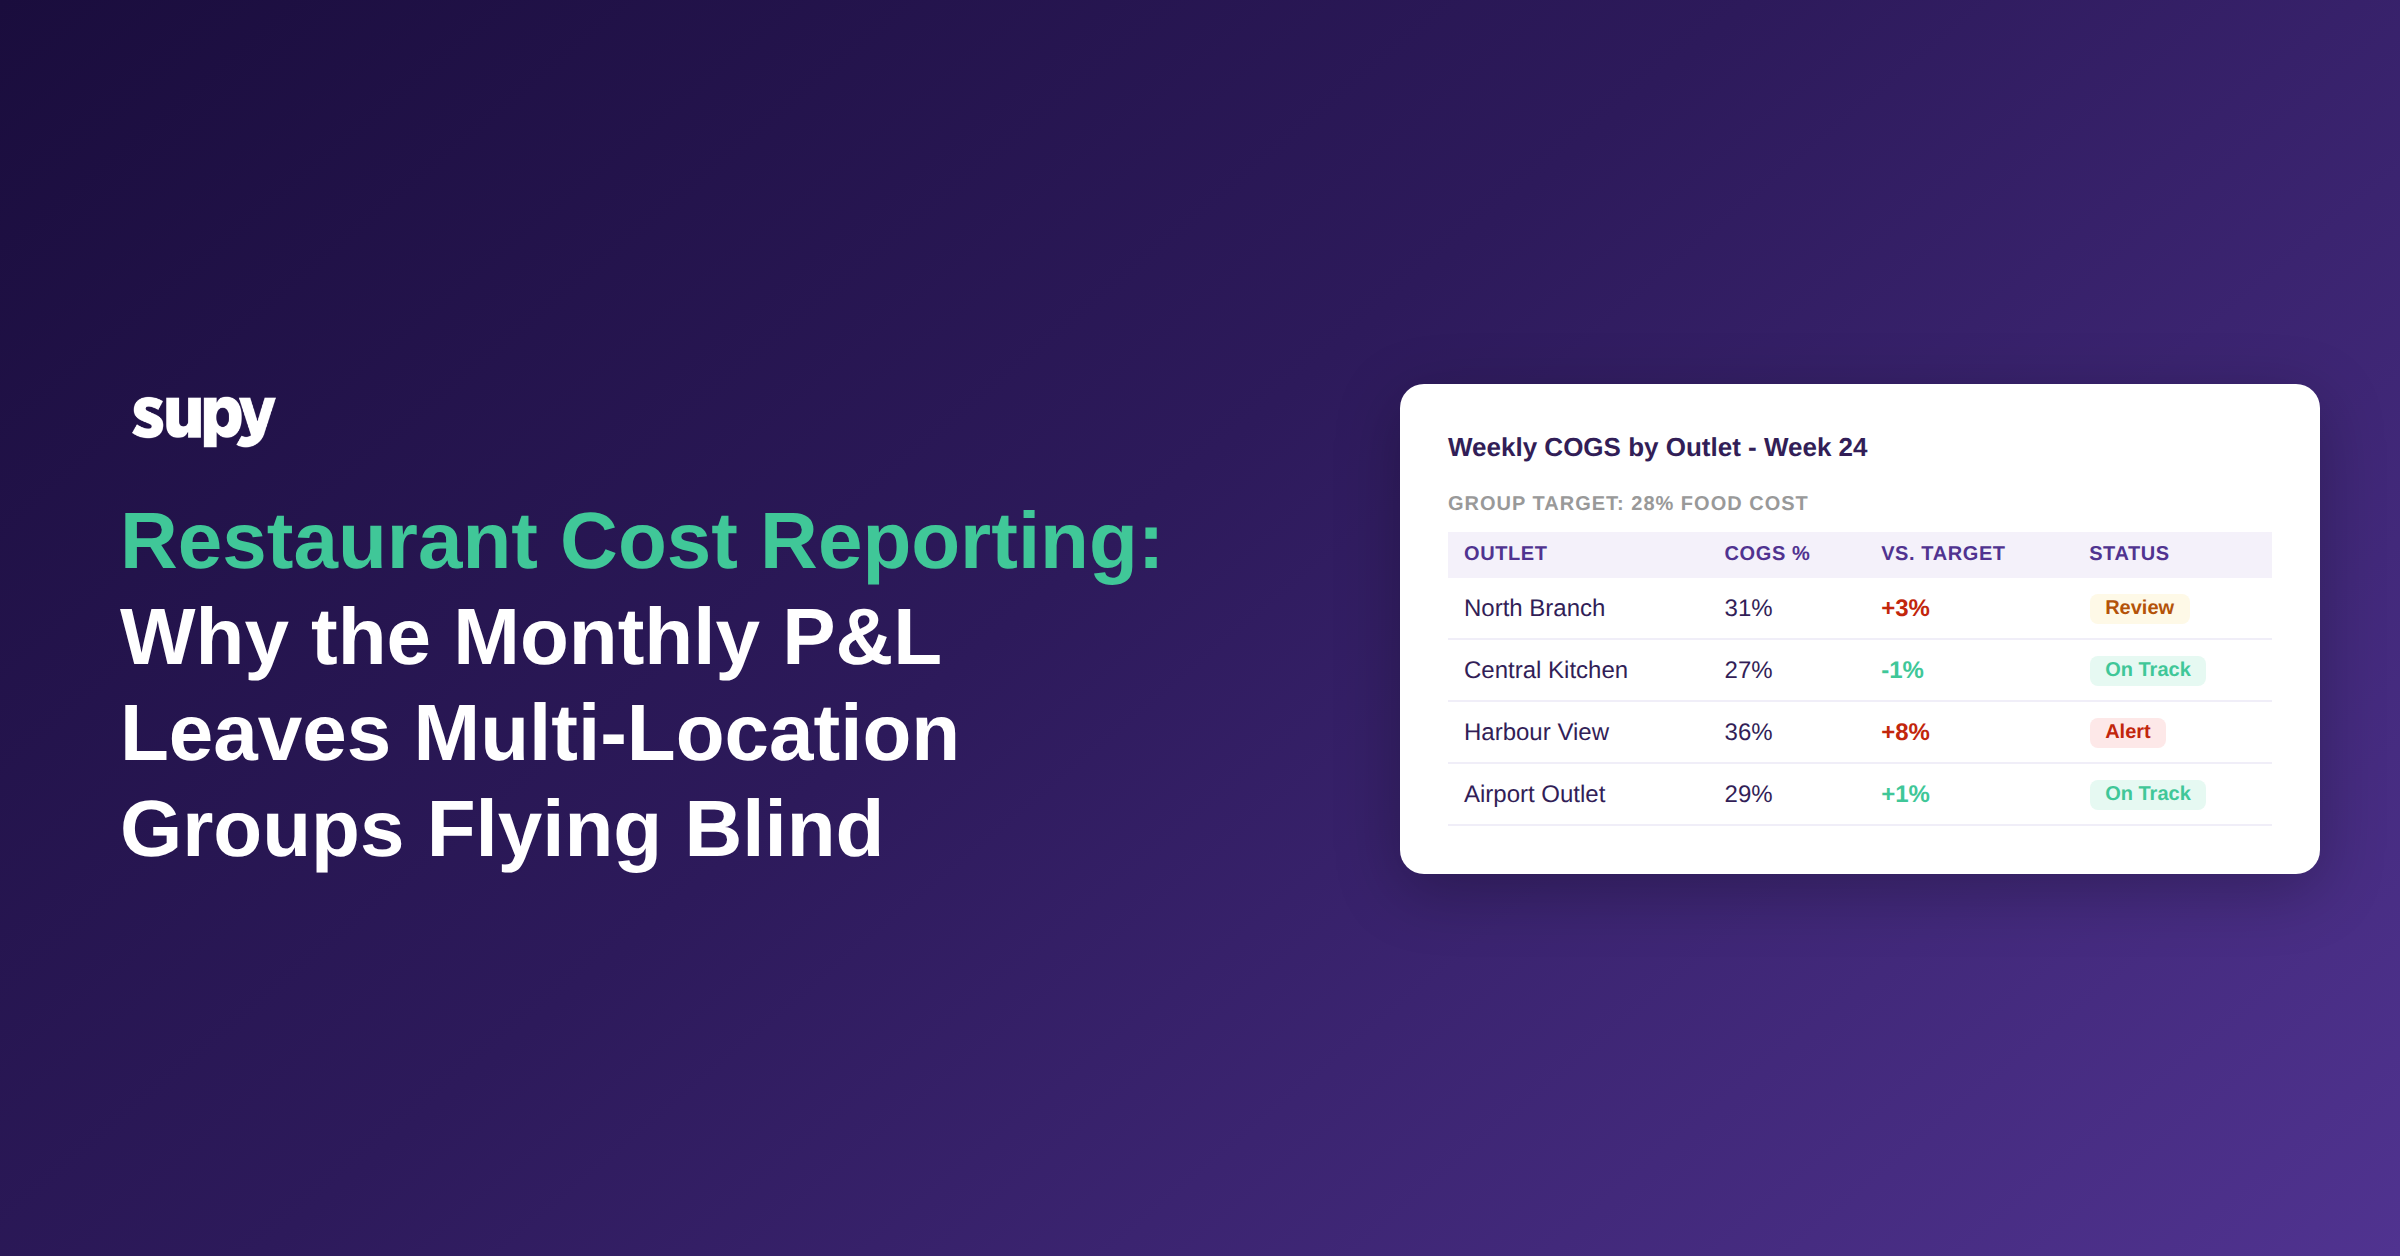
Restaurant Cost Reporting: Why the Monthly P&L Leaves Multi-Location Groups Flying Blind
The P&L Lag Problem: Why Month-End Restaurant Cost Reporting Costs You Twice
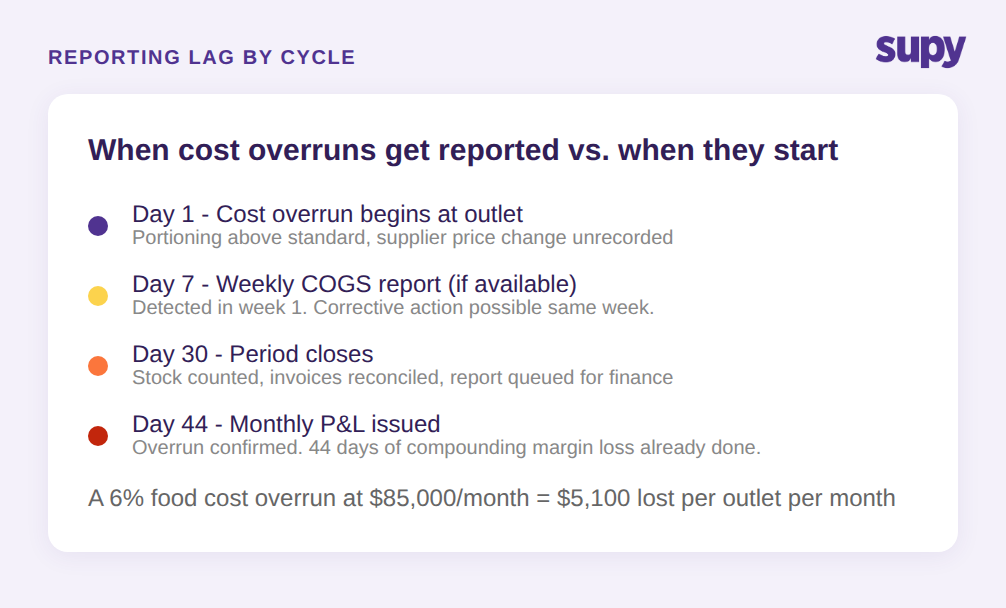
Monthly P&L reporting is the default starting point for most restaurant groups, and it is structurally inadequate for cost control. The cycle works like this: trading happens, invoices are processed, stock is counted at period end, and a finance team produces a cost report two to four weeks after the period closes. The operations team receives data describing what happened last month.
By that point, a supplier has already delivered 15 more times. A prep team has run the same over-portioning variance for another four weeks. A beverage category has continued bleeding at the same rate. The P&L confirmed the problem existed - it did not give the team any window to prevent the next cycle of the same loss.
The operators who escape this cycle move to weekly cost reporting cadences, with COGS percentage published per venue every Monday before the morning briefing. When a site is running 8 percentage points above target, the operations manager knows it in week one, not week five.
The question to ask of your current reporting setup: how many days after a trading week ends does a COGS figure appear for each outlet? If the answer is more than seven, the reporting architecture is still working against you.
No Drill-Down: When Aggregate Food Cost Hides the Real Problem
The second layer that most groups are missing is SKU-level and category-level drill-down below the total food cost percentage. A multi-location hospitality group's beverage manager identified the problem precisely: the P&L showed total cost figures with no ability to isolate whether high variance was coming from theft, waste, or over-pouring - let alone which category or item was responsible.
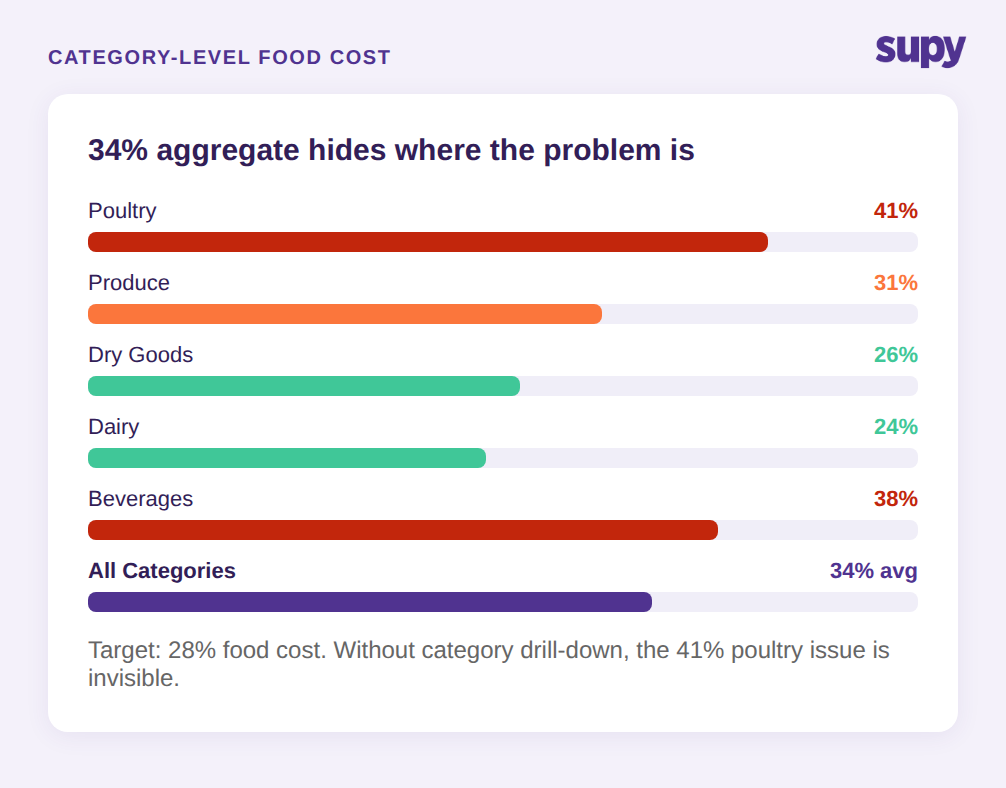
An aggregate food cost percentage of 34% at a site is not an operational signal. It is a flag that says something is wrong. The diagnostic work happens when you can break that 34% into beef at 41%, poultry at 29%, produce at 31%, and beverages at 38% - and then drill further into which specific items in beverages are running highest variance this week versus the same week last month.
Without this layer, operations managers default to intuition and observation. They walk a kitchen and look for visible waste. They ask chefs. They eyeball the fridge. These are not useless - but they are not systematic, they do not scale across eight outlets, and they find the obvious problems while the quiet, steady losses continue undetected.
Group-level restaurant cost reporting needs category and SKU-level breakdowns available on demand, not produced by a finance team in a spreadsheet once a quarter. The infrastructure that makes this possible is recipe-linked inventory tracking, where every sale automatically depletes the correct ingredients from stock - which is what generates the theoretical baseline the variance report is measured against.
The Data Infrastructure Problem: Five Inputs That Cost Reports Depend On
Here is the part most content about restaurant cost reporting skips: the report layer is entirely dependent on the data layer underneath it. If those inputs are incomplete, manual, or inconsistent, no reporting tool produces trustworthy output.
One multi-location group with no dedicated back-of-house software found it was operationally impossible to produce any cost report beyond a basic P&L, because the five prerequisite inputs were all missing. Another group ran all inventory and procurement processes in custom spreadsheets - theoretical versus actual variance analysis was practically impossible without structured data capture at every step.
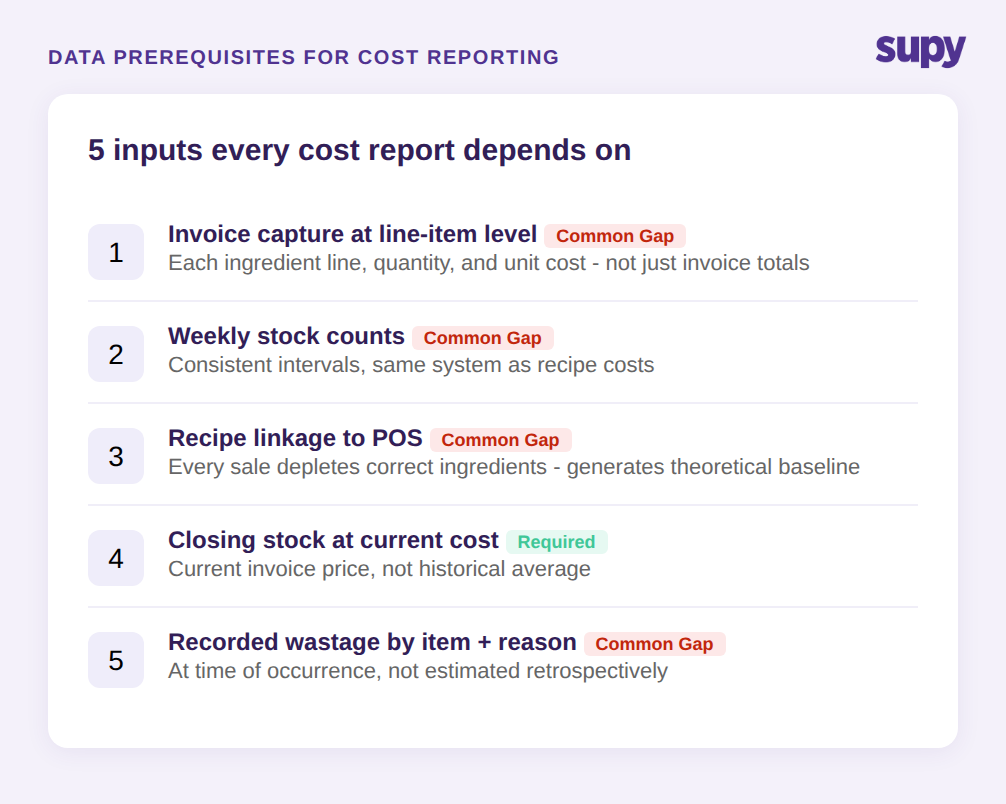
The five data inputs restaurant cost reporting depends on are:
1. Invoice capture at line-item level. Every supplier invoice must be captured with individual line items, quantities, and unit prices - not just total invoice value. Without this, ingredient-level COGS calculations cannot be built. AI invoice scanning tools can automate this step for groups receiving 50+ invoices per week, extracting and matching line items across inconsistent supplier formats.
2. Structured stock counts at consistent intervals. Opening and closing stock must be counted on a defined schedule (weekly is the minimum for meaningful variance reporting) and entered into the same system that holds your recipe costs. Ad-hoc counting in separate spreadsheets breaks the variance calculation.
3. Recipe linkage to POS sales. Each menu item must have a costed recipe that links to the POS item, so every sale automatically depletes the correct ingredients. Without this link, there is no theoretical usage baseline - and without a theoretical baseline, variance reporting is impossible.
4. Closing stock valuation. Stock on hand at the end of each period must be valued at current cost, not historical average. Supplier price changes that are not reflected in closing stock valuation produce COGS figures that are slightly wrong every period and significantly wrong over quarters.
5. Wastage recording. Waste must be logged by item, quantity, and reason at the time it occurs, not estimated retrospectively. Unrecorded wastage sits inside the variance as unexplained loss - it inflates the apparent shrinkage figure and makes the data unreliable for any decision about portioning, prep quantities, or ordering.
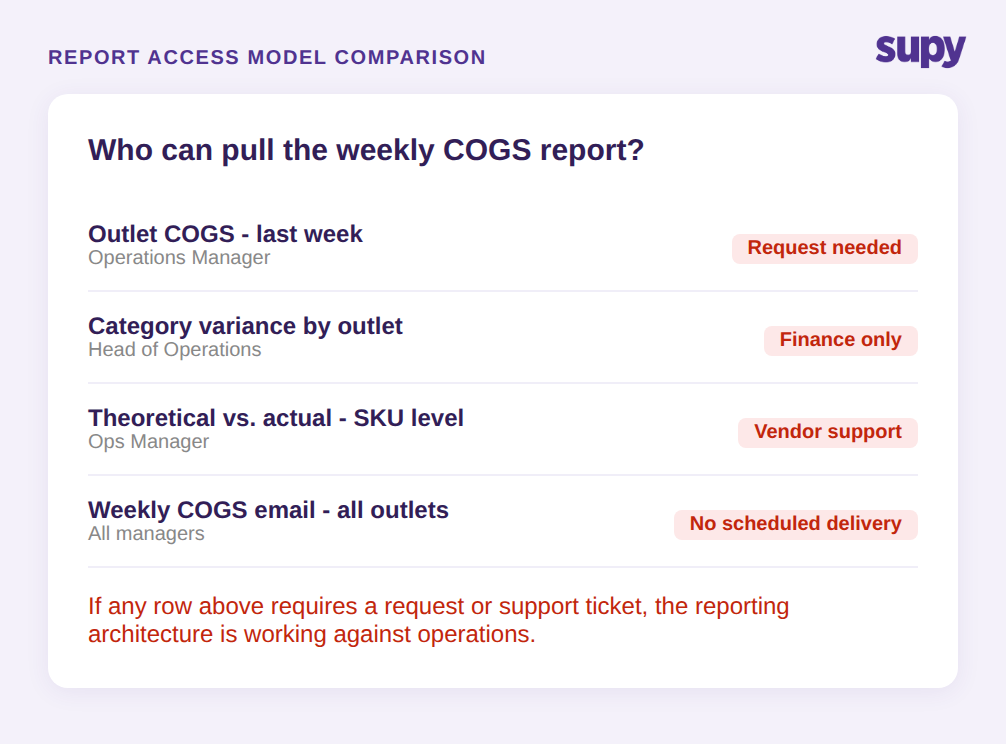
The question to pressure-test your current setup: can you produce an accurate COGS figure for each outlet for last week, broken down by ingredient category, without requesting a spreadsheet from anyone? If that requires a request-and-wait cycle, one or more of these five inputs is incomplete.
Theoretical vs. Actual Variance: The Report Most Groups Cannot Produce
Theoretical versus actual variance is the most actionable output in restaurant cost reporting, and it is the one most groups cannot produce because it requires all five data inputs from the section above to be working simultaneously.
The theoretical figure answers: given everything that was sold, what should have been used? The actual figure answers: given what was in stock at the start, what was received, and what is in stock now, what was actually used? The gap between them is the variance - and variance breaks down into four identifiable sources: recorded wastage, unrecorded wastage (shrinkage), portioning deviation from recipe standard, and theft.
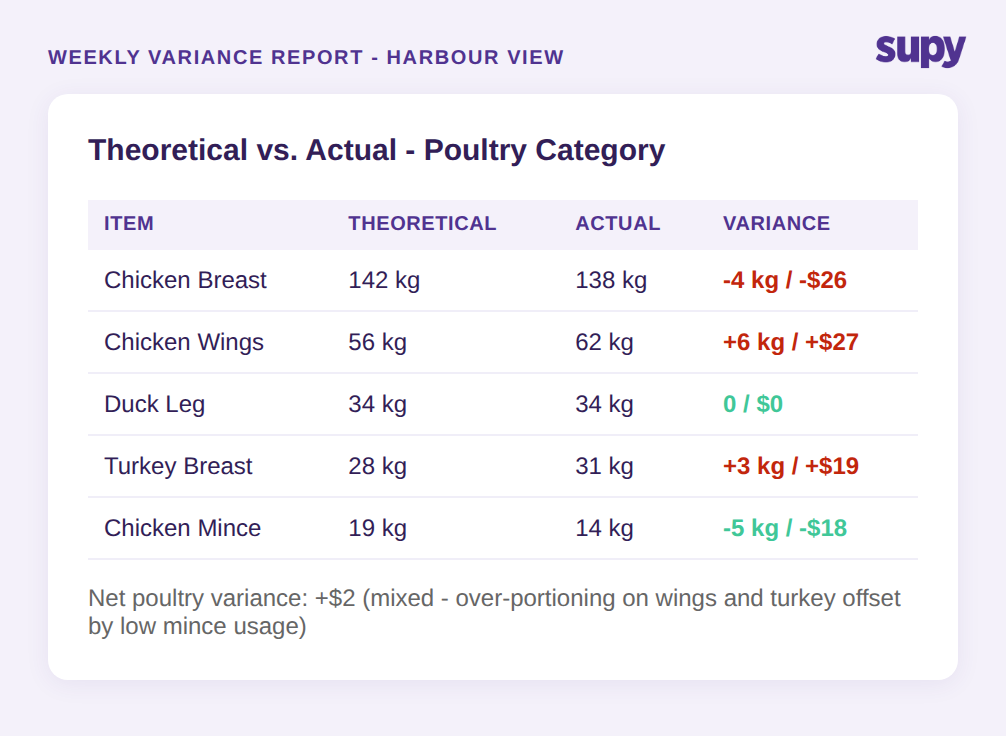
When this report is available weekly, at outlet level, broken down by category, it becomes the primary tool for cost control. A harbour-view outlet running 8 percentage points above target on the poultry category this week is a specific, actionable observation. The operations manager can look at that outlet's wastage log, check the last two weeks of prep records, and ask the kitchen team a specific question. Without the variance report, the same manager is guessing.
For groups running without recipe-linked inventory tracking, producing this report manually for even one outlet takes several hours of spreadsheet work per week. For eight outlets, the manual version is not operationally viable - it exists in theory but is not actually produced.
The realistic path to having this report available weekly, across all outlets, is a system where recipe linkage, stock counts, and invoicing all feed a single platform that calculates theoretical usage automatically from POS sales data. The report then becomes a scheduled output rather than a manual project.
Self-Service Reports: Why Your Cost Data Should Not Require a Support Ticket
The fourth failure mode in restaurant cost reporting is not about data quality - it is about access. A finance director at a multi-location casual dining group flagged the issue directly: GP figures and automated P&L outputs must be self-serviceable without vendor assistance. The requirement that certain reports need vendor support to generate was identified as a non-starter by multiple operations and finance teams evaluating reporting tools.
This matters operationally, not just as a software preference. If a department head needs the COGS breakdown for last week and the process for getting it involves raising a request with a vendor, waiting, receiving a file, and then re-formatting it for the weekly meeting - that process will not happen every week. The report will be produced monthly, at best. The cost control cadence breaks down.
Self-service cost reporting means every metric available in the platform is accessible directly by the operations team, without needing to involve finance, IT, or a software vendor. It means the head of operations can log in at 7am on Monday and see COGS by outlet for the prior week, export it to Excel, and share it in the morning briefing without waiting for anyone.
The related requirement is push-based delivery. Restaurant groups consistently request scheduled weekly email reports with COGS percentage, sales actuals, and theoretical versus actual variances per venue - delivered Monday morning without any manual extraction. Self-service access and automated delivery are not alternatives; they serve different use patterns. The operations manager who wants to investigate a specific variance needs self-service drill-down. The CFO reviewing the weekly cost pack needs the scheduled report to arrive in the inbox.
Building a Reporting Cadence That Works at Group Level
The practical outcome of having all five data inputs working and the reporting layer structured correctly is a reporting cadence that looks different from the standard monthly P&L cycle.
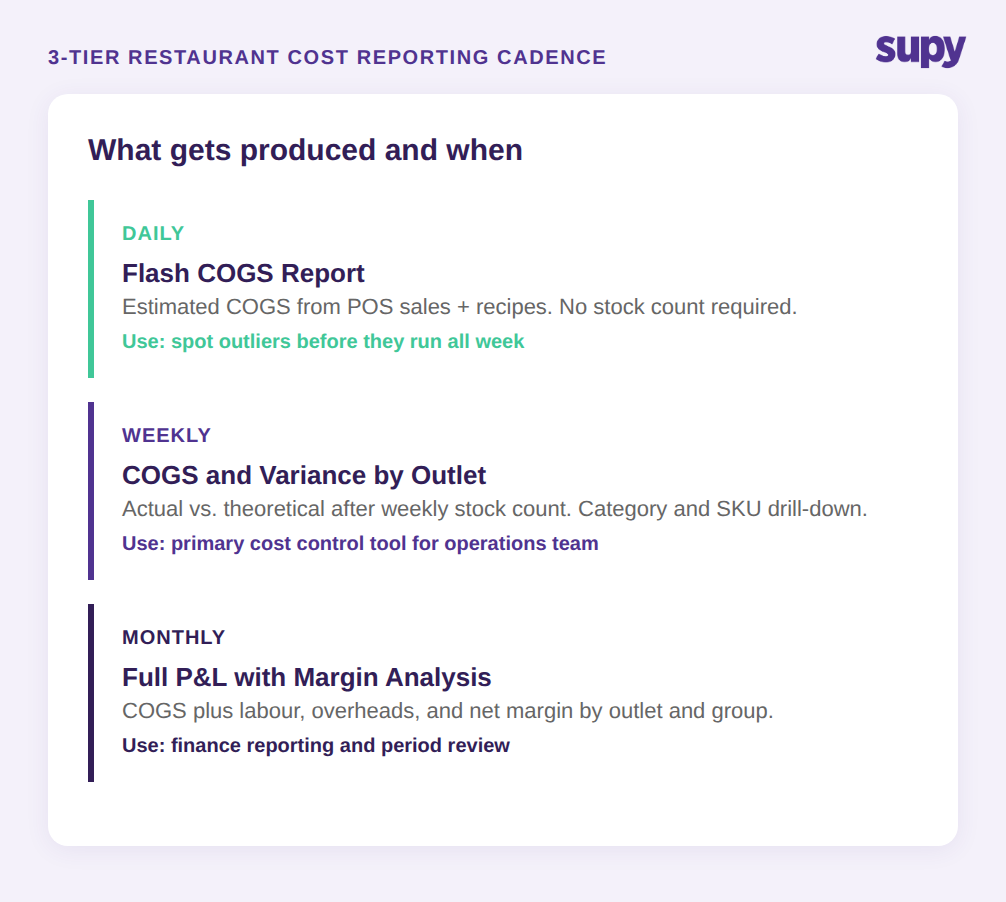
At group level, a workable restaurant cost reporting cadence has three tiers: a daily flash report showing sales actuals and estimated COGS by outlet (useful for spotting outliers early in the week); a weekly COGS and variance report by outlet and category (the primary operational tool for cost control decisions); and a monthly P&L that draws on the same underlying data but extends to full margin analysis, including overheads and labour.
The daily flash can be automated from POS sales data and does not require a stock count - it uses theoretical COGS based on recipes. It is an estimate, not an audit, but it surfaces the outlets running significantly outside their normal cost band early enough to investigate before the week is complete.
The weekly report requires the stock count - which is why the counting cadence matters. Groups that count weekly have the data to produce a weekly COGS report with actual versus theoretical variance. Groups that count monthly can only produce this report once per period, regardless of how good their software is.
At the outlet level, the practical question for any operations manager reviewing these reports is straightforward: which outlets are running above target this week, by how much, and in which categories? That question answered weekly, for every outlet, across every category, is what transforms restaurant cost reporting from a backward-looking accounting exercise into a forward-looking cost control system.
Supy for Restaurant Cost Reporting
Supy's restaurant back-of-house platform connects the five data inputs described above - AI invoice scanning, stock counting, recipe management, wastage recording, and POS integration - into a single system, with live COGS and food cost percentage available at group, site, and menu-category level. Theoretical versus actual variance reports are available on demand by outlet, category, or individual item. Spreadsheet reports export directly to Excel or CSV for finance teams that prefer their own models.
The AI Sales Forecasting feature generates 14-day demand forecasts by branch and menu item, which the Predictive Ordering module uses to build purchase orders based on current stock levels. With 75+ integrations across POS, accounting, and ERP systems, Supy connects to the operational stack most multi-location groups already run.
If your current reporting setup still requires manual extraction, a support request, or a monthly cycle to see outlet-level COGS, that is the gap the platform is built to close.

