.jpg)


What is Restaurant Business Intelligence? A Guide for Operators

What is Restaurant Business Intelligence?
Restaurant business intelligence (BI) is the process of collecting, connecting, and analysing operational data - from your POS, inventory management system, and procurement platform - to give operators a clear, real-time view of how their restaurant group is performing financially and operationally. Unlike basic sales reports, BI surfaces patterns across locations, flags cost variances automatically, and helps you understand not just what happened, but why.
For multi-unit operators, the value is particularly clear: rather than piecing together spreadsheet exports from different systems, a BI platform consolidates your data into dashboards that show restaurant analytics across your entire group at once. The result is faster, better-informed decisions - on everything from supplier contracts to portion sizes.
Why Basic Reporting Is No Longer Enough
Most restaurant operators have some form of reporting. Your POS produces daily sales summaries. Your inventory system tracks stock movements. Your accounts team compiles a monthly P&L. The problem is that these outputs exist in separate systems, reflect historical data, and require manual effort to consolidate.
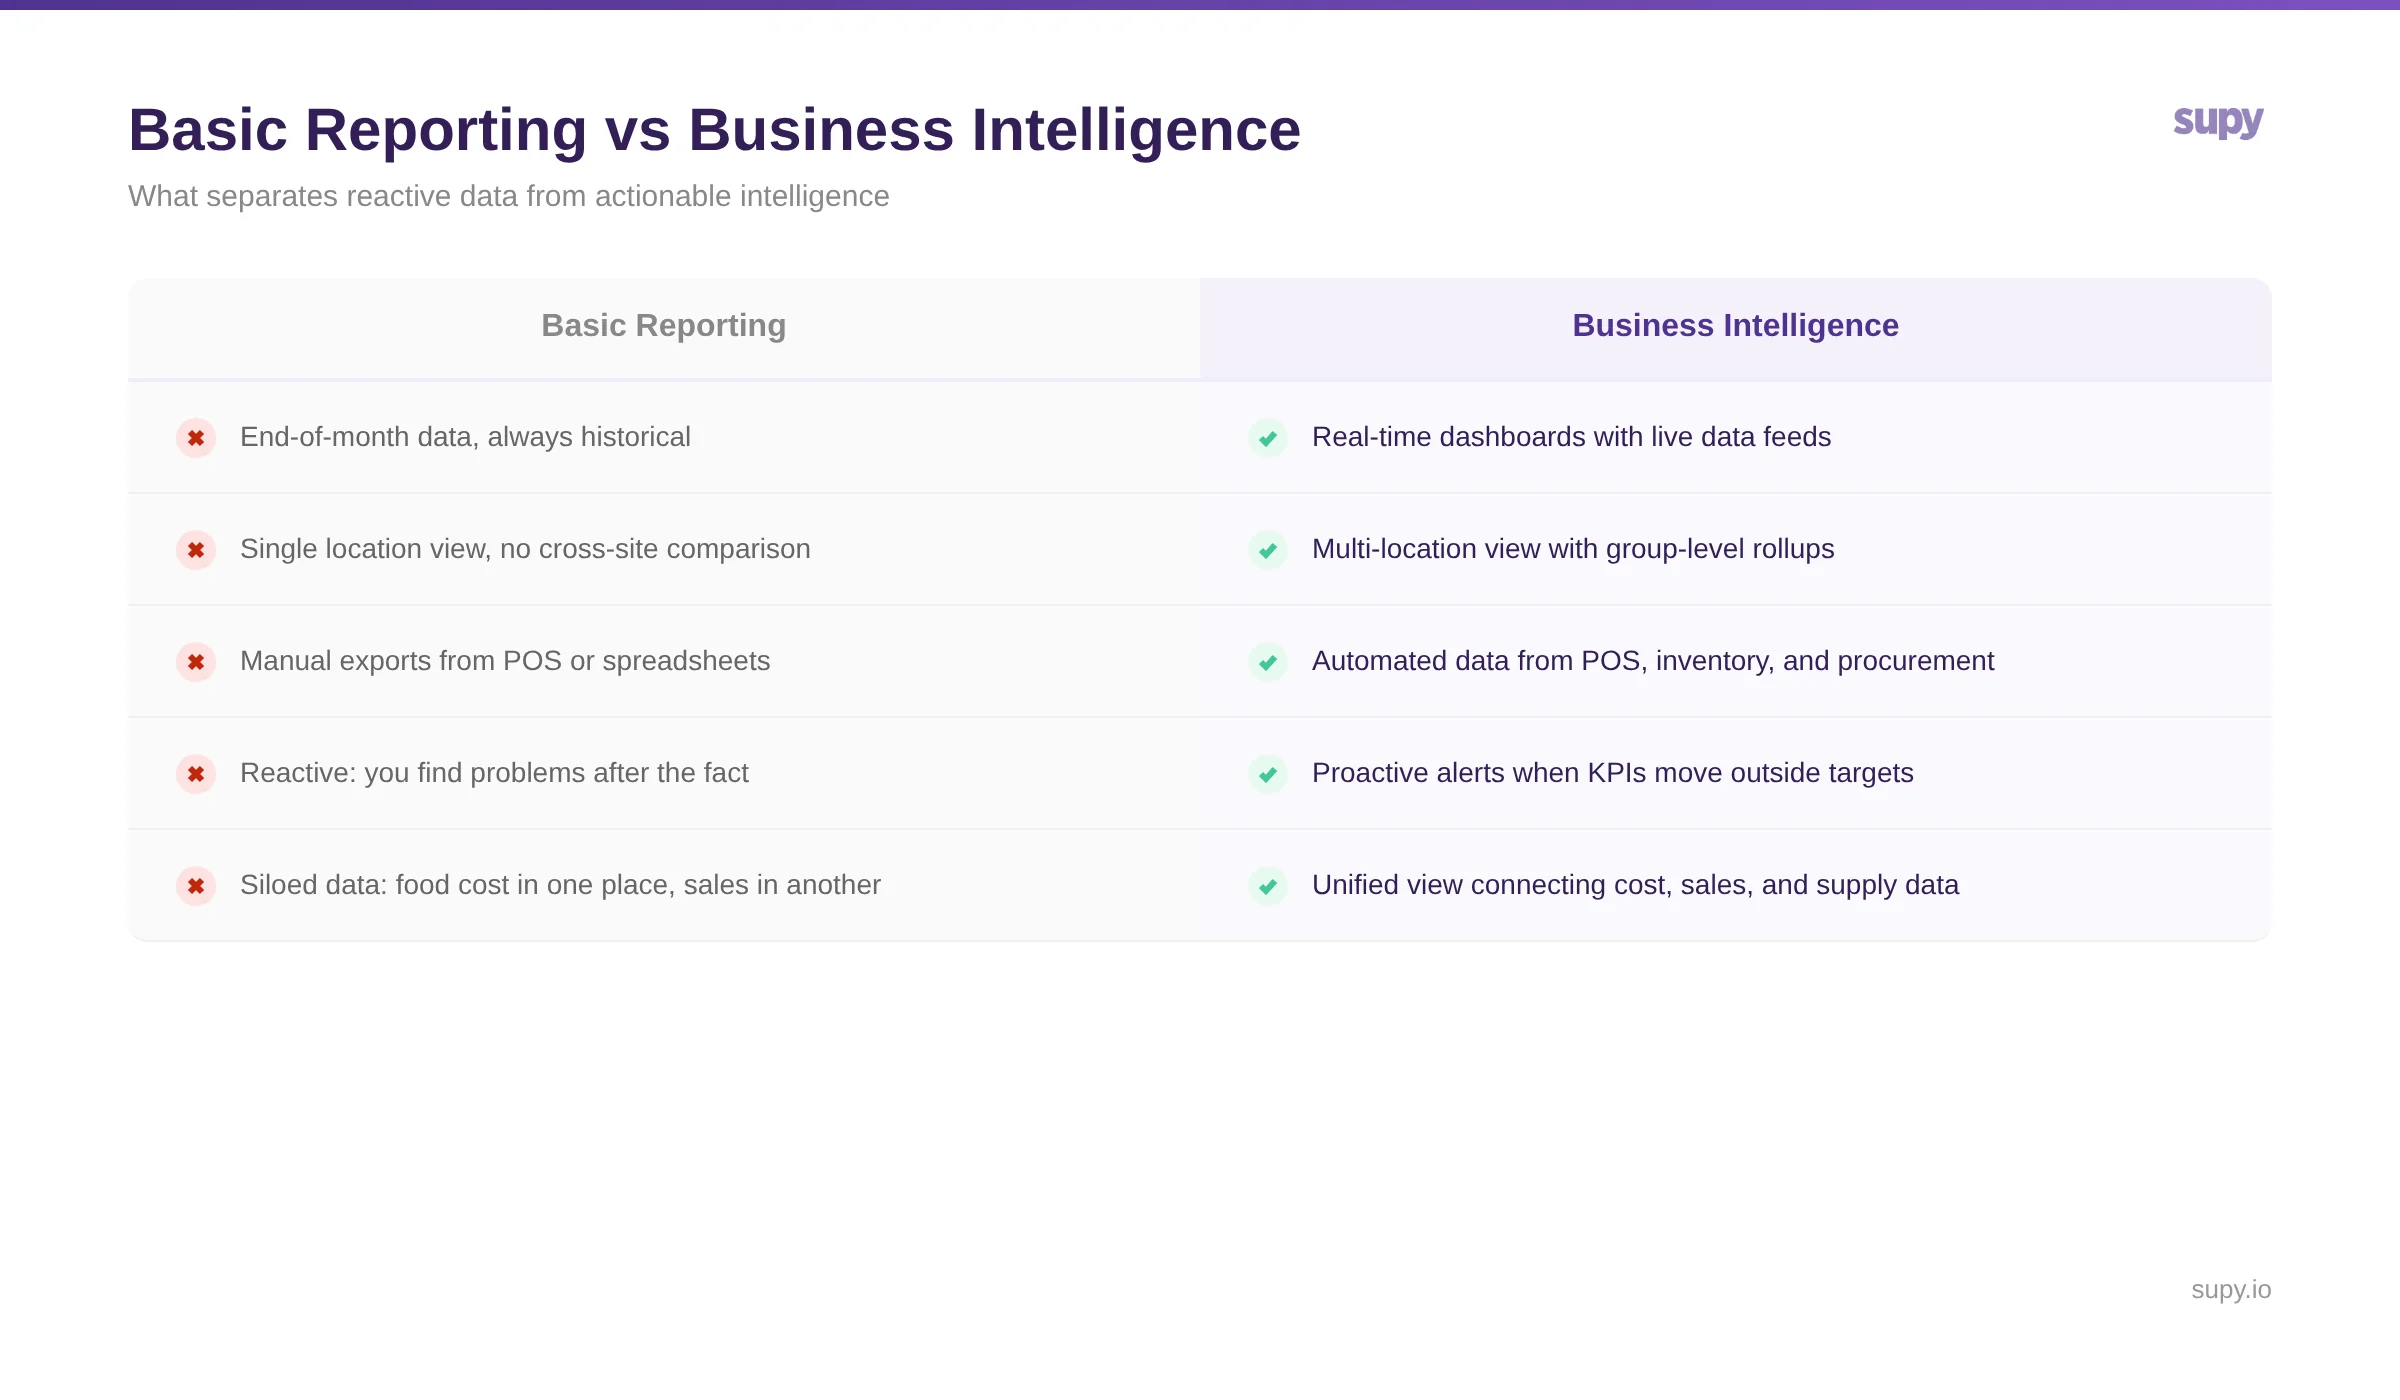
Basic reporting answers one question: what happened? Business intelligence answers a different, more valuable question: why did it happen, and what should you do about it?
The gap shows up most acutely when operators are trying to understand profitability. A common experience for growing restaurant groups is the discovery that their COGS is tracking far above target - but without connected data, identifying whether the problem lies in purchasing prices, portioning, waste, or theft can take weeks of manual investigation.
BI closes this gap by connecting the data sources that have traditionally sat in silos - giving you one view where the relationship between what you ordered, what you received, what you used, and what you sold is visible in real time.
The Three Data Sources That Make Restaurant BI Work
Effective restaurant BI is built on three connected data streams. Understanding what each contributes helps you assess whether a platform is genuinely delivering intelligence or just repackaging your existing reports.
1. Point of Sale (POS) Data
Your POS is the revenue side of the equation. It captures sales volume, menu item mix, covers, average transaction value, and revenue by location. In a BI context, POS data is most useful when it is mapped against cost data - so you can see gross margin by menu item, not just revenue.
2. Inventory Management Data
Inventory data captures what you actually have, what you used, and where variances exist between theoretical and actual stock consumption. This is where food cost control lives. When inventory data flows into a BI dashboard, you can see food cost percentage, variance by item, and waste patterns - updated as stocktakes are completed rather than at month end.
3. Procurement and Purchasing Data
Procurement data captures what you are spending with suppliers, at what prices, and in what quantities. Connected to inventory, it allows you to track whether price increases from suppliers are flowing through to your COGS - and to spot suppliers whose invoice prices regularly deviate from their agreed rates. This supplier performance view is often the most underused element of restaurant BI, and frequently where meaningful cost savings are uncovered.
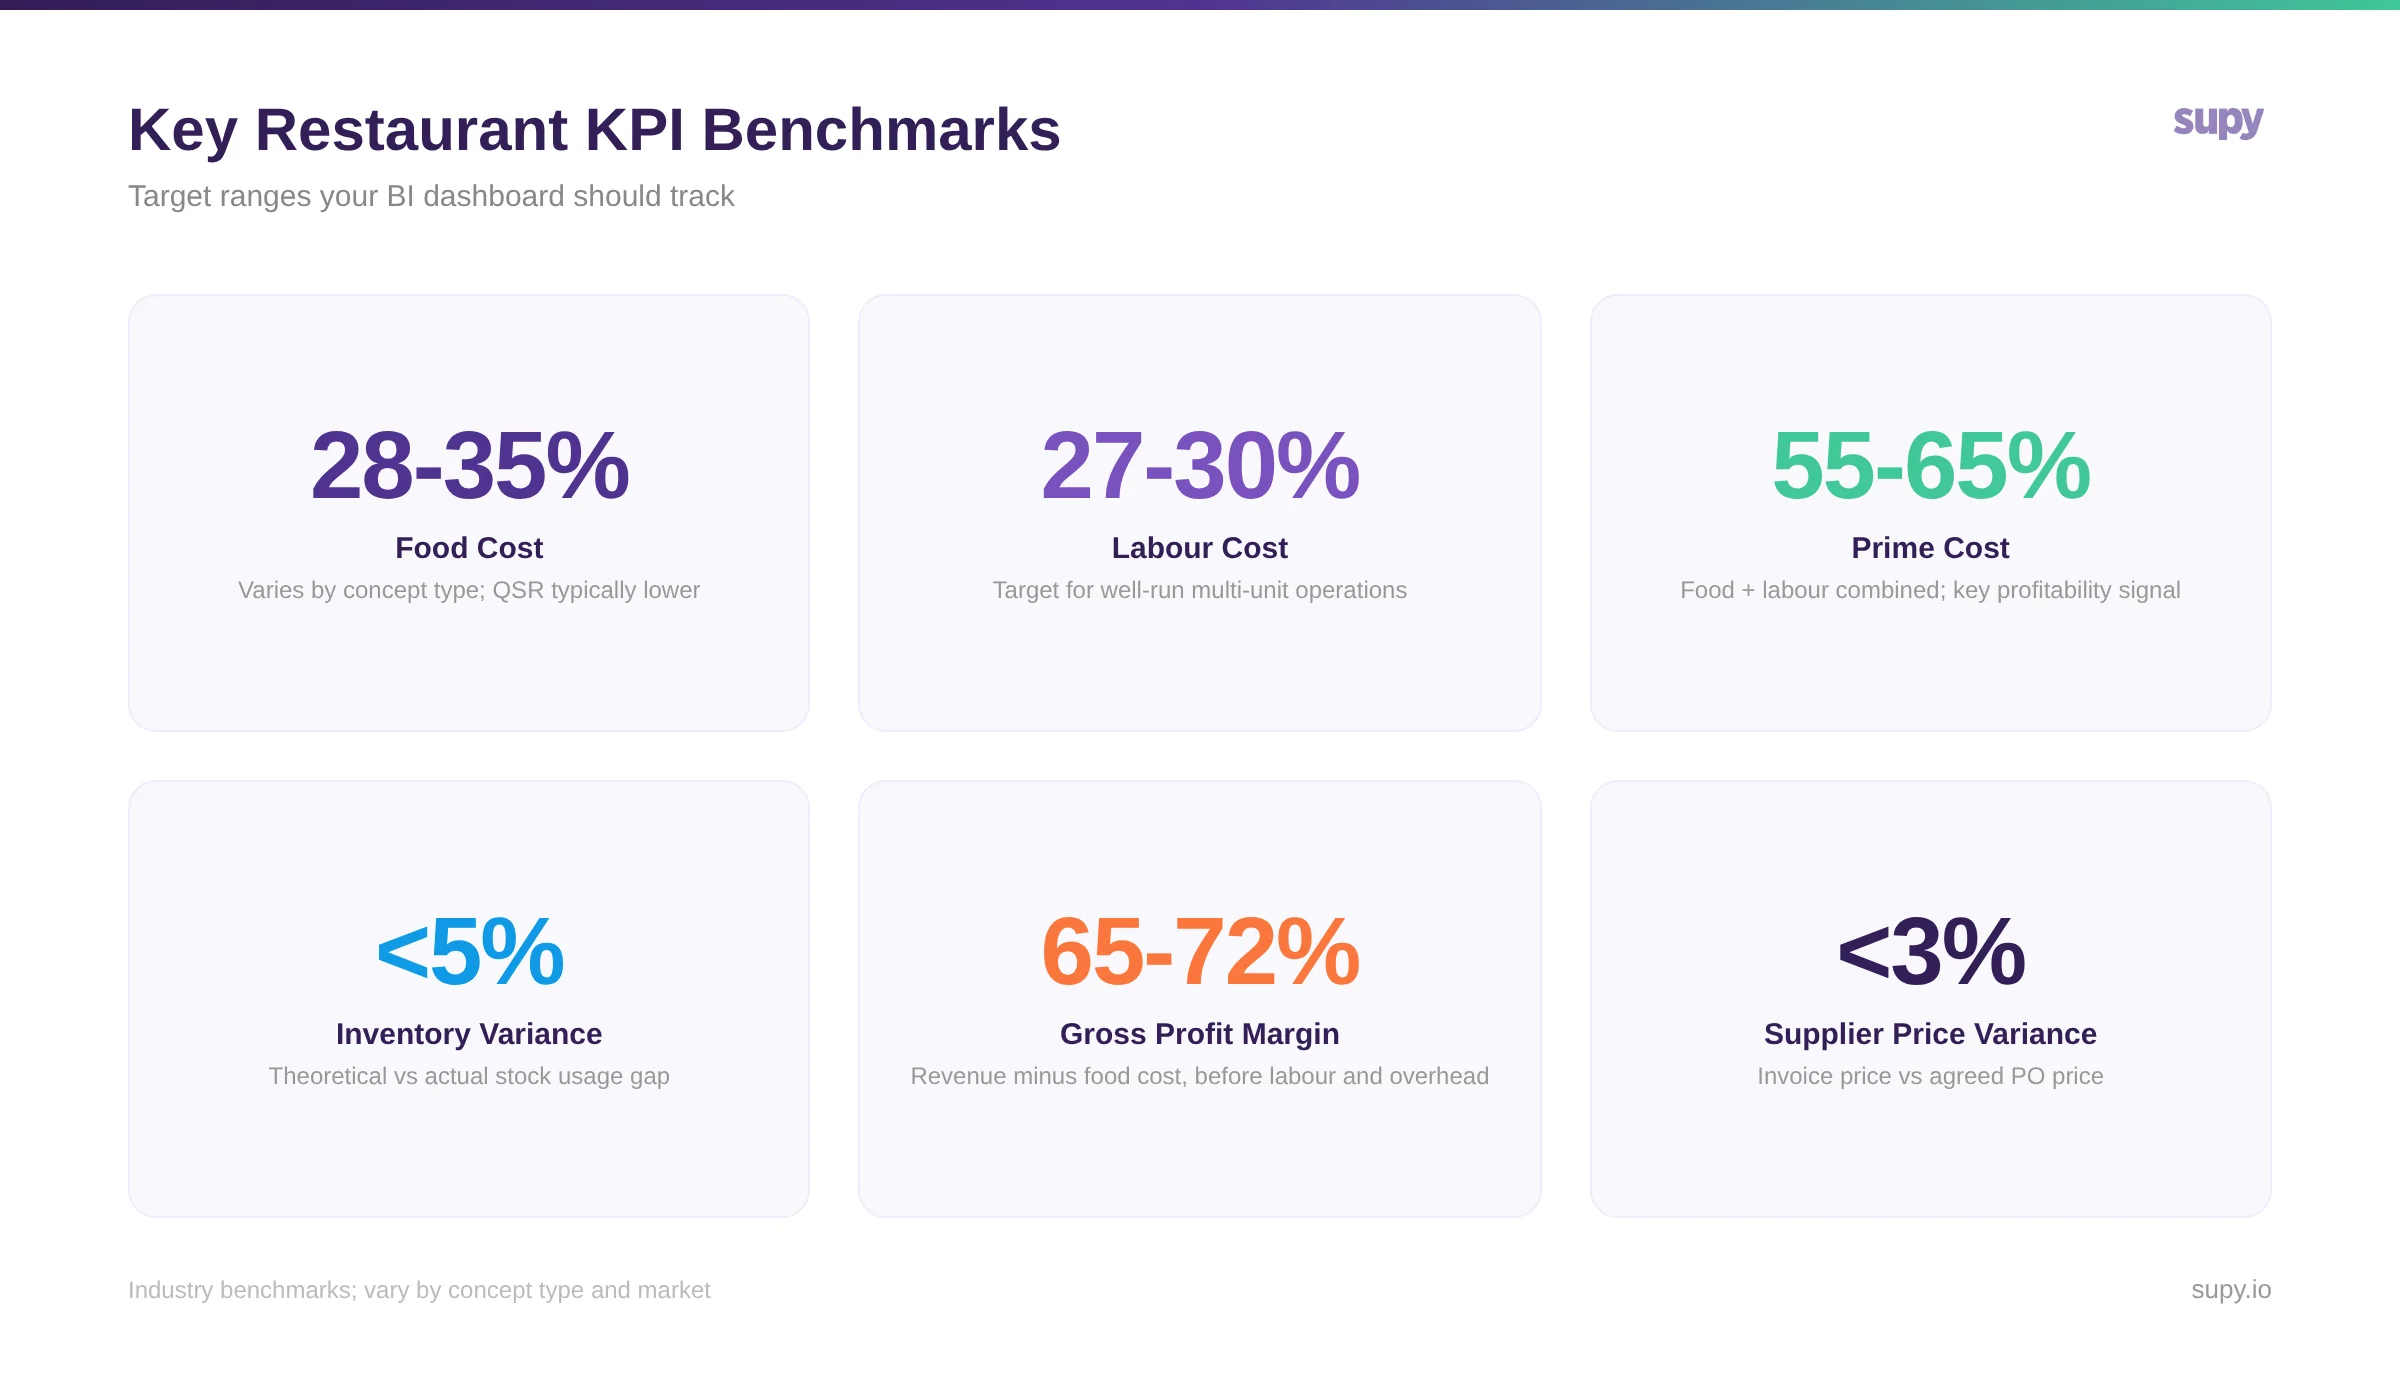
Key Metrics Your BI Dashboard Should Surface
The value of a restaurant BI platform is only as high as the key restaurant metrics it tracks and how actionably it surfaces them. The following are the metrics that matter most for back-of-house financial performance.
Food Cost Percentage The ratio of your ingredient spend to revenue, expressed as a percentage. Target ranges typically sit between 28-35%, varying by concept type. BI makes this meaningful by showing it per location, per menu category, and against a theoretical baseline - so you can see where actual usage is drifting from what your recipes say it should be.
Food Cost Variance The gap between theoretical food cost (what the recipes dictate) and actual food cost (what you spent based on stocktakes). A consistently positive variance - meaning you are spending more than recipes predict - points to portioning problems, waste, or unrecorded usage. BI flags this at item level, so the investigation starts with data rather than guesswork.
Supplier Price Adherence When a supplier quotes a price on a purchase order and charges a different price on the invoice, that variance has a direct impact on COGS. Across a group of locations placing hundreds of orders weekly, these discrepancies aggregate into meaningful costs that basic AP processes typically miss entirely.
Prime Cost Percentage Prime cost - the combination of food cost and labour cost as a percentage of revenue - is the single most important profitability indicator for most restaurant operators. Healthy prime cost ranges tend to sit between 55-65%, though this varies significantly by service model. BI makes prime cost visible at a group level and per site, enabling faster identification of which locations are underperforming.
Inventory Turnover and Variance How quickly you are cycling through stock relative to sales, and how accurately your theoretical and actual stock positions align. High variance combined with low turnover typically indicates over-ordering; high variance with high turnover points to portioning or theft.
How Restaurant BI Differs From Basic Reporting
The functional difference between a BI platform and a basic reporting tool comes down to three things: data connectivity, timing, and the direction of insight.
Basic reports are backwards-looking. They tell you what happened last month. A BI platform gives you live visibility - your food cost percentage as of today's stocktake, not as of last month's close.
Basic reports are siloed. Your POS report does not know what your COGS is. A BI platform connects these streams, so the relationship between revenue and cost is visible together.
Basic reports are passive. You pull them when you need them, and you have to know what to look for. A BI platform is active - it alerts you when something moves outside defined thresholds, so problems surface before they compound.
Why This Matters Most for Multi-Location Operators
For operators running three or more locations, the case for BI becomes particularly compelling. The manual overhead of consolidating reports across sites grows non-linearly with each new opening. By the time you are running eight or ten locations, the finance team is spending meaningful time just compiling data that could - and should - be generated automatically.
Beyond efficiency, multi-unit BI enables a type of analysis that is simply not possible with site-level reporting: comparison across locations. When you can see that one site is running food cost at 32% and another at 41%, and that difference cannot be explained by menu mix or revenue volume alone, you have a genuine operational question to investigate. That comparison is only possible when all your location data is in the same platform.
For enterprise hotel F&B operators and franchise groups, the requirement extends further - to cost centre allocation, entity-level reporting, and integration with finance systems. The underlying principle remains the same: decisions need to be grounded in connected data, not reconciled manually each month.
What to Look for When Evaluating Restaurant BI
Not every platform that uses the word "analytics" is delivering genuine business intelligence. The following capabilities distinguish a real BI platform from a tool that is simply presenting your existing data in a different format.
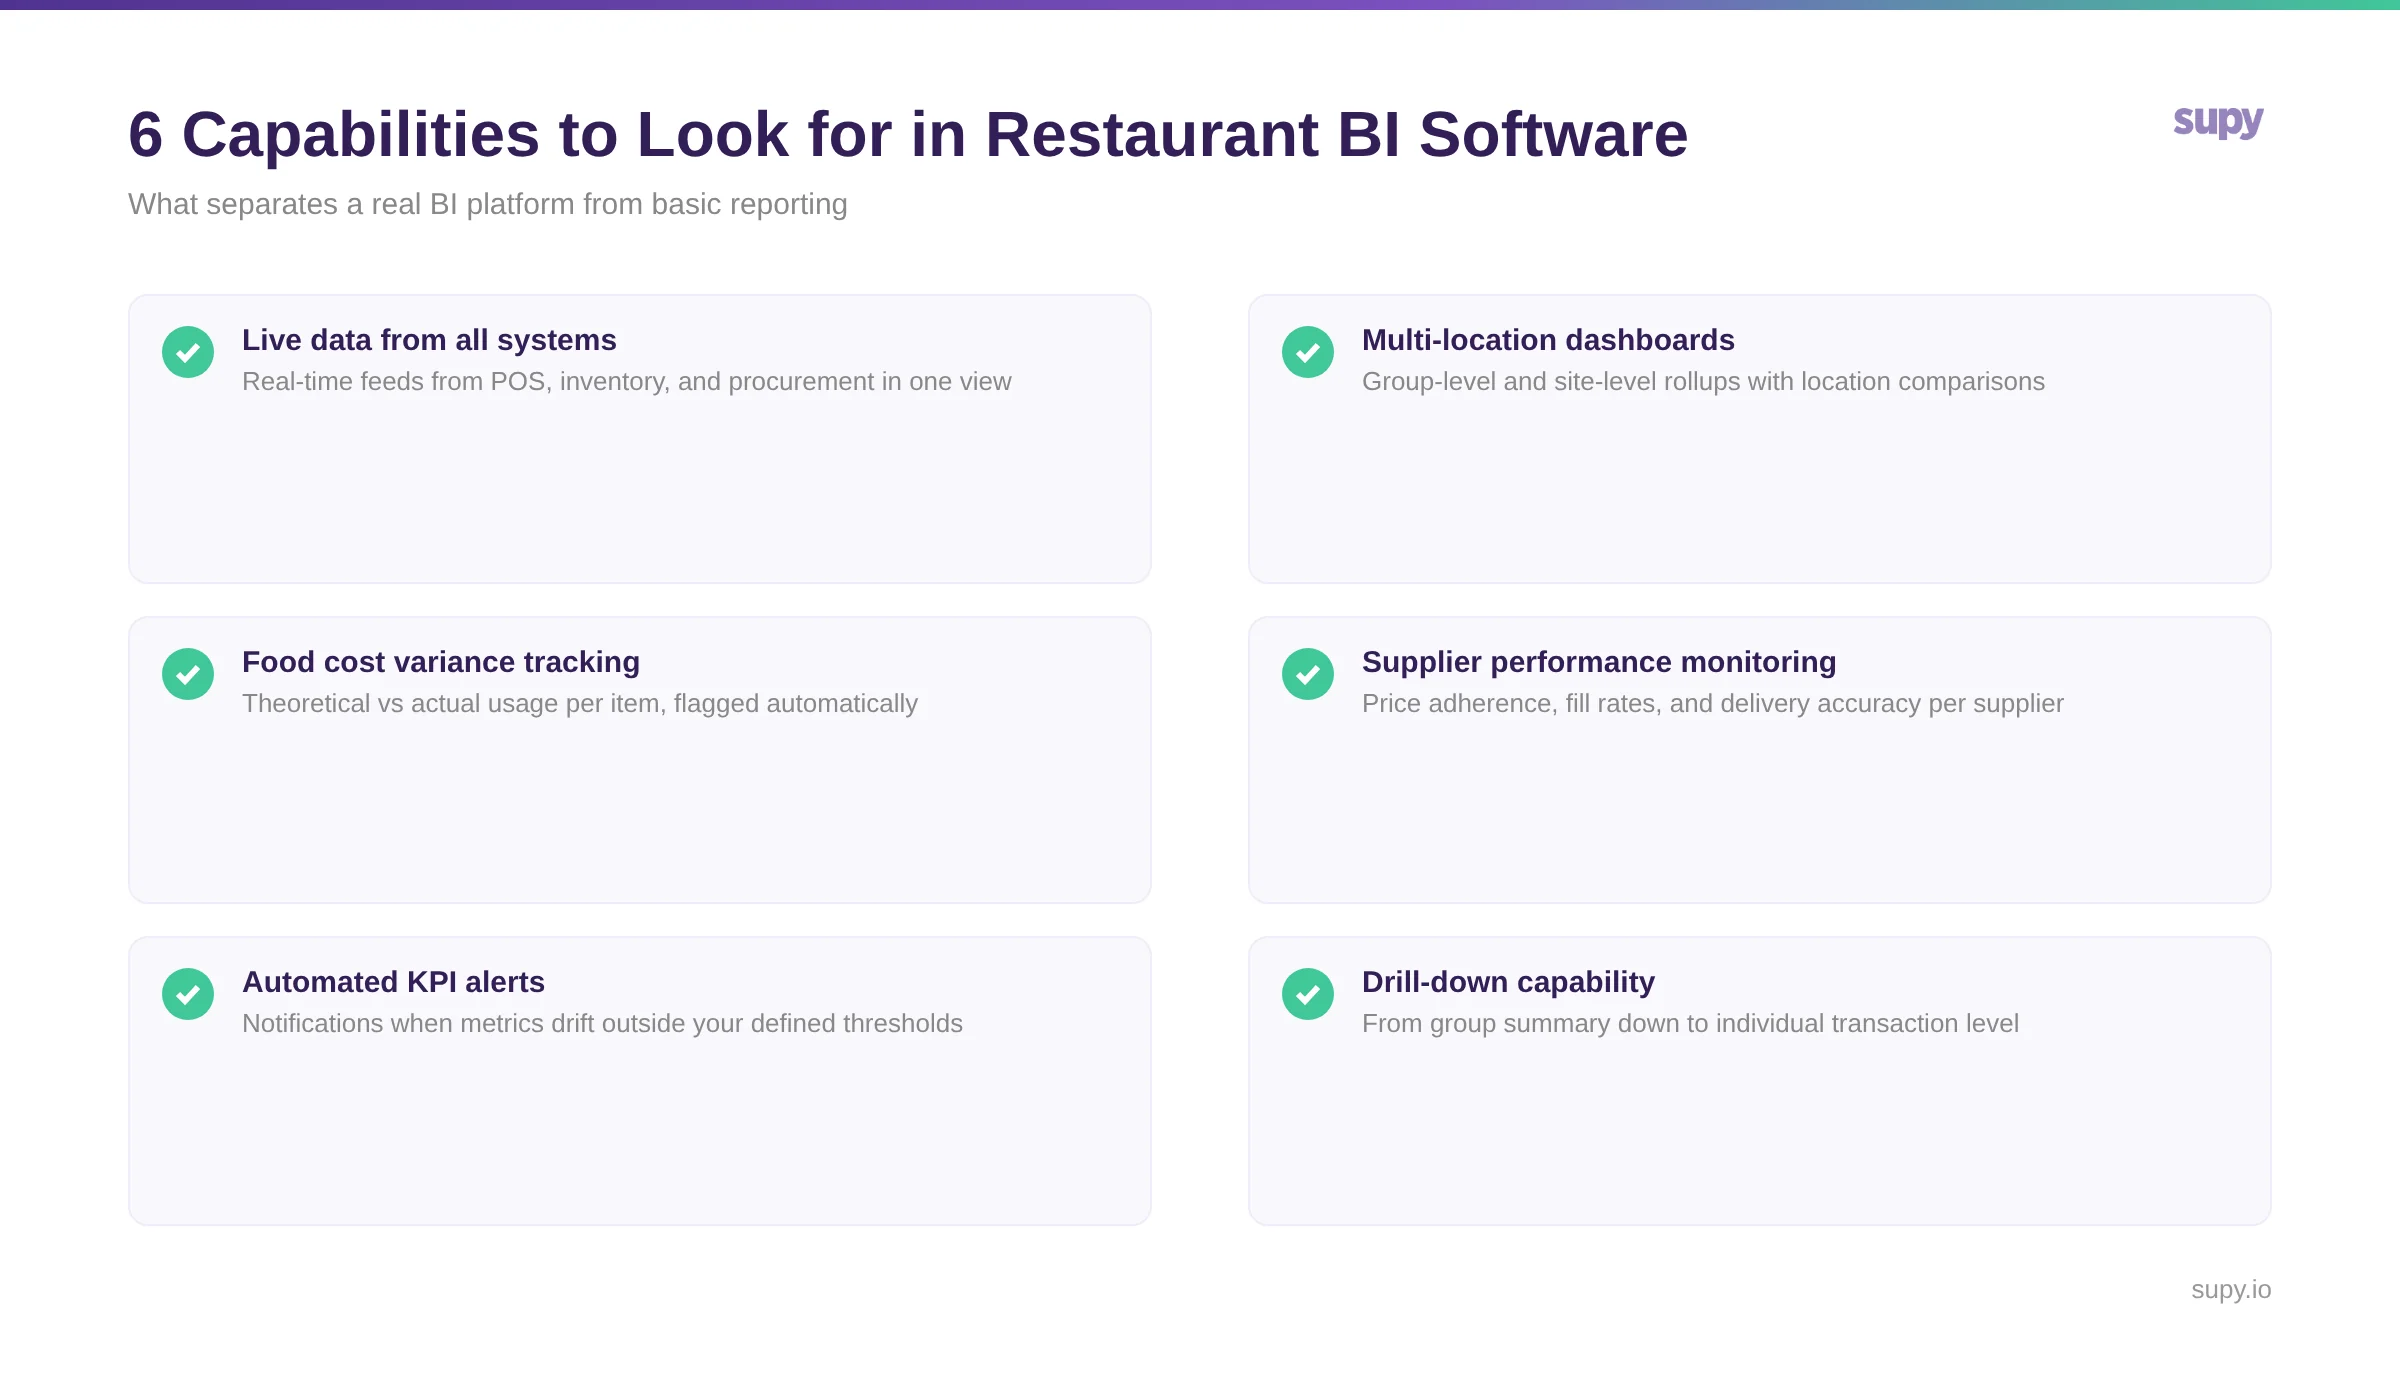
When assessing a platform, pay particular attention to where the data comes from. A BI dashboard that pulls from POS only cannot tell you anything meaningful about cost - it is a sales report with a better interface. A genuine restaurant BI platform connects purchasing, inventory, and sales data, and maintains the relationships between them so that cost and revenue analysis is possible without manual enrichment.
How Supy Approaches Restaurant Business Intelligence
Supy's restaurant BI and analytics platform is built on connected back-of-house data: every purchase order, invoice, stock movement, waste record, and stocktake feeds into a unified operational view. Rather than extracting reports from separate systems and reconciling them, operators see live dashboards that reflect actual operational activity as it happens.
The platform surfaces food cost variance at item and category level, flags supplier price deviations against agreed purchase order prices, and shows COGS by location and by period - with the ability to drill from group summary down to individual transactions. For multi-location groups, this means moving from "our food cost is too high" to "these five items across these three sites account for 60% of the variance" - and acting on that information the same week, not the same quarter.
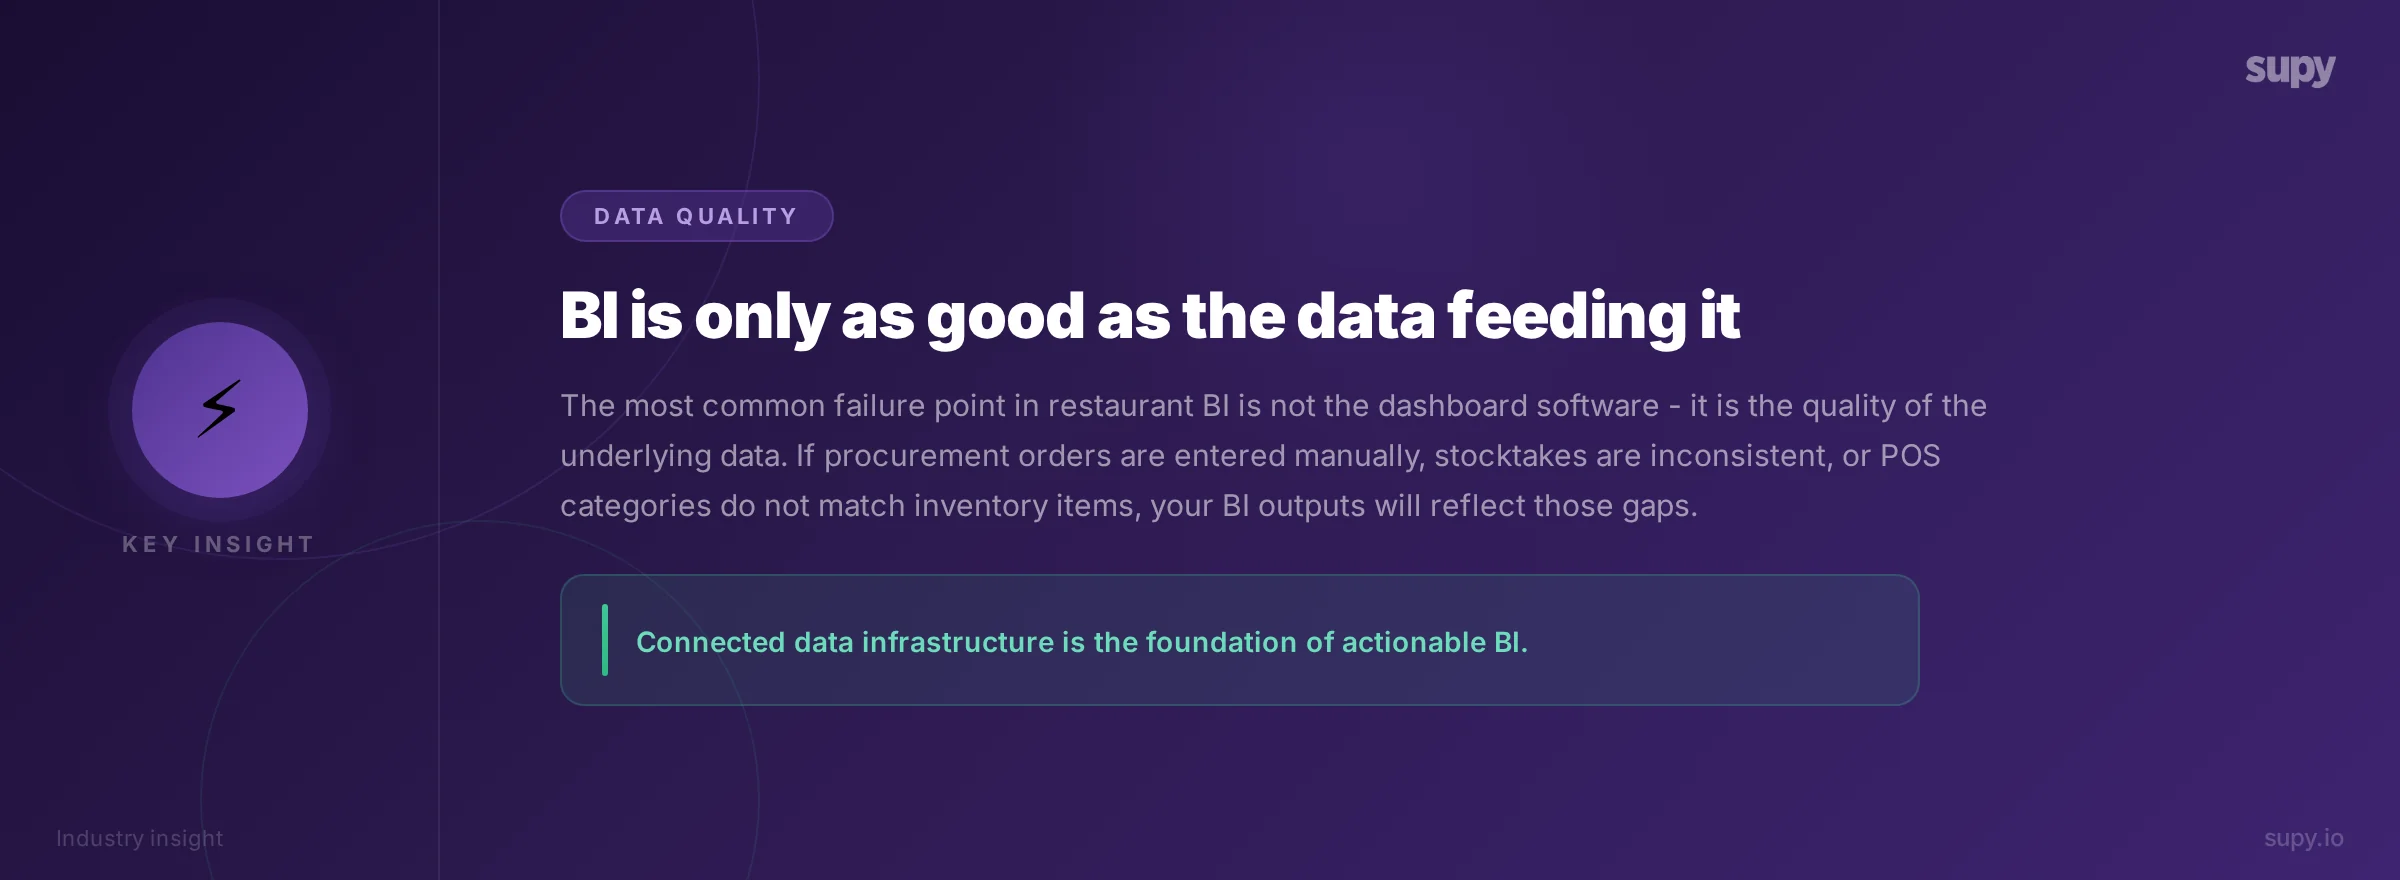
Supy also supports the data quality foundation that BI requires. When procurement, receiving, and inventory are managed in the same system, the connections between data sources are maintained automatically - eliminating the reconciliation work that typically makes restaurant BI slow and labour-intensive to maintain.
About Supy
Supy is a back-of-house operations platform for multi-location restaurant groups, covering procurement, inventory management, recipe costing, and business intelligence. Designed for operators running multiple sites, Supy connects purchasing, stock, and sales data into a unified operational view - enabling real-time cost visibility and data-driven decision-making across the entire group.