.jpg)


Multi-Unit Restaurant Reporting: Why Per-Site Spreadsheet Extraction Fails at Scale
The finance director at a 6-location casual dining group spends the first two days of every week doing the same thing: opening six separate spreadsheets, pulling purchase data from each branch's inventory system, cross-referencing the sales figures from the POS, and manually calculating food cost percentage for each site. By the time the consolidated picture is ready, it is Wednesday afternoon. The variances from last week's ordering cycles have already been replicated into this week's purchasing.
That process is consuming 9 hours of finance time per week - time spent not on analysis but on extraction. The group is not running multi-unit restaurant reporting. It is running a manual data assembly operation that produces a picture of last week by mid-this-week.
When Every Branch Holds Its Own Data, the Group Has No Data
Most multi-unit operators do not start with a fragmented data problem. They start with one location, a spreadsheet that makes sense at that scale, and a process that gets replicated as sites are added. By the time they are operating 5 or more branches, those separate tracking sheets have become the de facto reporting infrastructure.
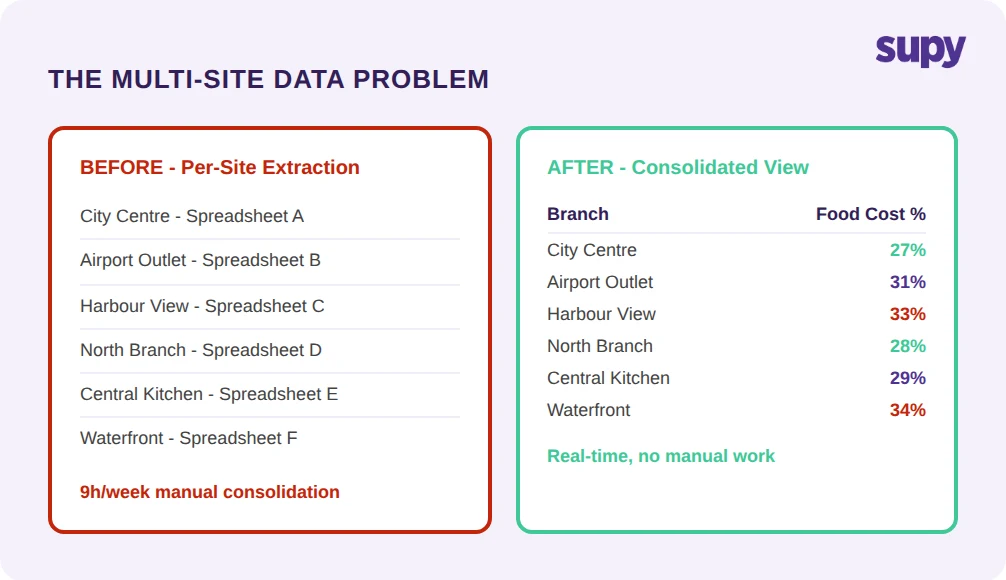
A multi-site casual dining group's operations director described the situation directly: managers were running inventory and cost tracking in separate spreadsheets, with no coherent consolidated view across sites. Every system - POS, inventory, HR - sat in a separate silo. The only way to see the group's total COGS was to add up each site's figures manually, which meant the consolidated picture was always a week old by the time it existed.
This is the structural problem with spreadsheet-based multi-unit restaurant reporting. Spreadsheets are built for a single user at a single location. They do not aggregate across sites automatically. They do not push data to a central layer. They do not update when a branch completes a stock count or receives a supplier delivery. Multi-unit reporting built on spreadsheets is not a reporting system - it is a collection of local records that someone in finance has to assemble by hand each week, with a result that is outdated before it is finished.
What to ask: Does your current process require someone to manually combine branch-level data to produce a group COGS figure?
The COGS Figure That Arrives Too Late to Act On
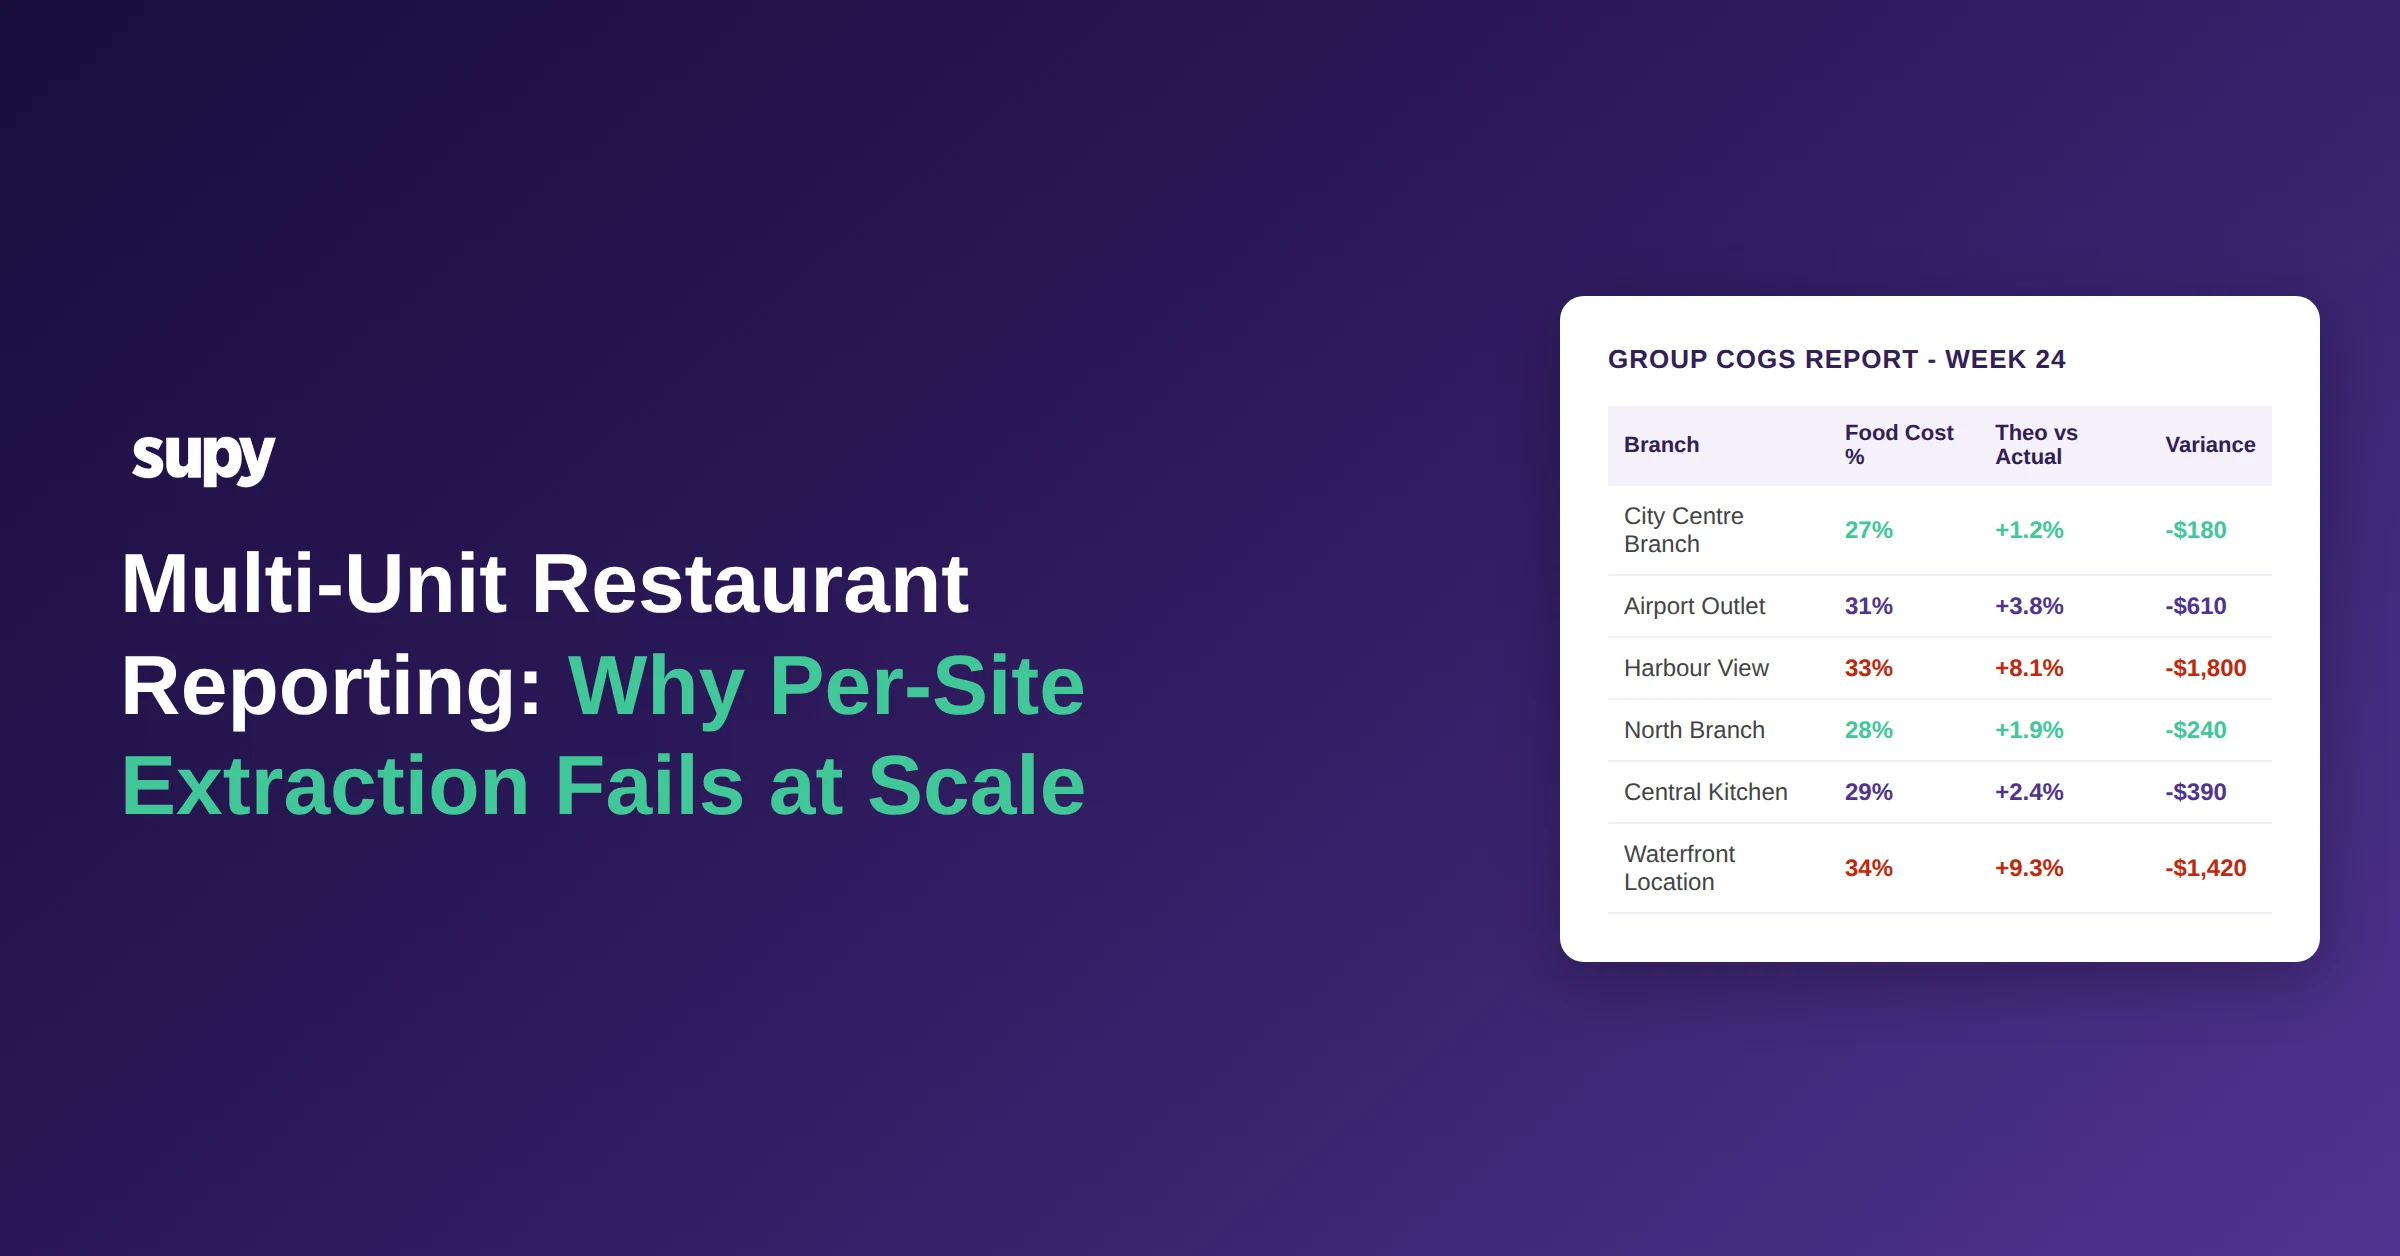
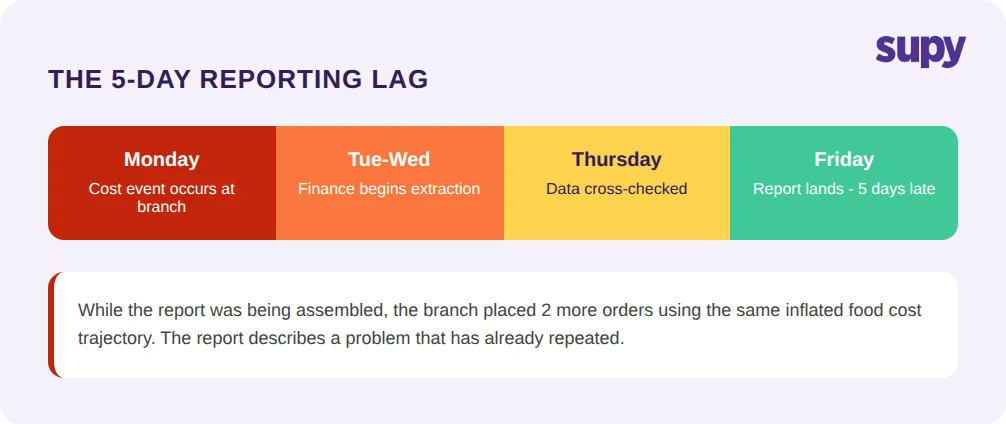
COGS figures have a decay problem. A food cost percentage calculated from last week's data can tell you that one branch ran at 33% while two others ran at 27% and 31% respectively. It cannot tell you why the variance occurred, and by the time the consolidated report exists, the branch has already placed this week's orders at the same inflated trajectory.
Industry analysis shows that 42% of restaurant operators were not profitable in 2025. The operators who performed consistently did not wait for weekly reports assembled by hand - they built their cost management on real-time data. The 5-day reporting lag that comes from per-site manual extraction converts operational intelligence into historical record. By the time it reaches the finance director's desk, the data describes a situation that has already changed.
A multi-site casual dining group's finance director raised this directly: GP figures and P&L outputs must be self-serviceable by the finance team, and any report that requires waiting on IT or vendor intervention to generate is a structural blocker at scale. The issue is not just convenience - a report that cannot be run without external support is a report that is not run at the cadence the business needs. Weekly extraction cycles become monthly reviews. Monthly reviews become quarterly visibility. By that point, the data is not a management tool - it is a post-mortem.
What to ask: How many days pass between a cost event at a branch and when your finance team can see it reflected in a COGS figure?
Variance Across Sites Cannot Be Diagnosed in Aggregate
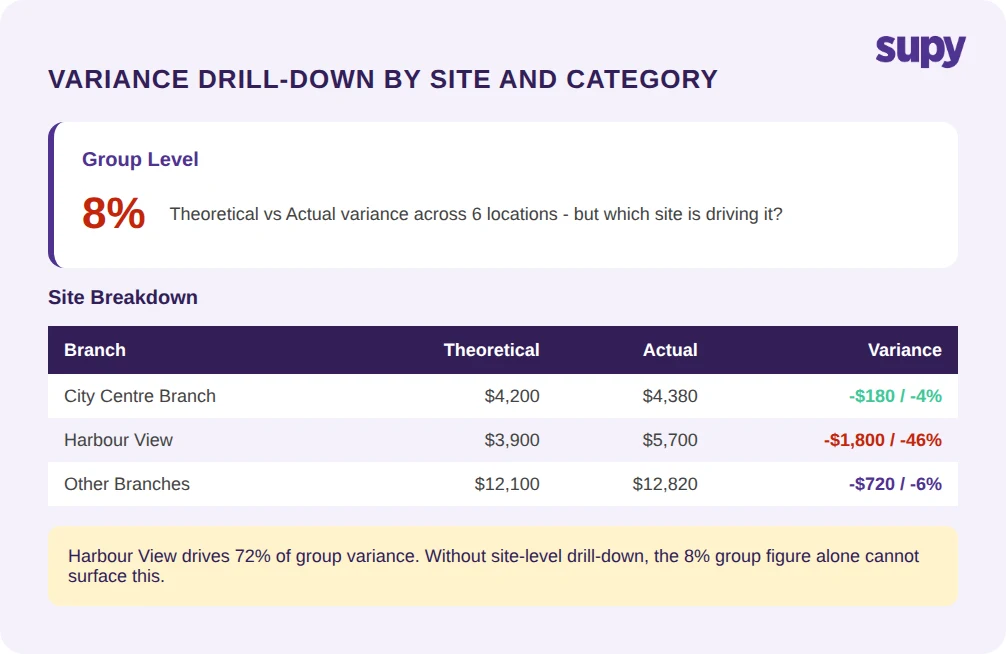
A theoretical-vs-actual variance of 8% at the group level tells you something is wrong. It does not tell you whether the variance is driven by waste at one site, portioning inconsistency at another, or receiving discrepancies at a third. Diagnosing multi-unit variance requires drill-down by site, by category, and by SKU - and that granularity is not available in a manually consolidated spreadsheet.
A multi-location hospitality group's beverage manager identified this gap specifically: the team needed a detailed variance breakdown by beverage category and SKU across branches to isolate the source of high variance - whether it was theft, over-pouring, or waste. The group-level number was visible. The per-branch, per-SKU breakdown was not, and without it the group could not act on the signal.
This is the diagnosis problem in multi-unit restaurant reporting. When variance is only visible at the aggregate level, operators cannot distinguish between a systemic issue - a supplier delivering short on every delivery - and a local issue confined to one branch. Acting on aggregate variance without site-level and SKU-level drill-down means either ignoring the signal or running every branch through a review process when the problem is isolated to one location and one category.
Across 340 SKUs and 6 locations, that kind of diagnostic process by hand is not operationally realistic. It requires the tool, not the analyst, to surface which branch, which category, and which item is driving the group's variance figure.
What to ask: Can your current reporting isolate variance to a specific branch, category, and SKU - or does your team manually dig through each site's records to find it?
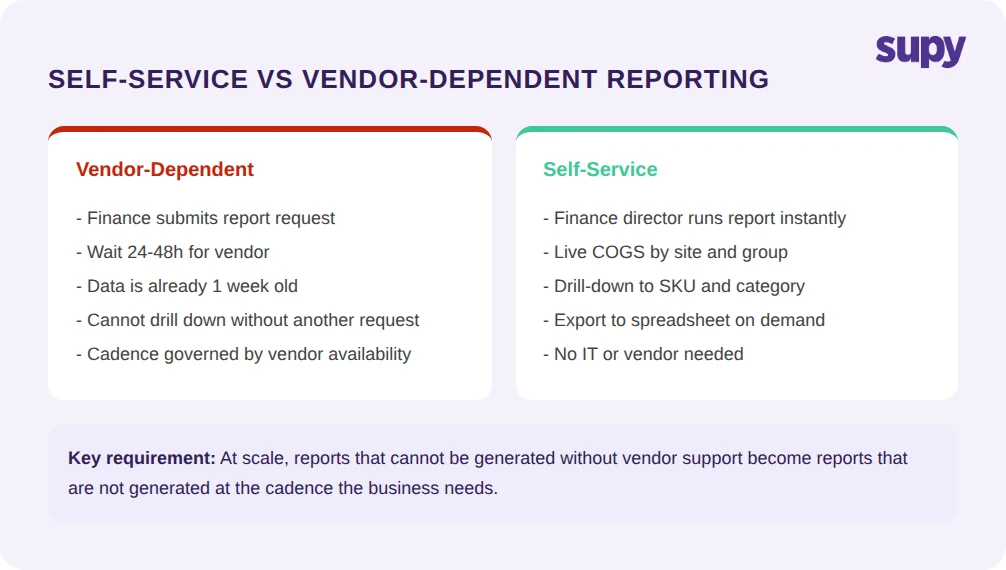
Finance Directors Need Self-Service Access, Not Vendor Dependency
In restaurant groups operating at scale, the expectation is that a finance director or senior ops manager can generate a GP summary or P&L breakdown without opening a support ticket. The perception that any report requires vendor involvement to produce is - across multiple operator accounts - cited as a buying blocker and a trust issue during software evaluation.
Self-service reporting is not a feature addition. It is the difference between a system built for multi-unit finance teams and a system that was designed for single-site operators and extended beyond its original scope. A finance director who can pull a group-level COGS report, drill into a specific branch's variance, and export to a spreadsheet without IT involvement is working at the speed the business requires. A finance director who has to wait two days for vendor support to generate the same numbers is not.
The failure mode here is often invisible. Groups on systems with limited self-service capability develop workarounds - a weekly report that a vendor runs automatically, a single internal analyst who knows how to extract the raw data, a manual export process that one person owns. These workarounds absorb cost and create single points of failure. They also mean the group's reporting cadence is governed by someone else's availability rather than by the finance team's analytical needs.
When that workaround person leaves, or the vendor changes their support process, the reporting infrastructure breaks. The group discovers it did not have a reporting system - it had a dependency dressed up as one.
What to ask: Which reports in your current system require IT or vendor involvement to generate, and what happens when that person or vendor is unavailable?
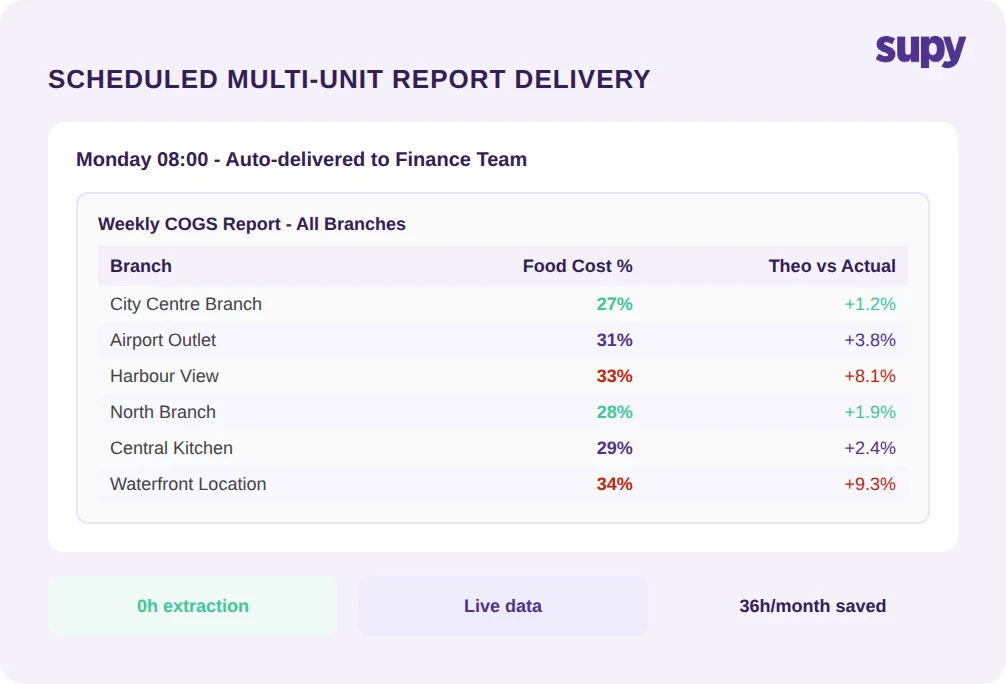
Scheduled Delivery Replaces Per-Branch Manual Extraction
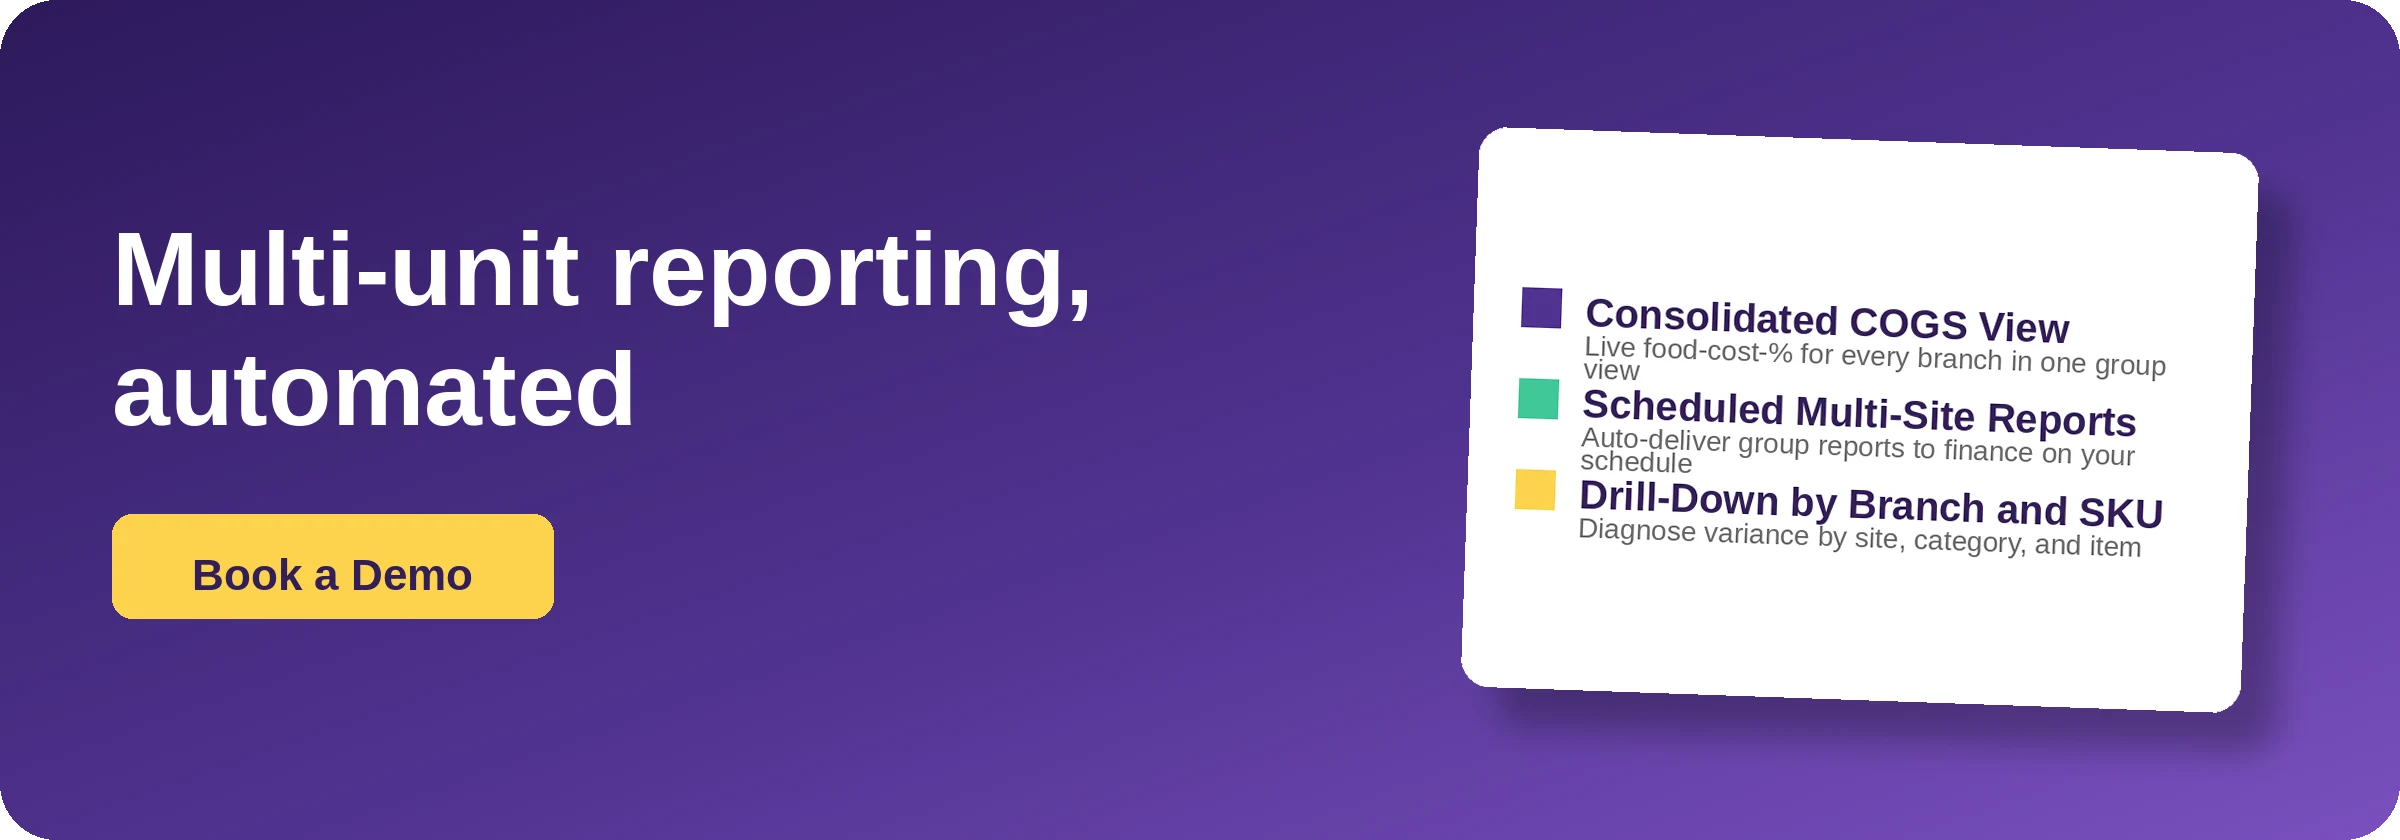
The alternative to manual extraction is scheduled delivery: automated reports containing COGS percentage, sales actuals, and theoretical-vs-actual variance per venue, sent to the relevant finance and ops recipients every Monday morning without anyone pulling data from each site.
This is the reporting standard that restaurant groups operating across multiple locations need. The report is not generated when someone has time to compile it. It is generated automatically on a defined cadence from live data, consolidated across all branches, and delivered to the people who need it - at group level, at site level, and with the drill-down to diagnose rather than just observe.
Supy's Interactive Dashboards give group finance teams a live view of COGS and food cost percentage at the group, site, and menu-category level, with theoretical-vs-actual variance and wastage breakable down by type, site, and item. Spreadsheet Reports cover the full scope of multi-unit restaurant reporting - purchase value, orders, invoices, supplier performance, stock movement, variance, wastage, and recipe costing - exportable at group or site level without IT involvement. The stock consolidation view gives group finance teams aggregated inventory values across all branches in a single report, replacing per-site manual extraction entirely.
The shift from per-branch extraction to consolidated scheduled delivery is not a reporting improvement. It is the difference between running multi-unit restaurant reporting and running a weekly data assembly process that consumes 36 hours of finance time per month producing numbers that are already 5 days old by the time they land.
What to ask: Which of your current COGS and variance reports are generated automatically on a schedule, and which require someone to manually pull and compile data from each site?
Multi-unit restaurant reporting fails when the tools in use were built for one location and extended by manual process to cover many. The problem compounds at every additional site. The 9 hours per week of extraction time, the 5-day reporting lag, the inability to drill into per-branch and per-SKU variance - these are not workflow inefficiencies. They are the cost of running a multi-site operation on single-site reporting infrastructure.
The operators who resolve the problem do not improve their spreadsheet process. They replace the extraction layer with a consolidated reporting system that finance directors can run, schedule, and act on without waiting for anyone else.