.jpg)


Kitchen Management Software: Run a Tighter Back of House
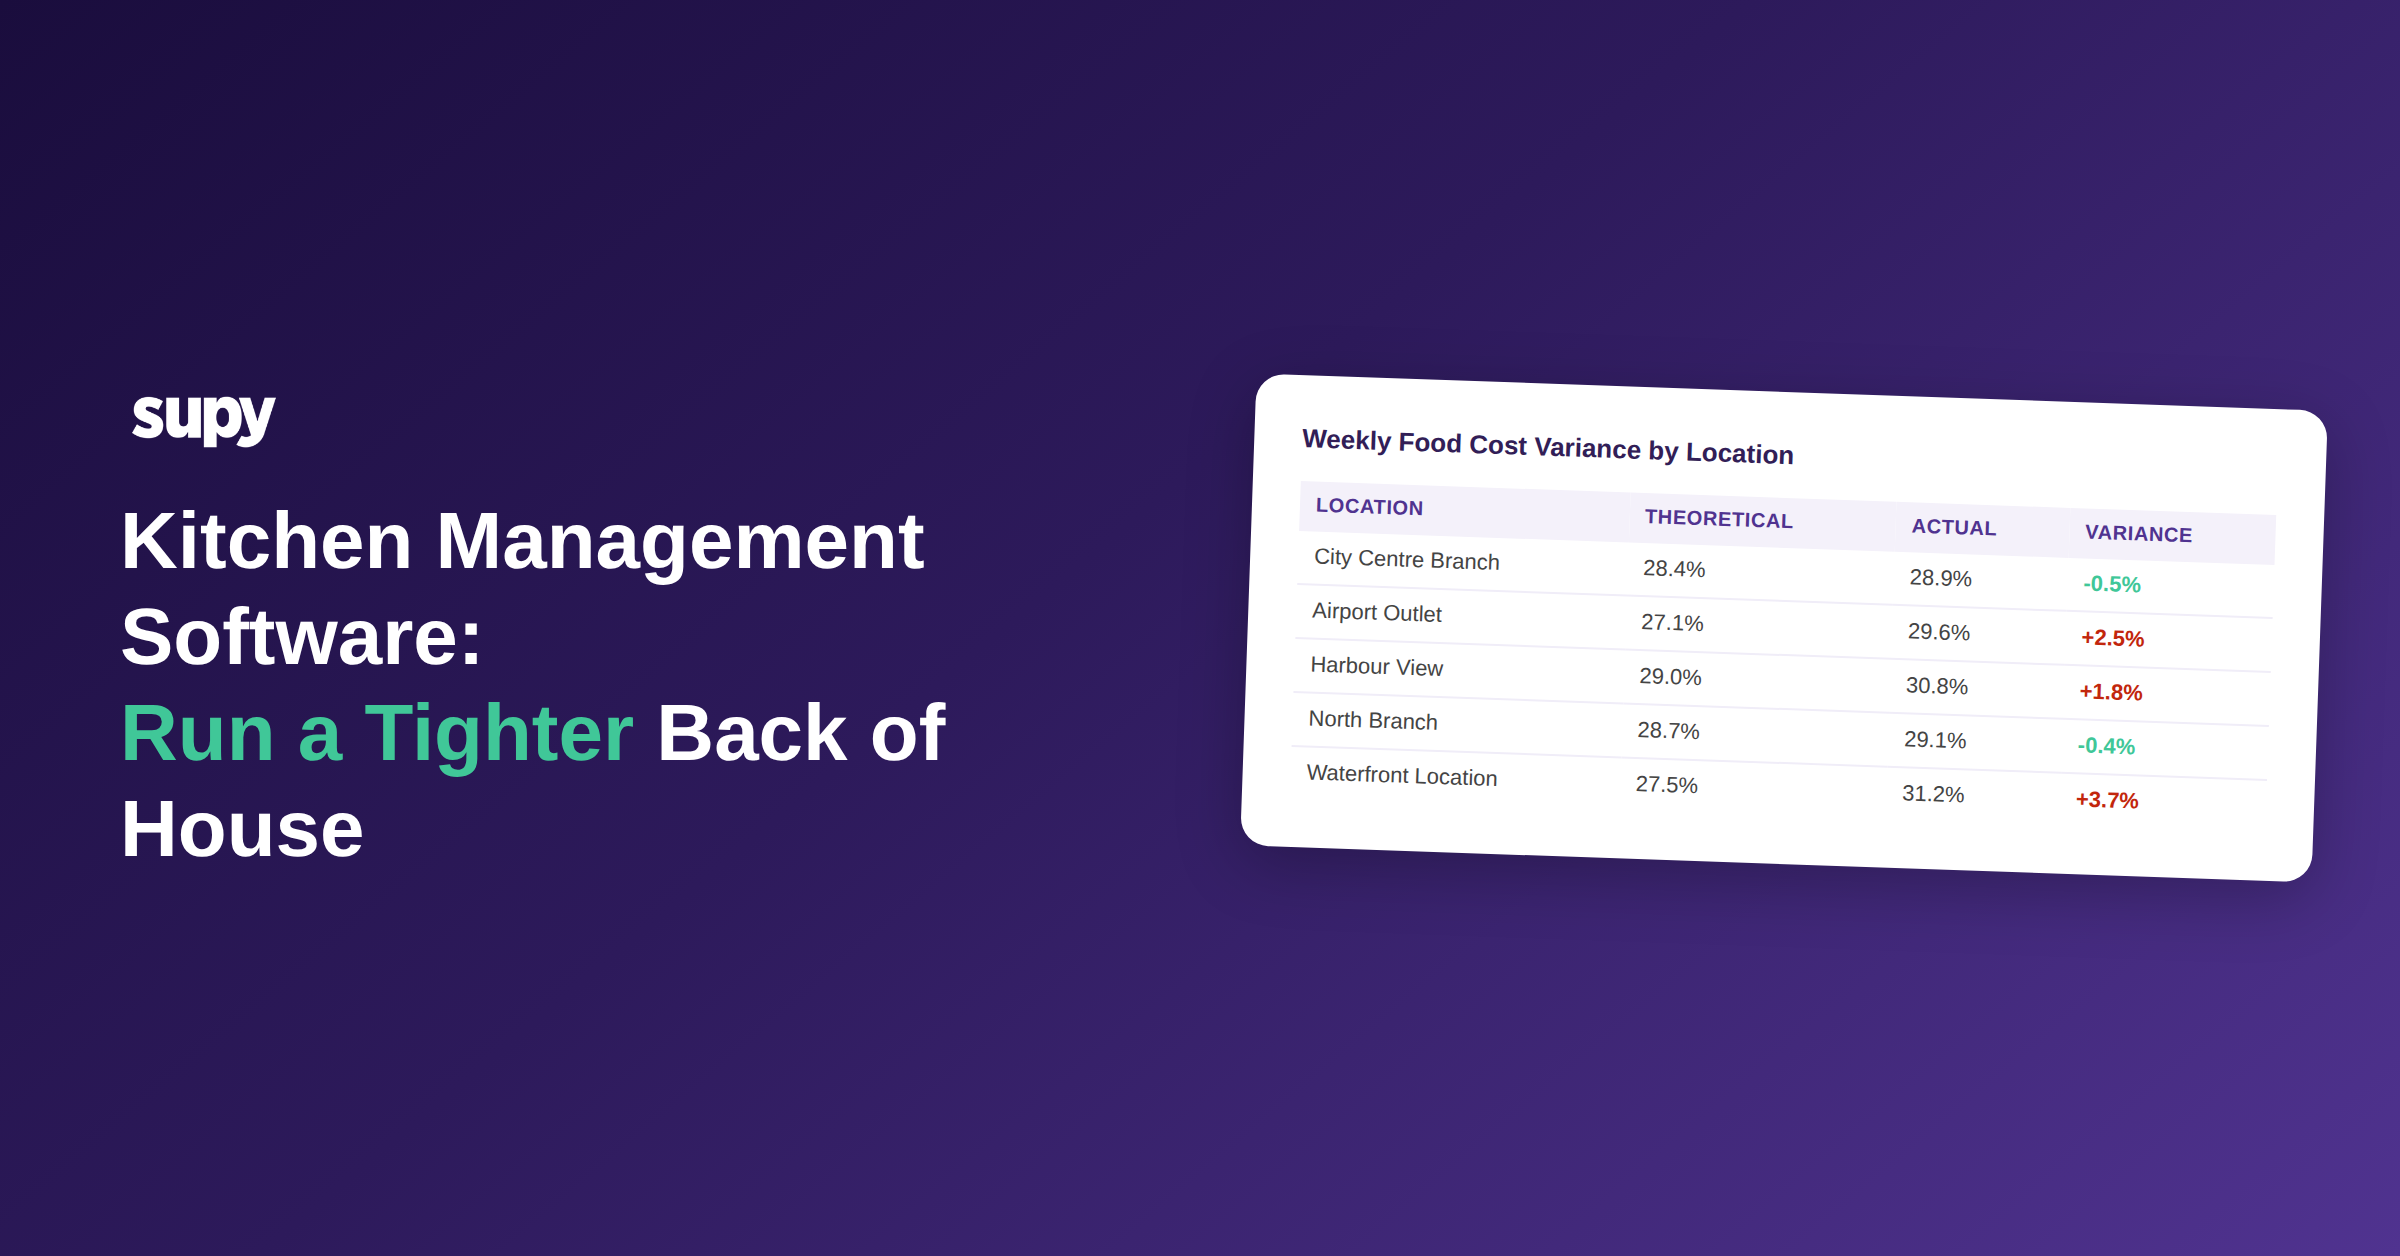
Kitchen management software is supposed to give you a tighter back of house - tighter cost control, less waste, and fewer surprises at month-end. On a single site it usually delivers. Across a multi-site group, the gains depend on whether the system handles the operational details most software quietly skips - and the first one shows up before a single dish is sold.
Where Kitchen Management Software Loses Track of Prep Costs
When a kitchen produces a sauce batch, a marinade, or a prep component used across multiple dishes, that production creates cost the moment ingredients are consumed. In most basic kitchen management systems, that cost doesn't register until the batch is plated and sold - if it's recorded at all.
For a multi-site group running a central production kitchen, this is not a minor rounding error. A single 40-portion sauce batch uses $280 in ingredients. If that batch is not tracked as a prep recipe against ingredient depletion, the stock count at week's end shows a $280 negative variance with no cause assigned. Multiply across a full week of production batches and the total disappears into a line marked "unresolved."
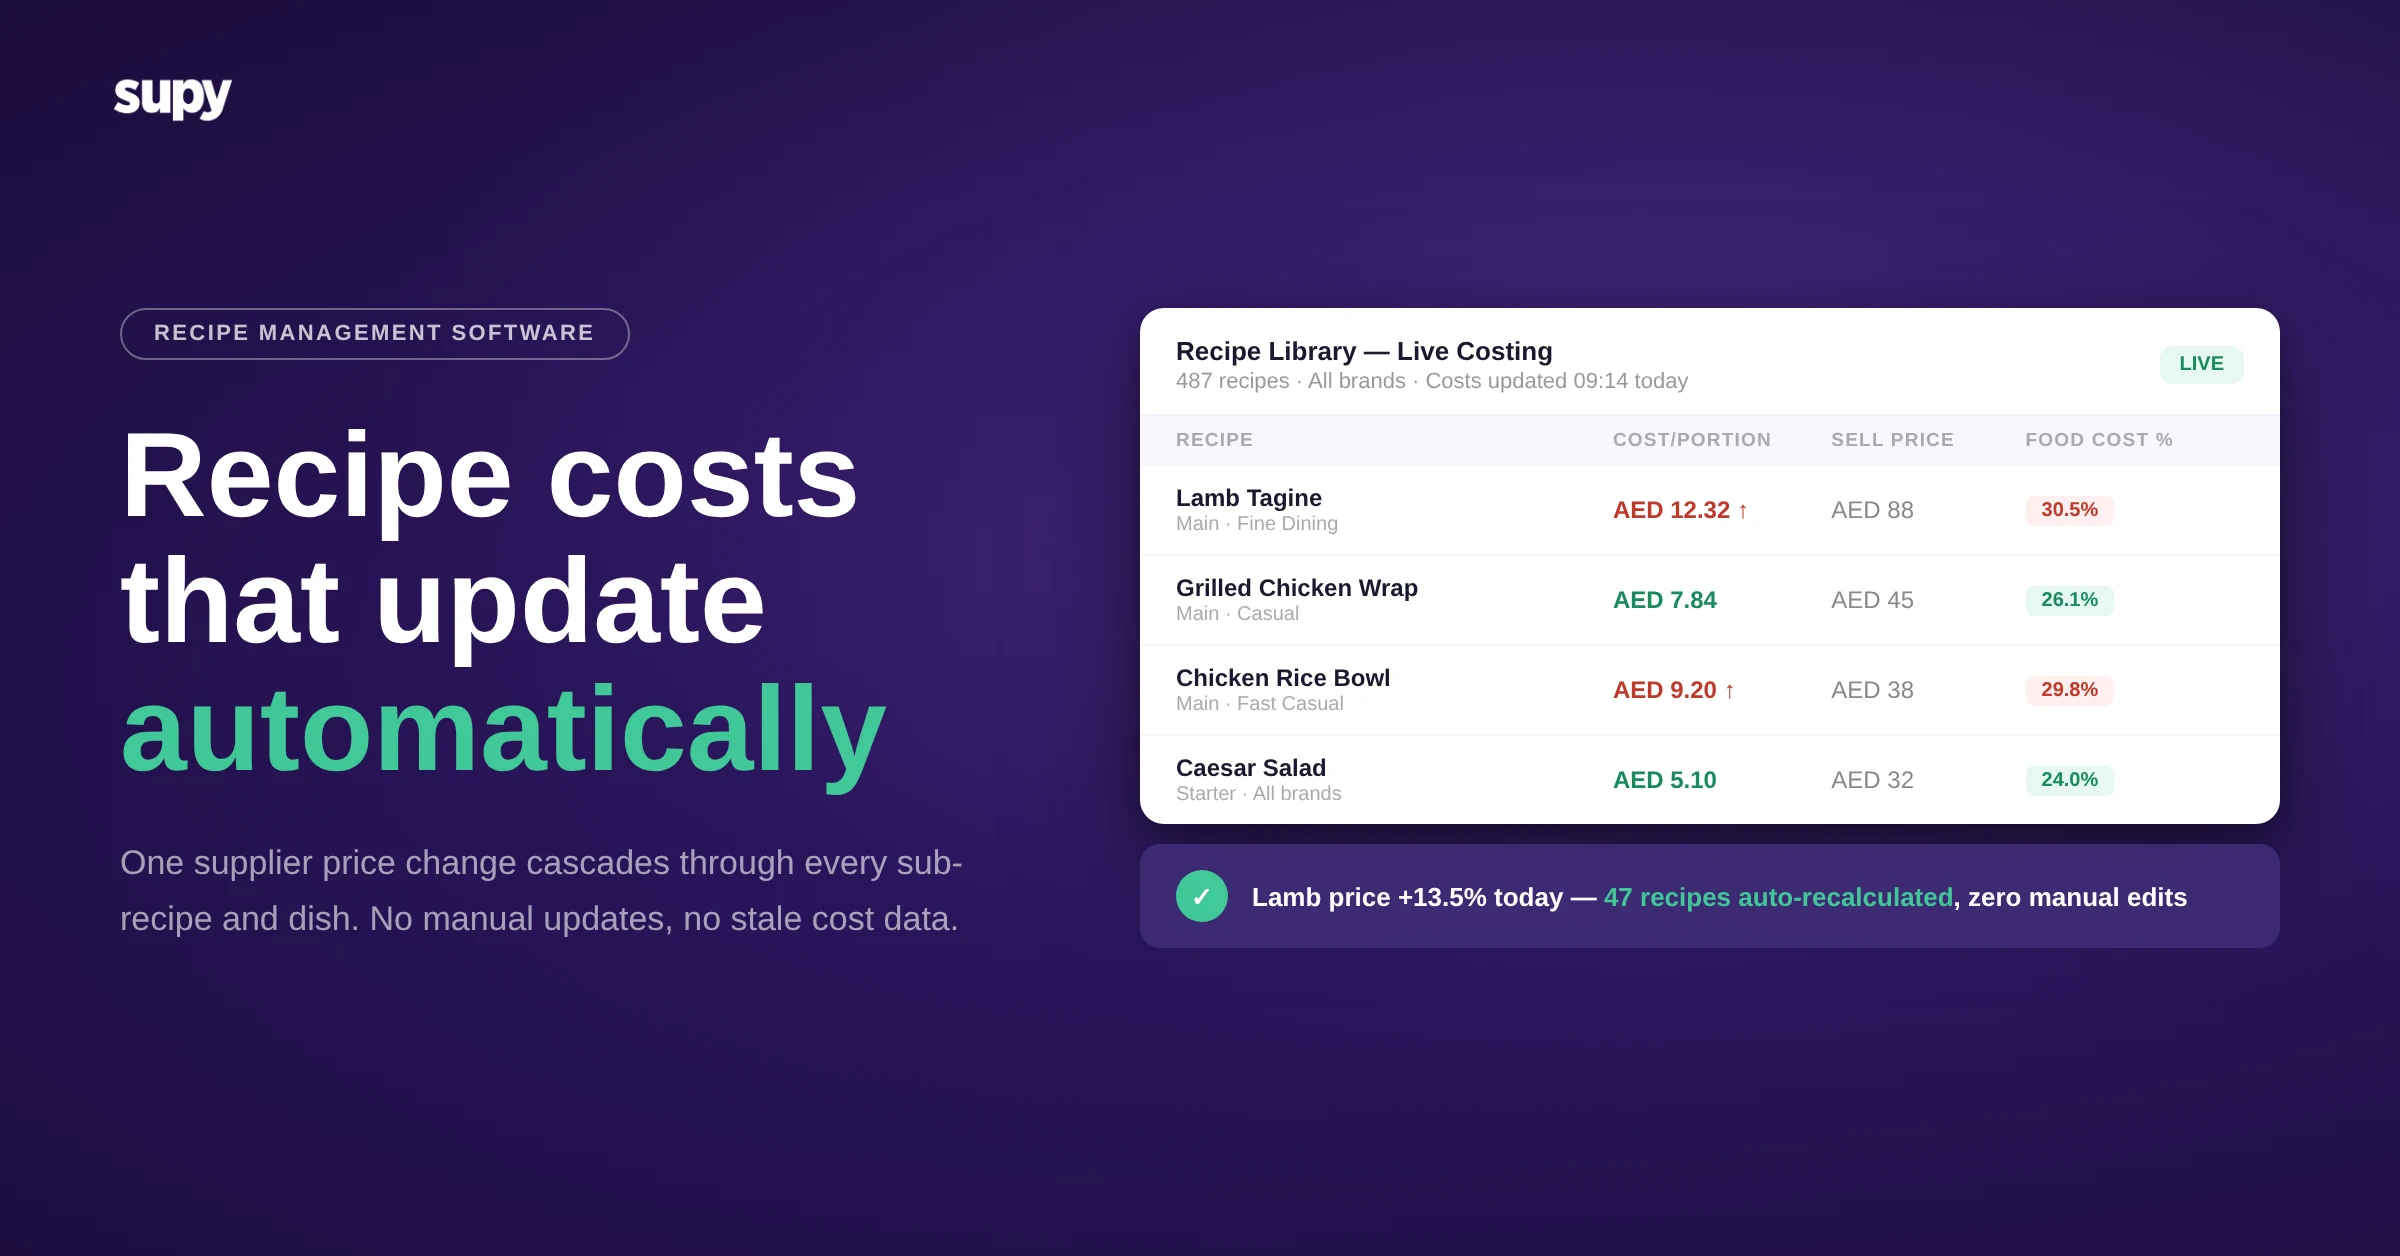
Supy's Recipes and Prep Recipes module tracks prep recipes separately from plated dishes. Each batch deducts ingredients at production time, records the yield and any prep wastage, and creates a semi-finished goods stock entry. The batch cost is visible before it reaches the line. When the prep item is used in a plated recipe, the cost flows through correctly - not as unexplained stock movement.
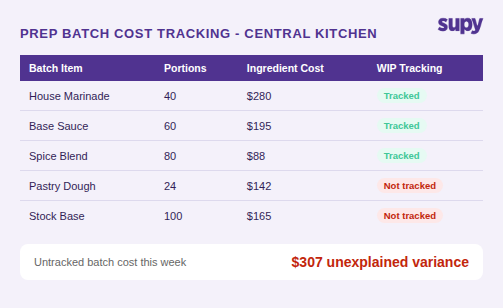
Batch production tracking also captures yield variance: the difference between expected yield from the recipe specification and actual yield from the batch. If a sauce consistently yields 12% below spec, that appears in the production log as a cost risk - not in the P&L three months later as a mystery margin loss. For kitchen managers running 30 or more batch items per week, this turns a guess into a number that can be investigated and fixed.
Variance Without Cause: Turning One Number Into Four
The standard inventory variance report shows a number. It might be -$3,400 for the week across a 6-location group. What it doesn't show is whether that $3,400 breaks down as waste that could be reduced with better prep training, theft that needs an investigation, portioning errors requiring a line check, or a data entry error in a count.
Without cause-level variance tracking, the number becomes noise. Managers know something is wrong. They don't know where to look.
Supy's Wastage Recording module creates the cause layer. Kitchen staff log waste on mobile or desktop: item, quantity, reason category. Categories are configurable - operators define what matters for their operation (prep waste, service waste, spoilage, damage, staff meals). Each log deducts from stock and records to the cost report by category. A week of waste logs produces a breakdown by cause rather than a single negative figure.
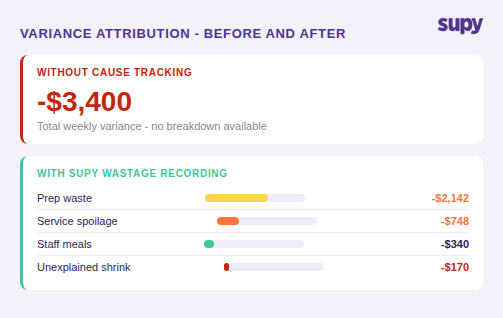
The Dashboards layer pulls this together at group level. Wastage by type, by site, by item, by period - compared across locations. An operator running 6 branches can see that one location's prep waste runs three times the group average. That becomes a training conversation, not a P&L line item with no owner.
Live Stock Visibility adds the theoretical-vs-actual layer: what the system calculates should be on hand based on opening stock, deliveries, and recipe usage - versus what a physical count finds. The gap between those numbers is the unaccounted variance. Because Supy separates recorded waste from the theoretical-vs-actual gap, an operator knows how much of the variance has been explained (logged wastage) versus how much is still unaccounted for (unexplained shrink that needs investigation).
For a kitchen running an 8% food cost variance, separating the explainable from the unexplained is the first step toward closing the gap.
Central Kitchen Management Software: Replacing the Manual Order Aggregation Spreadsheet
Multi-site groups running a central kitchen face a production planning problem that standard kitchen management software doesn't address. Each branch needs product. The central kitchen needs to know what to produce. Without a system that consolidates branch orders automatically, a manager builds a spreadsheet each morning by pulling order quantities from emails or messages into a production schedule.
That process breaks at scale. It introduces transcription errors. It misses orders submitted after cut-off. It produces a production number - "make 200 portions of X today" - that has no connection to current stock already on hand. And it takes 45-90 minutes that could be spent on kitchen management.
Supy's Central Kitchen module handles branch-to-CK ordering natively. Branches raise purchase orders to the central kitchen through the same interface they use for supplier orders. The central kitchen sees consolidated demand per SKU across all branches in one view - what each branch ordered, when they need it, and what the CK currently holds in stock. Delivery notes, pro forma invoices, and billing are part of the same module.
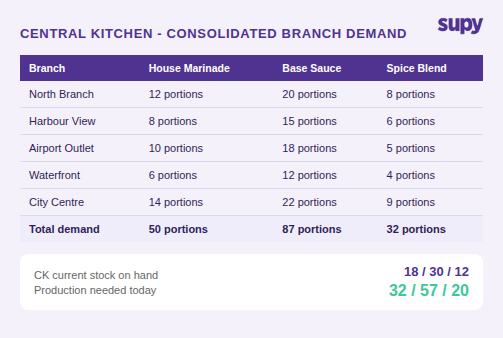
For operators also using AI Predictive Ordering, the loop tightens further: branch demand is derived from AI sales forecasts run through recipes, generating ready-to-submit requisitions to the CK. The kitchen manager reviews consolidated production need against current stock and dispatches accordingly - without a morning spreadsheet.
AI Demand Forecasting and the Over-Ordering Problem
A consistent pattern in multi-site hospitality: purchasing managers over-ordering by 18% on average because the forecast is based on last week's sales, built by someone who doesn't have the event schedule for the coming week.
The immediate cost is visible - extra stock that gets wasted or returned. The less visible cost is cash sitting in freezer and dry store with a 14-day shelf clock running.
Supy's AI Sales Forecasting predicts daily sales per branch, by menu item, for 14 days out. It shows the forecast alongside an 8-week historical average so managers can see each projection in context. Manager overrides are available at the day or item level - useful for events, promotions, or known seasonal shifts - without retraining the model.
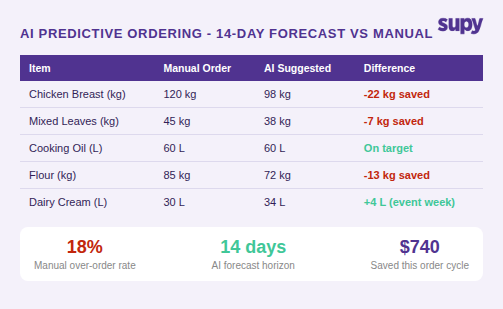
AI Predictive Ordering runs those forecasts through recipes, subtracts current stock, and generates ready-to-submit purchase orders. No auto-send: every line is reviewed before the order goes to the supplier. The purchasing manager sees current stock, projected stock at delivery, last order quantity, and the 4-week average - enough context to confirm the suggestion or adjust it.
Fill to PAR is available for operators not yet on AI Forecasting: order quantities are calculated from live stock versus configured PAR levels. It's a simpler mechanism but closes the most common over-ordering error - ordering product that is already on hand.
Spending Policies and Guardrails can enforce order limits per location, supplier, or category with approval flows up to 5 approvers - so an unusually large order triggered by a forecasting anomaly requires review before it lands with the supplier.
Kitchen Management Software Dashboards: Live Cost Visibility vs End-of-Period Reporting
Most kitchen management software reports food cost after the period closes. The operator finds out on Friday that Tuesday's COGS ran 4% above target. By Friday, the cause is harder to trace and the revenue is already fixed.
Real-time visibility changes the operational rhythm. When a kitchen manager can see live COGS at group and site level during the week, a spike on Tuesday is visible on Tuesday - and the investigation starts while the evidence is fresh.
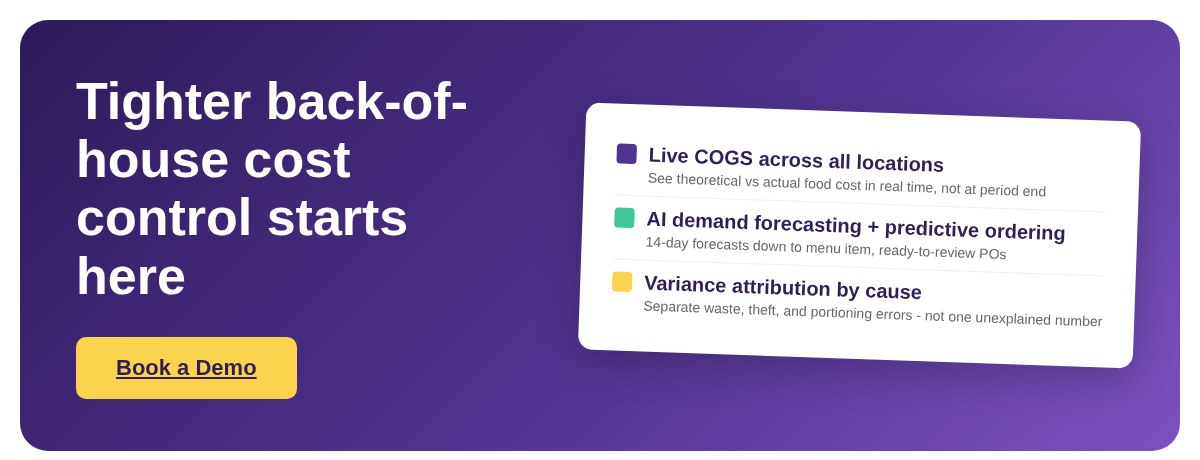
Supy's Interactive Dashboards show live COGS and food cost percentage at group, site, and menu-category level. Theoretical-vs-actual variance sits alongside wastage by type and site - not in end-of-period reports, but as a live view that updates as GRNs are received and stock movements are recorded. Slow-mover identification and profitability by dish are part of the same dashboard with drill-down and export.
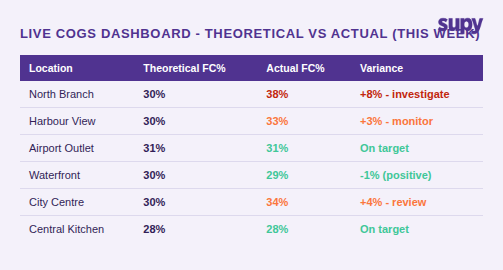
For multi-site groups, the cross-location comparison is the most operationally useful layer. One location running food cost 5% above the group average surfaces immediately. That location becomes the investigation priority for the week - not a discovery at month end.
Integrations with accounting platforms including QuickBooks, Xero, Zoho Books, Wafeq, NetSuite, SAP, and Odoo move COGS data automatically from Supy to the accounts ledger across 75+ integrations. No manual reconciliation between the kitchen management system and the finance team's numbers.
What Closing These Gaps Changes
The back-of-house cost problems that kitchen management software should close are not complicated - they're just invisible without the right data structure. Prep batches that leave no cost trail. Variance numbers that combine four different problems into one unactionable figure. Branch orders aggregated by hand each morning. Forecasts built from the past rather than the next 14 days.
Operators who close these gaps describe the same sequence: first, costs stop being a surprise each month; then, the investigation conversation becomes specific rather than general ("prep waste at Branch 3 is three times the group average" instead of "food cost is up again"); then, the P&L improvement follows because the right manager is having the right conversation about the right number.
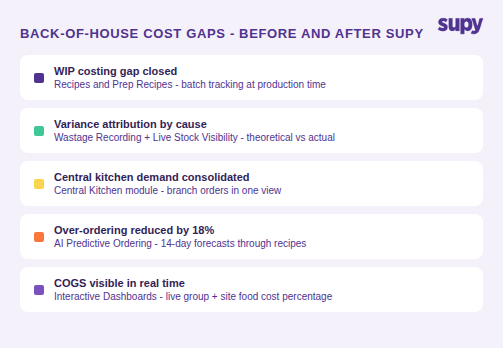
Supy connects procurement, inventory, production, and COGS across all locations without manual sync between modules. For hospitality groups running 3-15 locations, the difference between a kitchen management system that tracks orders and one that tracks cost is where the margin is recovered.