.jpg)


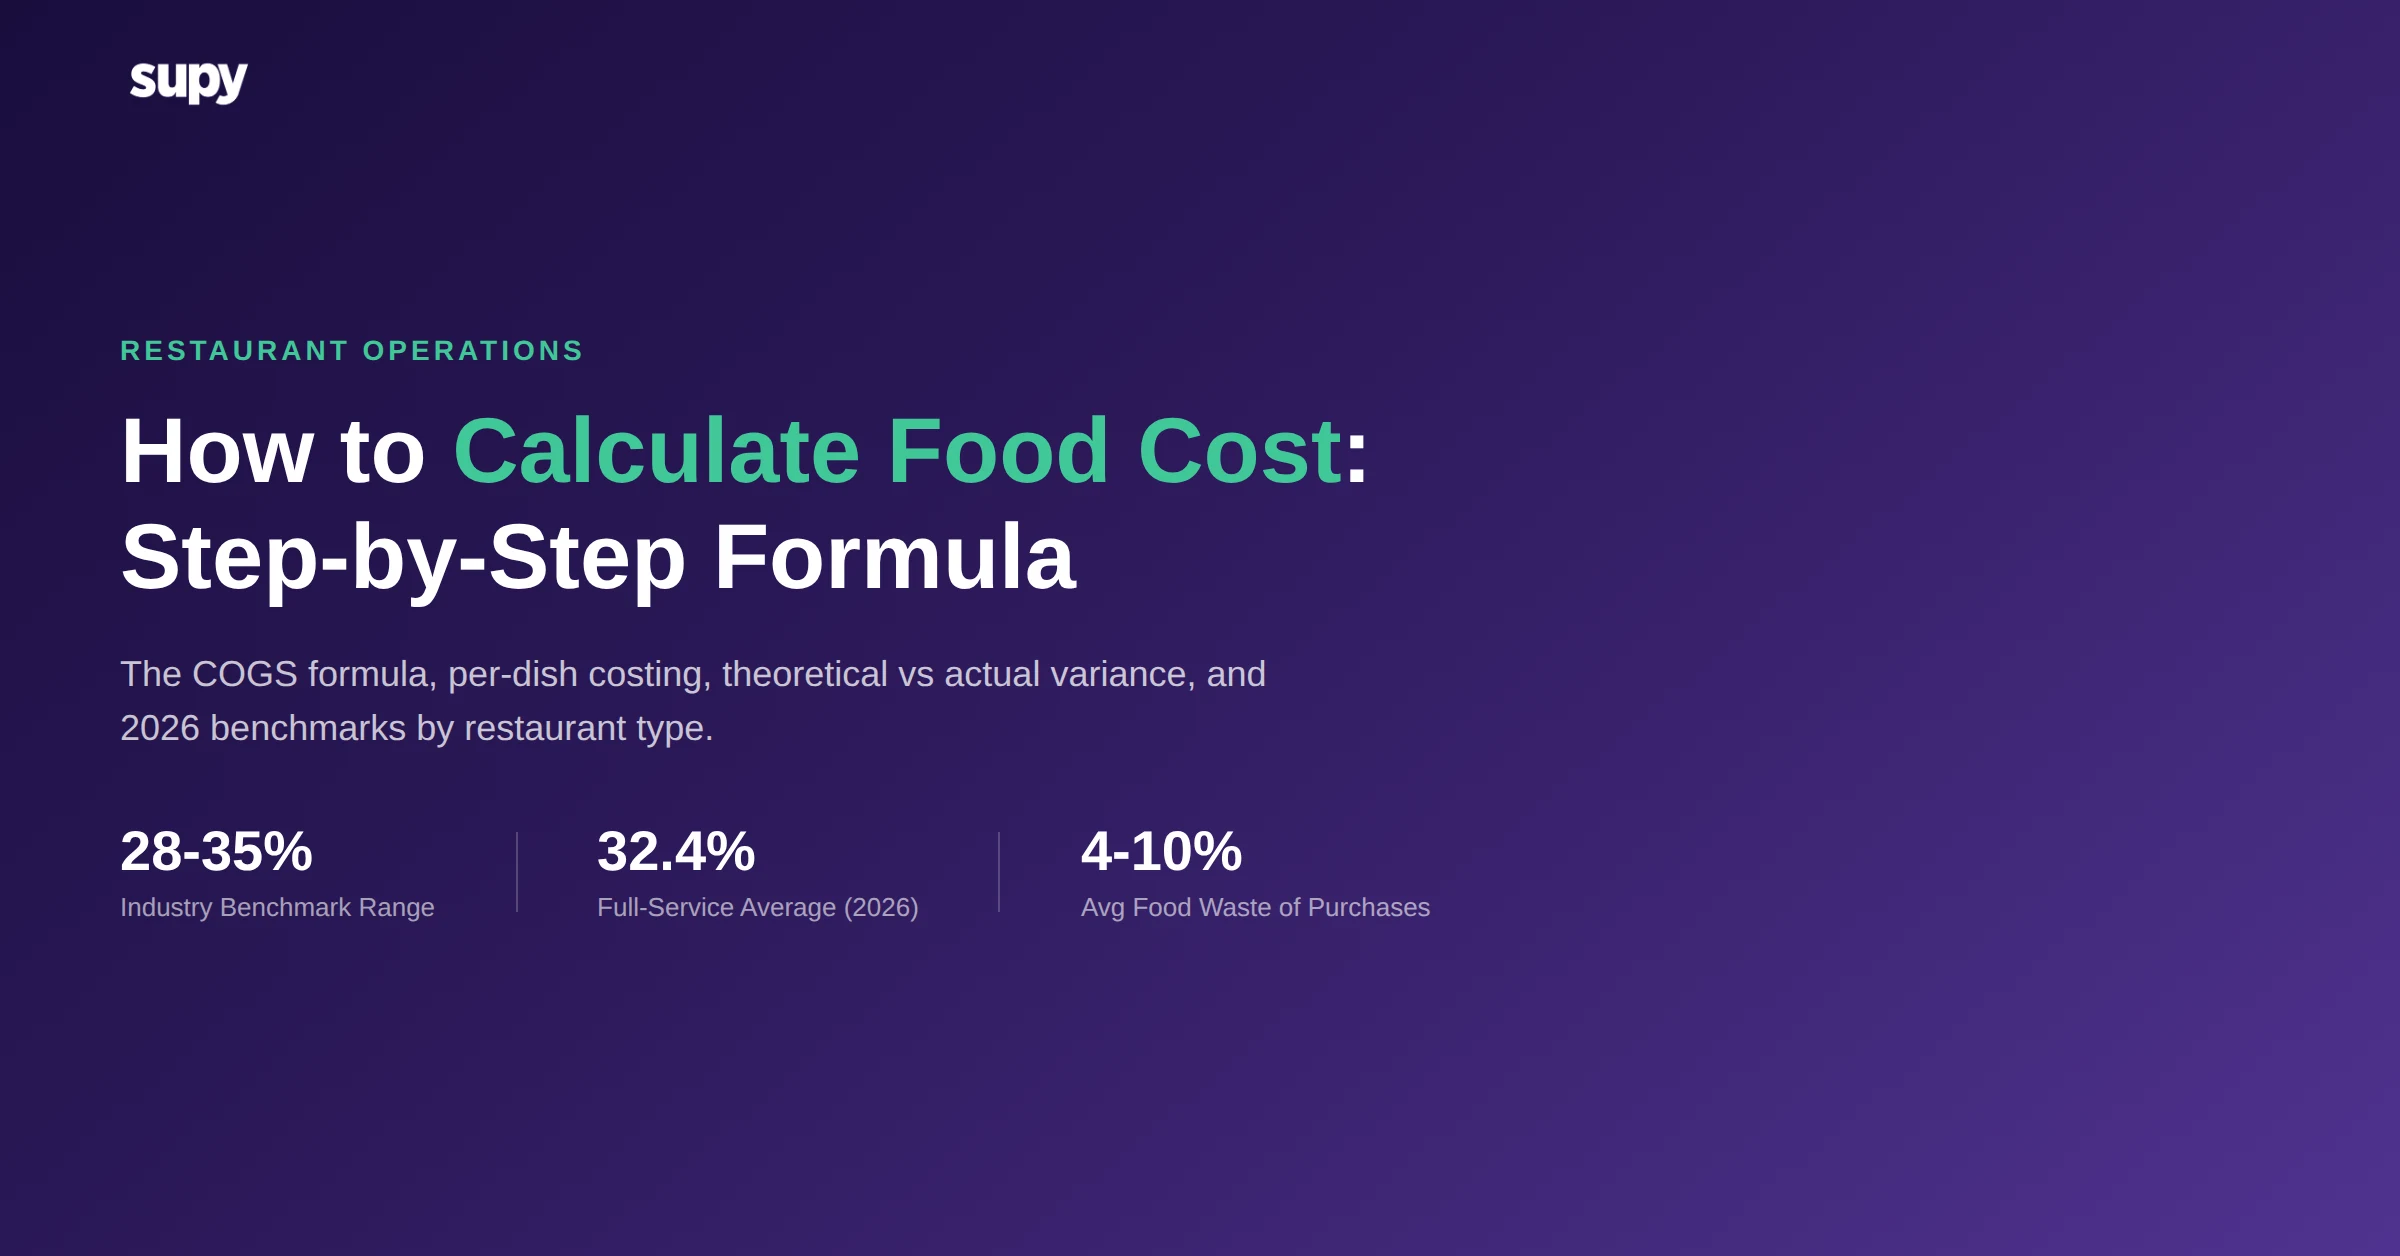
How to Calculate Food Cost: Step-by-Step Formula for Restaurants
How to Calculate Food Cost: The Two Formulas Every Operator Needs
There are two distinct calculations that answer different questions, and conflating them is the first source of confusion.
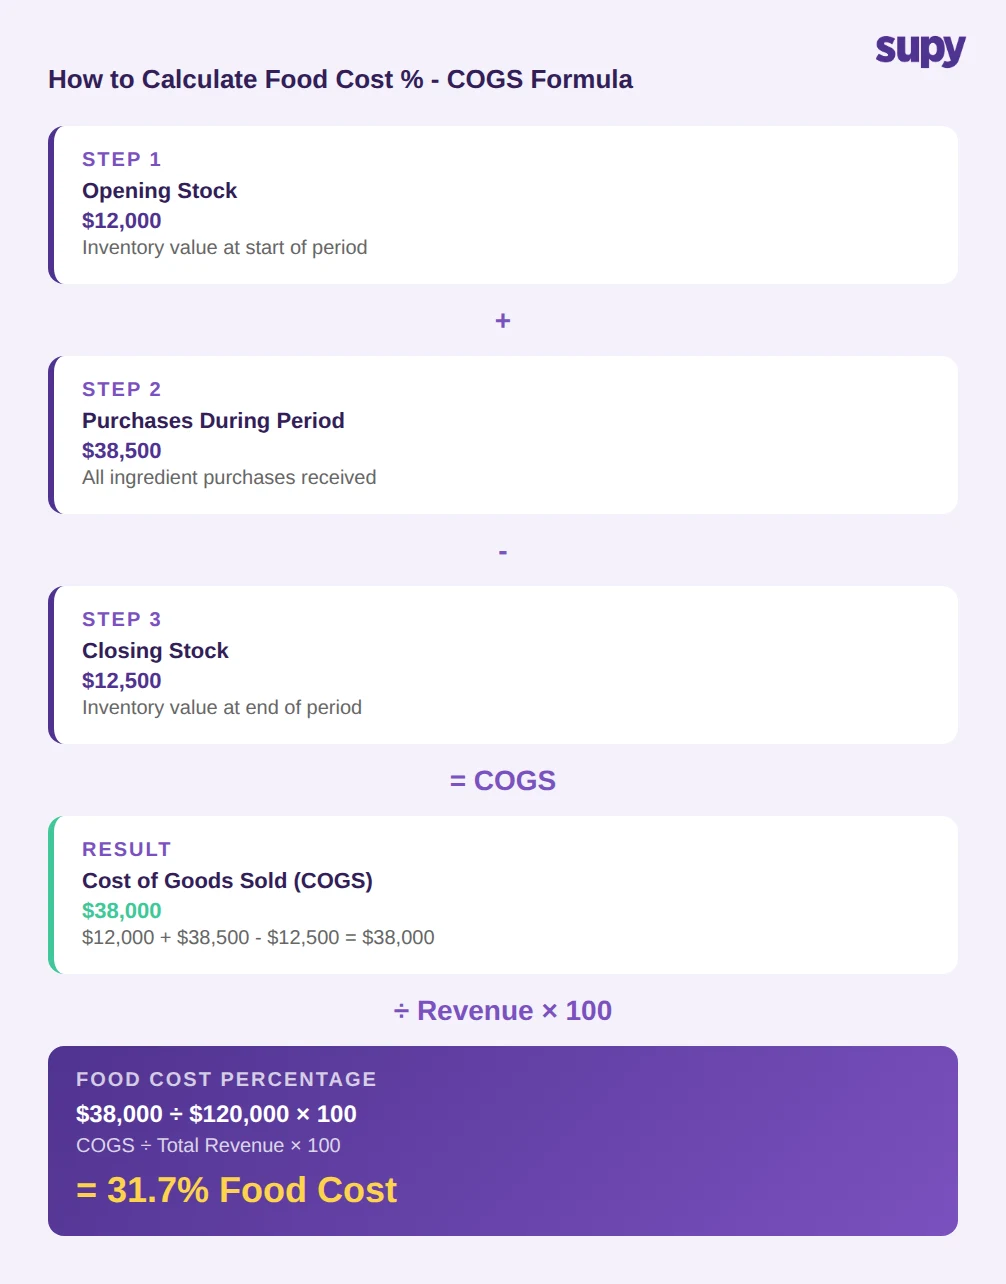
Overall food cost percentage measures what you spent on ingredients as a proportion of revenue over a period - a week, a month, a quarter.
The formula:
Food Cost % = (Opening Stock + Purchases - Closing Stock) / Total Revenue x 100
Where:
- Opening Stock = inventory value at the start of the period
- Purchases = all ingredient purchases received during the period
- Closing Stock = inventory value at the end of the period
- (Opening Stock + Purchases - Closing Stock) = your COGS for the period
Sample calculation: a restaurant opens a month with $12,000 in stock, purchases $38,500 during the month, and closes with $12,500 remaining. COGS = $38,000. If revenue for that month was $120,000, food cost percentage = 31.7%.
Per-dish food cost percentage tells you what a single menu item costs to make as a percentage of its menu price.
Per-Dish Food Cost % = Total Ingredient Cost / Menu Price x 100
If a Grilled Salmon Fillet costs $6.50 in ingredients (220g salmon at $5.28, 80g asparagus at $0.72, 30ml lemon butter sauce at $0.38, 5g herbs at $0.12) and sells for $22.00, the per-dish food cost is 29.5%.
Per-dish calculation feeds into menu engineering: it tells you which items pull your blended food cost up, which anchor it down, and where pricing adjustments deliver the most margin improvement.
What should you do with each number once you have it? For overall food cost %, compare it against your benchmark by restaurant type. For per-dish %, rank your menu items and flag anything above 35% for a price or portion review.
Benchmarks by Restaurant Type (2026)
Benchmarks matter because a 34% food cost that looks alarming at a QSR is unremarkable at a full-service restaurant where labour and table turn are structured differently.
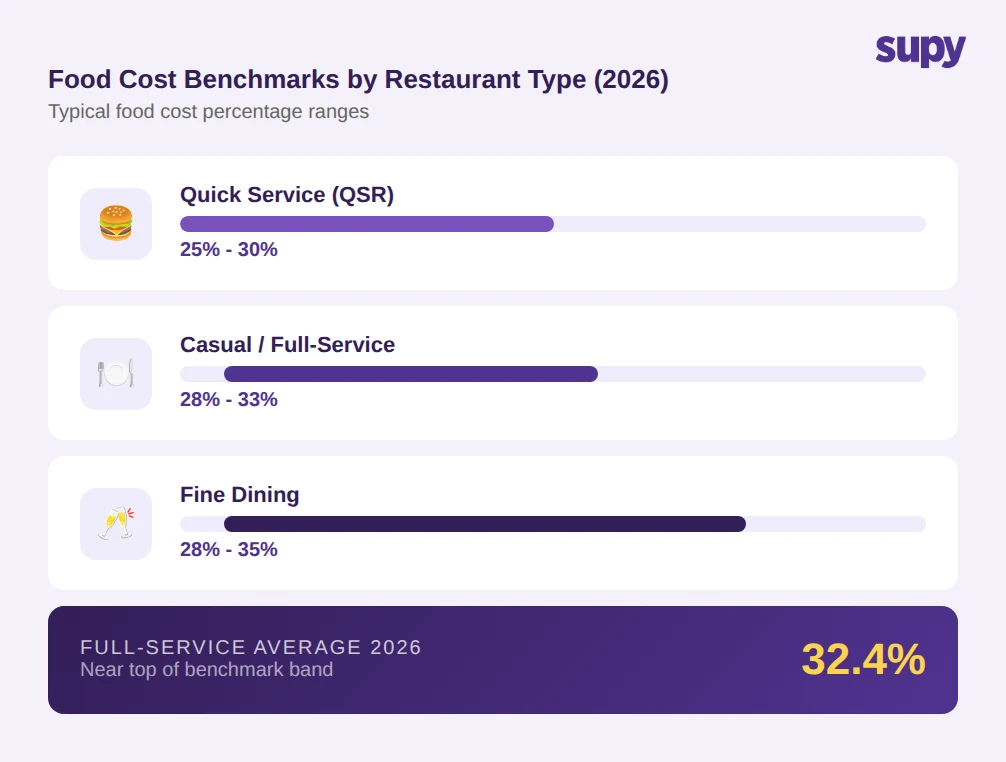
Fine dining runs higher because of premium ingredients; QSRs run lower because of standardised portion control and high volume. Comparing your number against a blanket 28-35% benchmark tells you less than comparing it against your own segment.
The second benchmark that matters is your own: what was your food cost percentage last month, last quarter, same period last year? A number rising quarter-over-quarter, even if within the industry range, signals a problem developing.
Ask yourself: am I comparing my food cost % against the right benchmark, and am I tracking it against my own history - not just an industry average?
Why Ingredient Yield and Shrinkage Change the Calculation
Per-dish food cost calculations fail when they use raw purchase weight instead of yield-adjusted weight. This is the most common arithmetic error in recipe costing.
Salmon arrives as a whole fillet. After trimming, portioning, and cooking loss, a 260g raw fillet yields approximately 220g of served protein - an 85% yield. If you calculate ingredient cost on 220g but buy and pay for 260g, your per-dish cost is understated by 15%.
The corrected formula:
Actual Ingredient Cost = (Purchase Price / Purchase Unit Weight) x (Portion Weight / Yield %)
For the salmon example: ($24.00/kg) x (0.220kg / 0.85) = $6.21 for the salmon component alone, versus $5.28 if yield is ignored. Across a 40-item menu, these understatements compound into a food cost percentage that looks 2-4 points lower than reality.
Prep wastage adds a further layer: trim waste, overproduction, and mise en place loss all sit between raw ingredient and plated dish. Accurate recipe costing accounts for yield, cooking shrinkage, and prep loss separately, each with its own percentage applied to the raw weight.
Before relying on per-dish food cost calculations from a spreadsheet, ask: does each recipe line apply the correct yield percentage for that ingredient in that preparation method?
Theoretical vs Actual Food Cost: The Diagnostic That Most Operators Skip
Theoretical food cost is what your food cost percentage should be, calculated from POS sales data run through your recipes. Every dish sold depletes a calculated quantity of each ingredient. Multiply across all sales for a period: that is your theoretical COGS.
Actual food cost is what you actually spent, calculated from the COGS formula above using opening stock, purchases, and closing stock.
The variance between the two is where the margin goes.
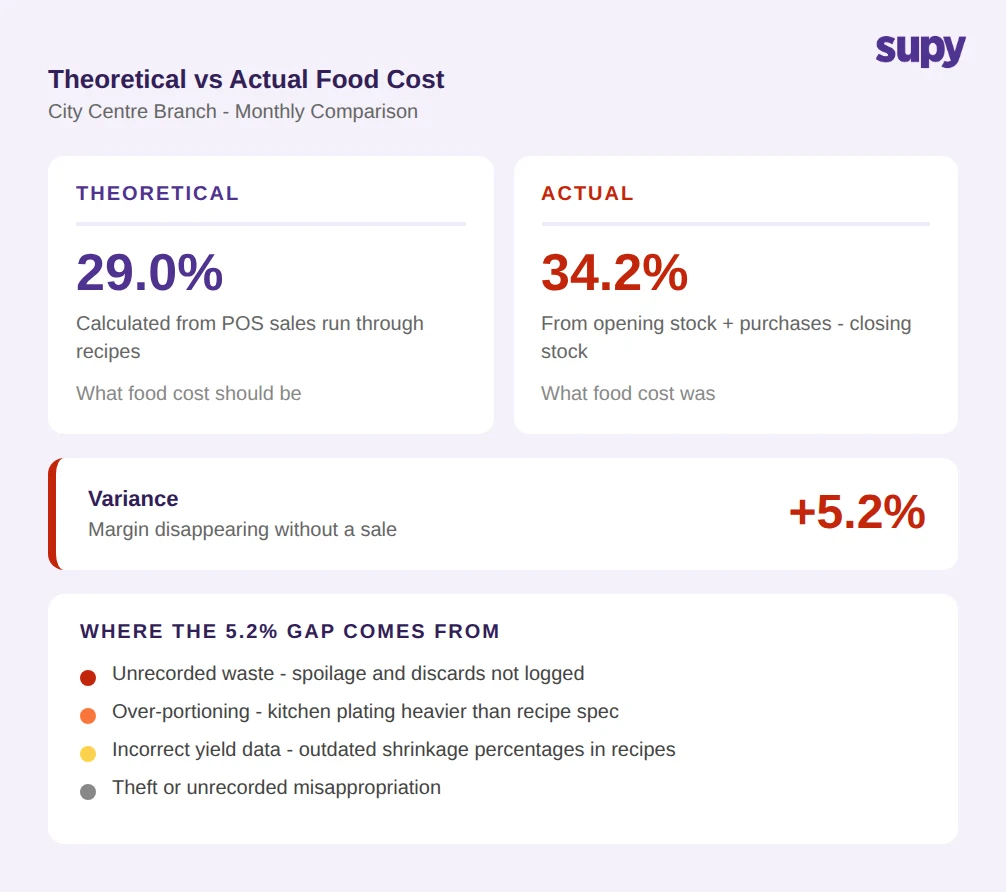
A 5.2% variance - for example, theoretical food cost at 29.0% against actual at 34.2% - represents one of three things: unrecorded waste, theft, or incorrect recipe yield data. Without calculating both numbers, you cannot distinguish between them.
Most competitors and most guides stop at the COGS formula. Theoretical vs actual comparison is the diagnostic tool that turns a single end-of-month number into an actionable investigation. Operators running 8-10 locations cannot physically audit every kitchen every day; the theoretical-vs-actual gap tells them which sites need attention.
Restaurants waste an average of 4-10% of purchased food, accounting for approximately 14% of total restaurant expenses. Only 30% of operators have a formal process to address food waste, despite 58% tracking some aspect of it. A 2% increase in food costs can eliminate 50% of profit margin if not managed proactively. The theoretical-vs-actual variance metric is the starting point for addressing all of these.
Ask yourself: is your operation measuring both theoretical and actual food cost, and if not, which of the four variance causes - waste, over-portioning, yield errors, or misappropriation - is most likely driving your gap?
How to Calculate Food Cost Across Multiple Locations
Single-site food cost calculation is straightforward: one inventory count, one COGS figure, one revenue number. Multi-location calculation introduces aggregation problems that inflate actual food cost relative to theoretical.
The most common issue: basic par management tools do not factor in open purchase orders. A site manager sees current stock below par, places an order, and a second order is already in transit. The result is over-stock on fast-moving items - food cost rises without a corresponding increase in revenue.
Multi-location food cost calculation requires:
- A consolidated view of COGS across all sites for the period
- Per-site breakdowns to identify outliers (a City Centre Branch at 31.2% vs a North Branch at 36.1% points to a specific site problem)
- Inter-site transfer tracking so ingredients moving between locations do not inflate one site's purchases and deflate another's closing stock
- Open PO visibility so reorder decisions account for what is already ordered, not just what is in the storeroom
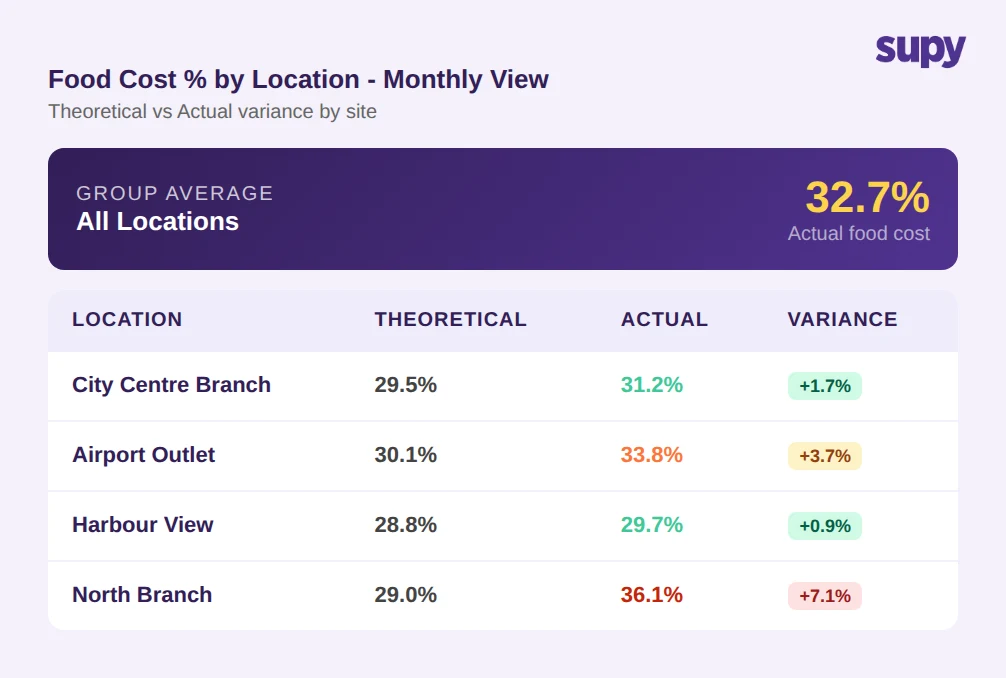
The group-level food cost percentage in isolation is a blended average that masks underperforming sites. The diagnostic value comes from the distribution across sites and the gap between theoretical and actual at each one.
Before expanding to additional sites, ask: does your current system consolidate COGS and theoretical-vs-actual variance at the group level automatically, or does someone have to compile it manually from separate site reports?
How Recipe Costing Software Closes the Gap
Manual food cost calculation has a structural problem: the data required (opening stock values, purchase prices, closing stock counts, recipe yields) comes from multiple sources, at different frequencies, with different degrees of accuracy. An end-of-month spreadsheet is already two to four weeks out of date by the time it informs a decision.
Recipe costing software addresses this in two ways.
First, it attaches yield and shrinkage to each ingredient at the recipe level and links those recipes to POS menu items. When a dish sells, the system depletes the correct yield-adjusted quantity of each ingredient automatically. Theoretical food cost updates with every transaction.
Second, it connects that theoretical figure to live inventory data - GRN receipts, waste logs, transfer records - to calculate actual food cost in near-real-time. The gap between theoretical and actual is visible continuously, not at month-end.
For multi-location operators, the platform aggregates both figures at group, site, and menu-category level. A site running 7 points above its theoretical food cost appears on a dashboard before the month closes, not in a spreadsheet after it.
Supy's Recipes and Prep Recipes module attaches yields, shrinkage, and prep wastage to each dish and links to POS menu items so sales automatically deplete the correct ingredients - enabling theoretical food cost calculation at the recipe level without manual entry. Supy's Interactive Dashboards surface live COGS and food cost percentage at group, site, and menu-category level, with theoretical-vs-actual variance and wastage breakdown. For operators managing multiple sites, this replaces an end-of-month reconciliation exercise with a continuous visibility layer.
If you are evaluating recipe costing tools, the key questions are: does it apply yield percentages per ingredient per prep method, does it link directly to your POS without manual exports, and does it calculate theoretical vs actual variance at the site level in real time?
Beyond Food Cost %: Contribution Margin and the Next Step
Food cost percentage measures the cost side. It does not tell you which menu items actually generate the most cash.
Contribution margin per dish = Menu Price - Food Cost
A dish with a 28% food cost on a $14 item contributes $10.08. A dish with a 34% food cost on a $28 item contributes $18.48. The higher food cost percentage dish generates $8.40 more margin per cover.
Menu engineering uses contribution margin alongside sales volume to categorise items:
- High margin, high volume: protect and promote
- High margin, low volume: promote more aggressively
- Low margin, high volume: review pricing or portion cost
- Low margin, low volume: candidate for removal
Once food cost calculation is accurate - meaning yields are correct, theoretical vs actual is tracked, and multi-site aggregation works properly - the natural next step is using that data to make menu decisions that improve blended margin, not just reduce individual item cost percentages.
The formula is straightforward. The operational discipline to feed it accurate data is not. That is the actual challenge food cost calculation presents for most operators.
The decision point: once your food cost percentage is accurate, are you using it only to monitor costs, or are you using it alongside contribution margin to actively engineer a more profitable menu?

