How a Food Recipe Management System Links Recipes to Sales and Stock

What a Food Recipe Management System Does in a Commercial Kitchen
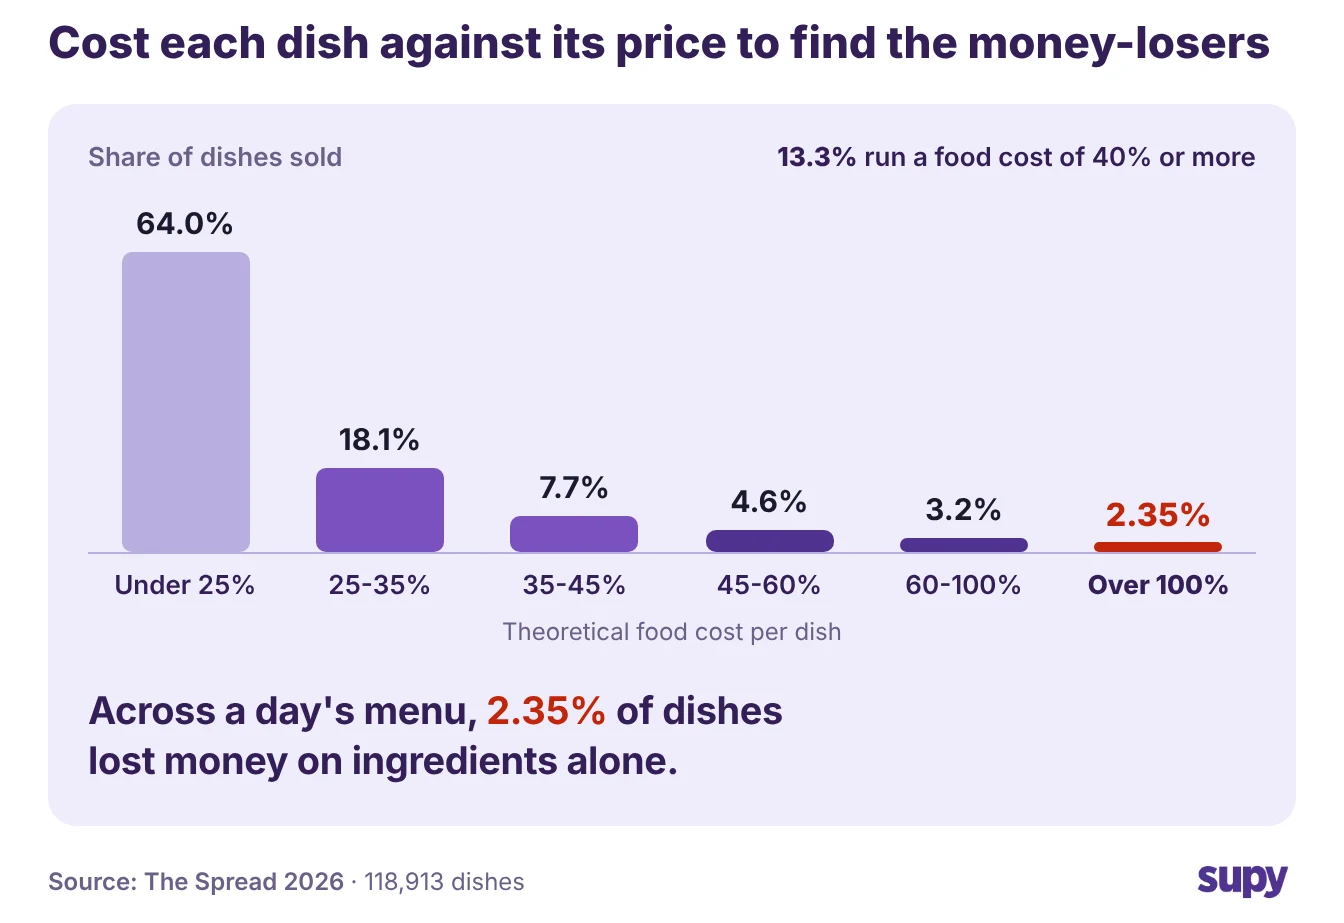
In a commercial kitchen, unmapped sales items like set menus, combos and open food buttons quietly break food-cost reporting. The consumer recipe apps that top this search never touch that. A food recipe management system links every recipe to your point-of-sale sales and live stock, so each dish you sell reports a real cost. It is worth doing, because 1 in 7 dishes already runs a theoretical food cost of 40% or more, by Supy's The Spread 2026. This article shows how the link works, where it breaks, and what to compare before you buy.
That figure comes from 118,913 dishes sold in a single trading day, where 2.35% of them, about 1 in 40, lost money on ingredients alone (The Spread 2026).
- Theoretical food costs. These are theoretical food costs, costed from the recipe, so the real plate cost runs higher once waste and over-portioning are counted.
- Average food cost. An average menu food cost does not show how much food cost varies from dish to dish.
- Dishes losing margin. The dishes losing margin are rarely the ones a chef would guess, so you find them only when each recipe is costed against its real selling price and its real ingredient usage.
A recipe folder in a drawer cannot do that. Neither can a set of spreadsheets, Word documents and WhatsApp messages, which is the fragmented baseline most recipe management software replaces.
- Holds plated dishes. A food recipe management system holds your plated dishes and the prep recipes behind them.
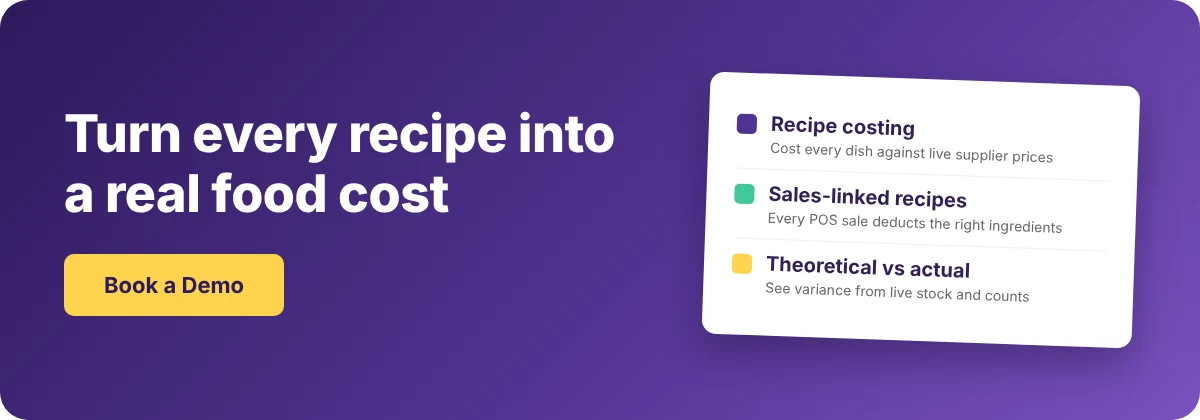
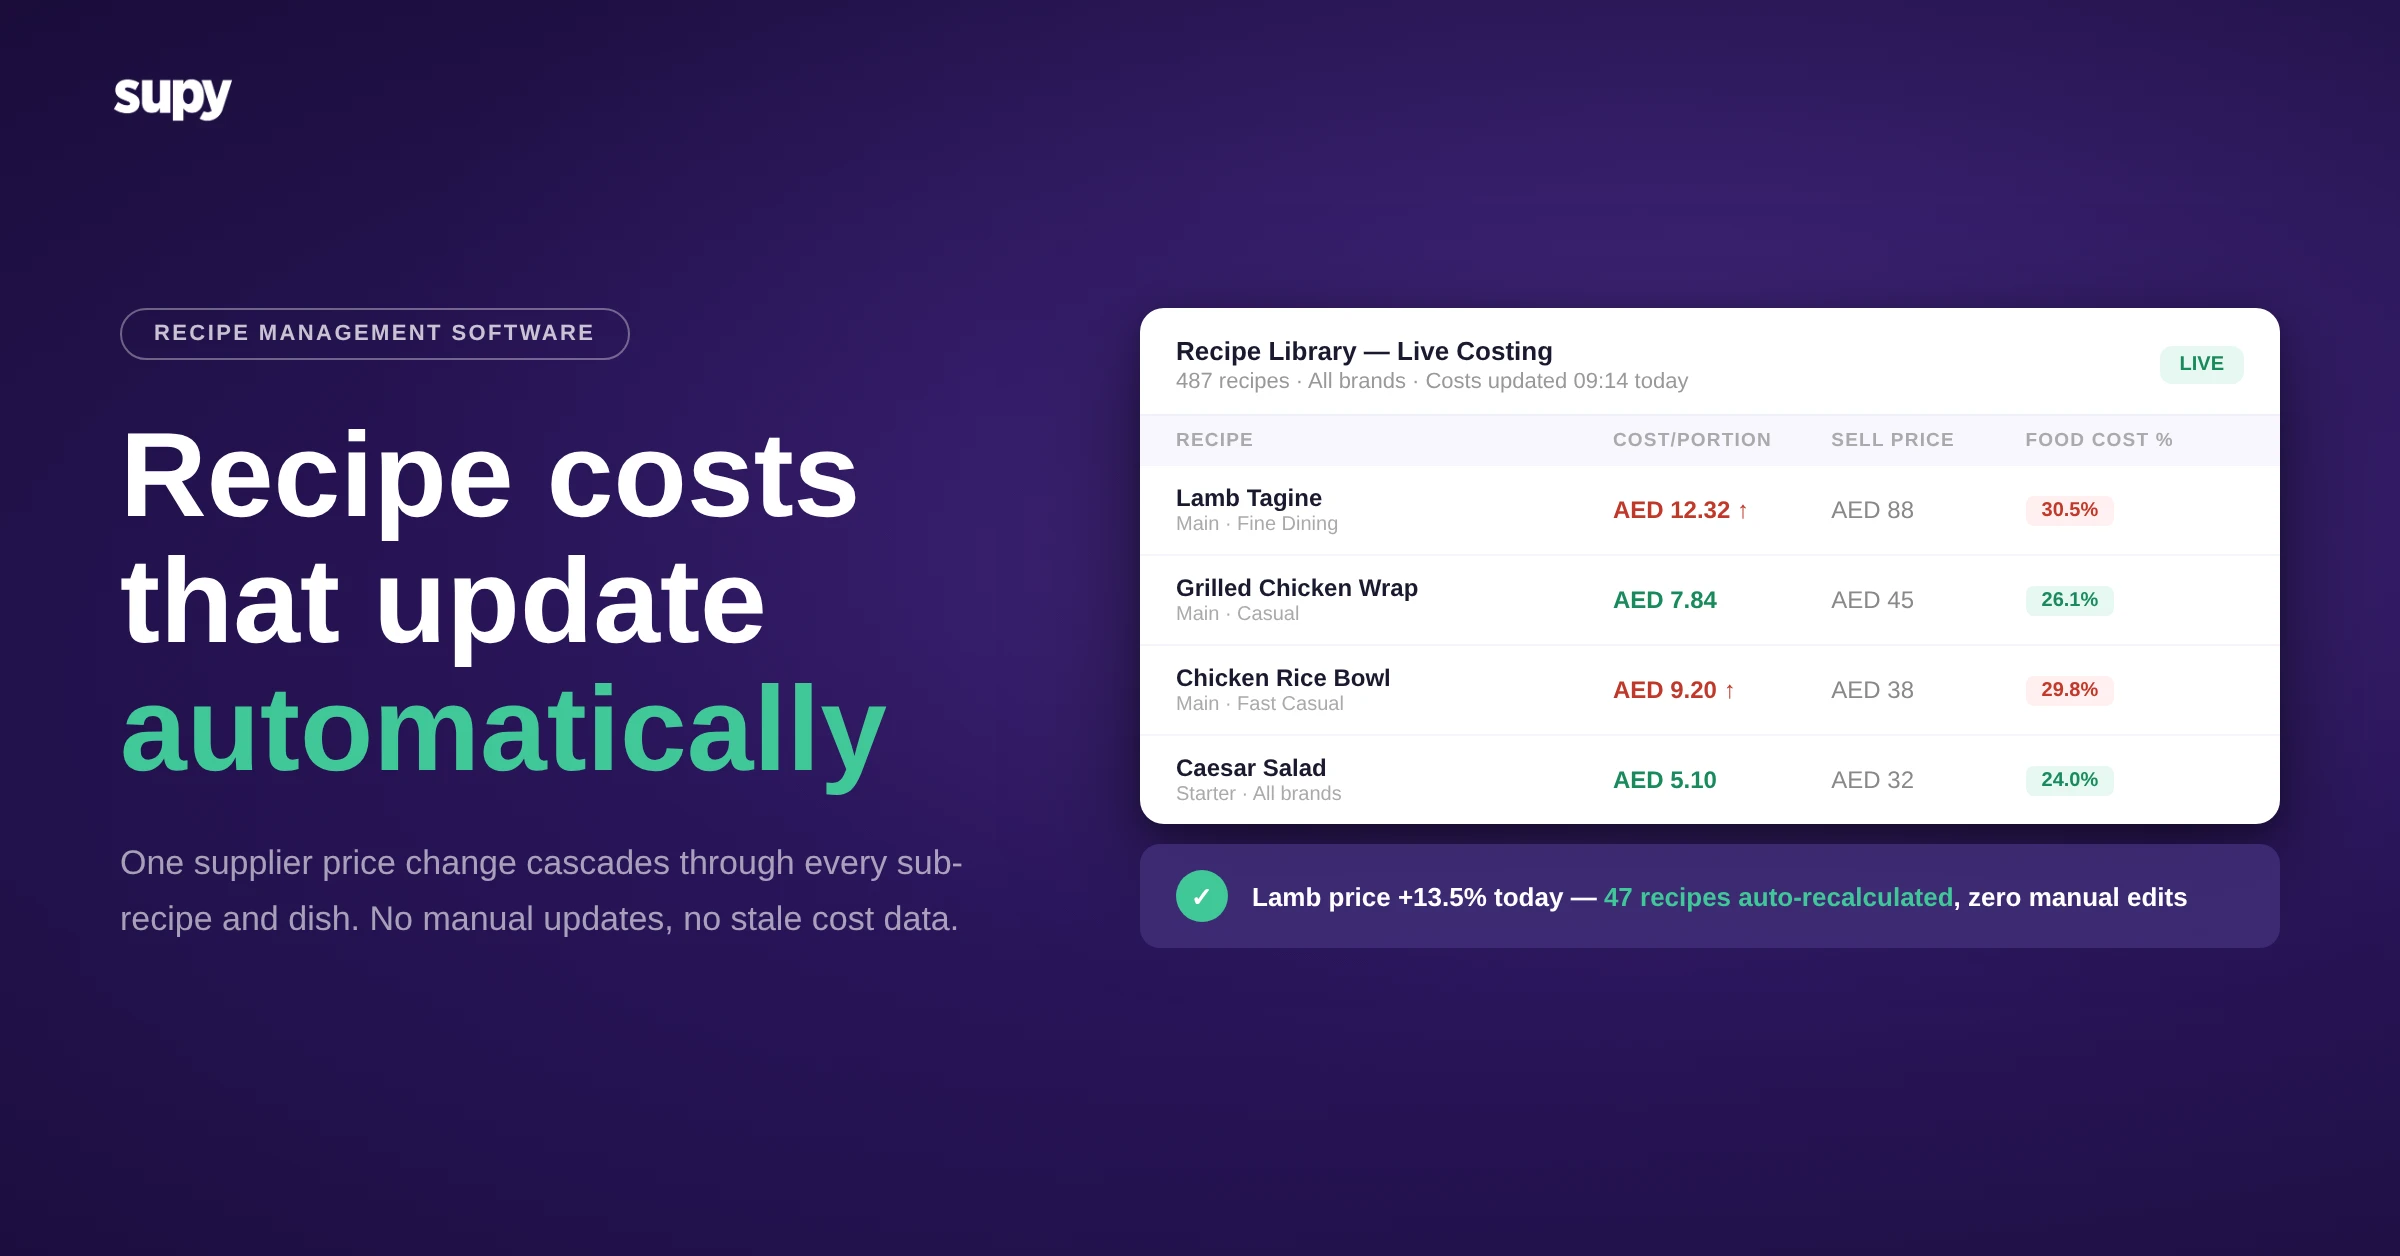
- Links to POS. It links each one to the POS menu item that sells it, and keeps your recipe costing current as supplier prices move.
- Every branch reads. For a multi-site group, every branch reads from one costed recipe book, so a new ingredient price flows through to every plate at once.
Recipe costing rarely stands alone. The operators weighing it usually weigh cost of goods sold, demand forecasting and purchase approvals at the same time, because a recipe connects all of them.
Every Sale Has to Resolve to a Recipe
Costing breaks at the till, not in the recipe book.
- Resolve to recipe. Every sale has to resolve to a recipe, because that link is how the system knows which ingredients left the shelf and what they cost.
- Draws down ingredients. When a menu item points to its recipe, selling it draws down the exact ingredients in the exact quantities, so theoretical food cost and stock usage update on their own.
The sales that get missed are the ones with no clean link to a single recipe. Set menus, package deals, combos and the open food and beverage buttons staff use for anything off-menu all ring up revenue.
When they map to no recipe, they draw down no stock. Food cost then looks better than it is, the stock count never ties out, and variance reporting blames the wrong sections. On a busy service that can be a large share of covers going uncosted, and nobody notices for weeks, until someone asks why the numbers will not reconcile.
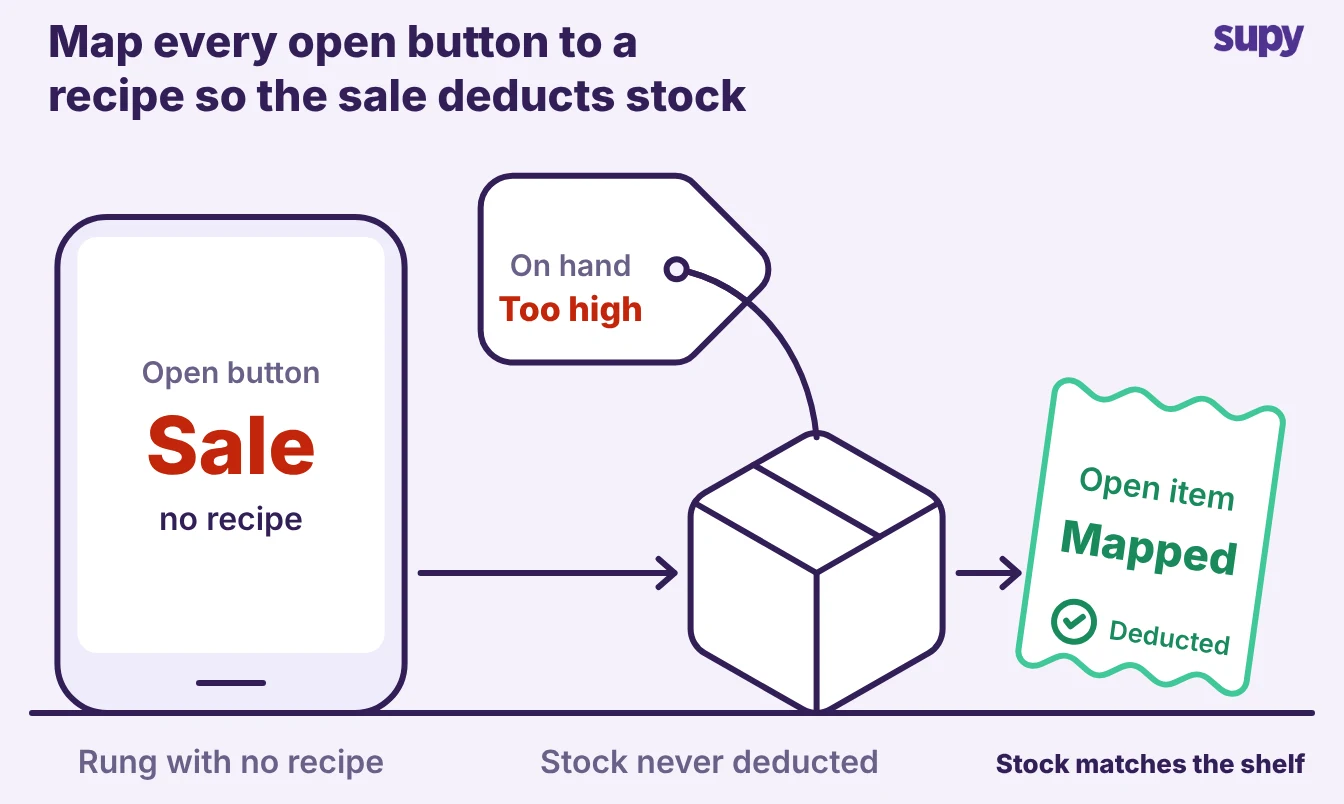
A food recipe management system closes this by forcing every sellable item onto a recipe, including the component dishes inside a set menu or combo. It also reads POS modifiers, so a "no cheese" or an "extra patty" changes the stock drawn down.
Supy links recipes to POS menu items and their modifiers so each sale depletes the right ingredients. An open button still needs a home: a good system lets you route it to a catch-all recipe or flag it for mapping, so those sales still reach costing.
Linking Recipes to Live Stock Turns Guesswork Into Variance
The second link is to stock. Once a recipe is tied to live stock, the system carries two numbers.
- Theoretical usage. Theoretical usage is what the recipes say you should have used.
- Actual usage. Actual usage is what the count and the deliveries say you did use.
- The variance. The difference is variance, and it is where over-portioning, waste, theft and mis-ringing show up.
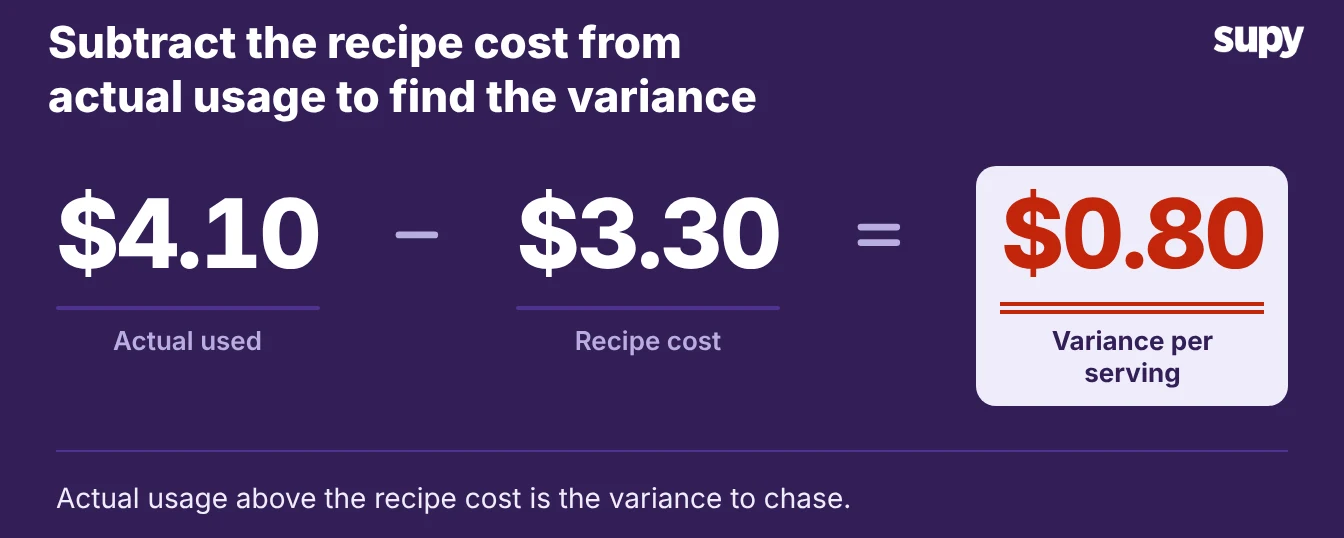
Say a burger's recipe costs $3.30 in ingredients and the burger sells for $12.00. Its theoretical food cost is 27.5%.
If the count shows the kitchen actually used $4.10 of ingredients per burger, the real food cost is 34.2%. The $0.80 gap per serving is the variance to chase, and across a week of covers it is the difference between a healthy plate and one quietly losing money.
Live stock visibility is what makes the actual side real.
- No manual sync. Stock on hand updates from goods received notes and from recipe usage, with no manual sync.
- Reflects what happened. The theoretical-versus-actual line then reflects what happened, not what someone remembered to type in.
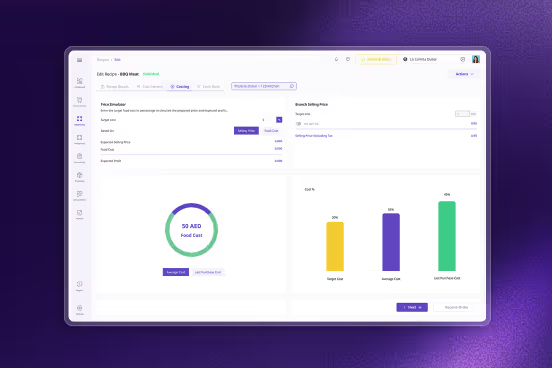
- Target cost alert. You can set a target cost per dish and get an alert when one drifts over it, so you catch it in the week it happens, not at month end.
Supy calculates each dish's food cost against the selling price excluding VAT, so the percentage is not inflated by sales tax and compares cleanly across the menu. Costs read in your own currency with the right decimal places on both the web app and mobile.
A plate cost looks the same whether a chef checks it on the line or a finance lead checks it from head office.
The Sales That Are Hardest to Cost
The hardest items to cost are the ones that do not map to a single recipe. Test any system against these before anything else, because they are where costing quietly fails and where consumer recipe apps have nothing to offer.
| Sales type | Why it is hard to cost | What a good system does |
|---|---|---|
| Set menus and package deals | One price covers several dishes, so the sale ties to nothing | Splits the sale into its component recipes, each drawing down its own stock |
| Combos and modifiers | Extra patty or no cheese changes the real ingredient cost | Reads POS modifiers and adjusts the stock drawn down per sale |
| Open food and drink buttons | Staff ring up off-menu items that match no recipe | Routes them to a catch-all recipe or flags them for mapping |
| Catering and delivery sales | Bulk portions and platform orders carry no per-item link | Maps platform and bulk items to recipes so they still deplete stock |
Catering and sharing-tray orders are the clearest trap. They sell in bulk portions with no per-item price, and delivery-platform sales often show as unmapped until someone syncs them to menu items. Each one is revenue the kitchen served and stock it used, so leaving them uncosted understates food cost on exactly the orders that move the most product.
Recipe-Keeper Apps vs a Restaurant Costing System
A food recipe management system and a recipe-keeper app look similar in a demo and do opposite jobs. The app stores and organises recipes for a cook.
The costing system treats a recipe as the link between a sale and the stock it consumes. The table below shows what most buyers need to see before they shortlist anything.
| What you need | Recipe-keeper app | Restaurant costing system |
|---|---|---|
| Store and scale recipes | Yes | Yes |
| Live ingredient cost from supplier prices | No | Yes, updates as prices change |
| Link to POS sales | No | Yes, every sale maps to a recipe |
| Theoretical vs actual food cost | No | Yes, from live stock and counts |
| Dish-level profitability across sites | No | Yes, one book for every branch |
| Handles set menus, combos and open buttons | No | Yes, splits and routes them |
If the shortlist is really between a recipe organiser and a costing system, the deciding question is whether you need recipes for reference or recipes for margin. Reference work is fine in an app. Margin work needs the sales and stock links, or the food-cost number on screen is a guess.
What to Check in a Demo Before You Commit
Recipe costing only pays off if the setup holds and the links stay clean, so press on the parts that break in the real world. Teams often send recipes ahead of go-live.
Then they learn late that they still have to map each sales item to a recipe by hand, which doubles the work. Ask who does that mapping and how long a site of your size takes.
| What to check in the demo | What good looks like |
|---|---|
| Recipe and sales-item mapping | Bulk import loads your recipes, and you can see exactly how each POS sales item links to a recipe |
| Set menus, combos and open buttons | Ringing up a combo or an open button draws down the right stock on screen, not nothing |
| Theoretical and actual food cost | Both numbers appear, with a variance line fed by live stock and counts |
| Dish profitability across sites | One recipe book serves every branch, and you can see which dishes lose money by location |
Run those four checks and the choice usually makes itself. The right system maps every sale to a recipe and every recipe to live stock. That is what turns your menu into numbers you can act on, dish by dish and site by site.