.jpg)


Best AI Tools for Restaurants: The Back-of-House Evaluation Guide for Multi-Unit Operators
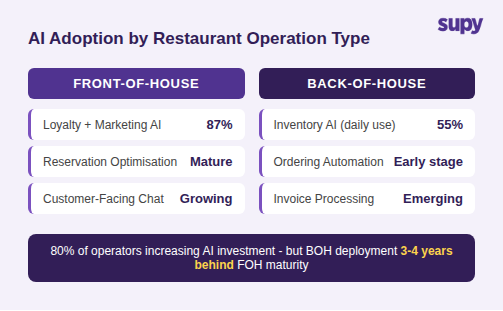
The Back-of-House AI Gap: Why 80% of Operators Invest but Only 55% Use It Daily
Deloitte's 2025 restaurant study shows 80% of restaurant executives are actively increasing their AI investments. The same study shows 55% use AI in inventory management daily. The gap between investment intent and daily operational use is the actual evaluation problem most comparison guides skip.
Front-of-house AI - loyalty programmes, customer-facing chat, reservation optimisation - reached maturity earlier because it integrates into existing customer interaction points with minimal data prerequisites. Back-of-house AI (forecasting, inventory, ordering, invoicing) requires clean historical data, recipe mapping, and supplier connectivity. Operators who purchase back-of-house AI tools without those prerequisites typically end up with a system that works in demos but underperforms in live operation.
The cost of the gap is measurable. Multi-unit restaurant operators lose an estimated 40% of purchased food to waste. The operators who close that gap use back-of-house AI as an operational system, not a reporting tool - and they set it up against clean data foundations before expecting results.
Before evaluating any vendor: Identify which back-of-house workflow generates the highest variance cost in your current operation - forecasting, inventory counting, ordering, or invoice reconciliation. That workflow is where AI delivers the fastest return.
AI Demand Forecasting: The Data Readiness Test Before You Evaluate Vendors
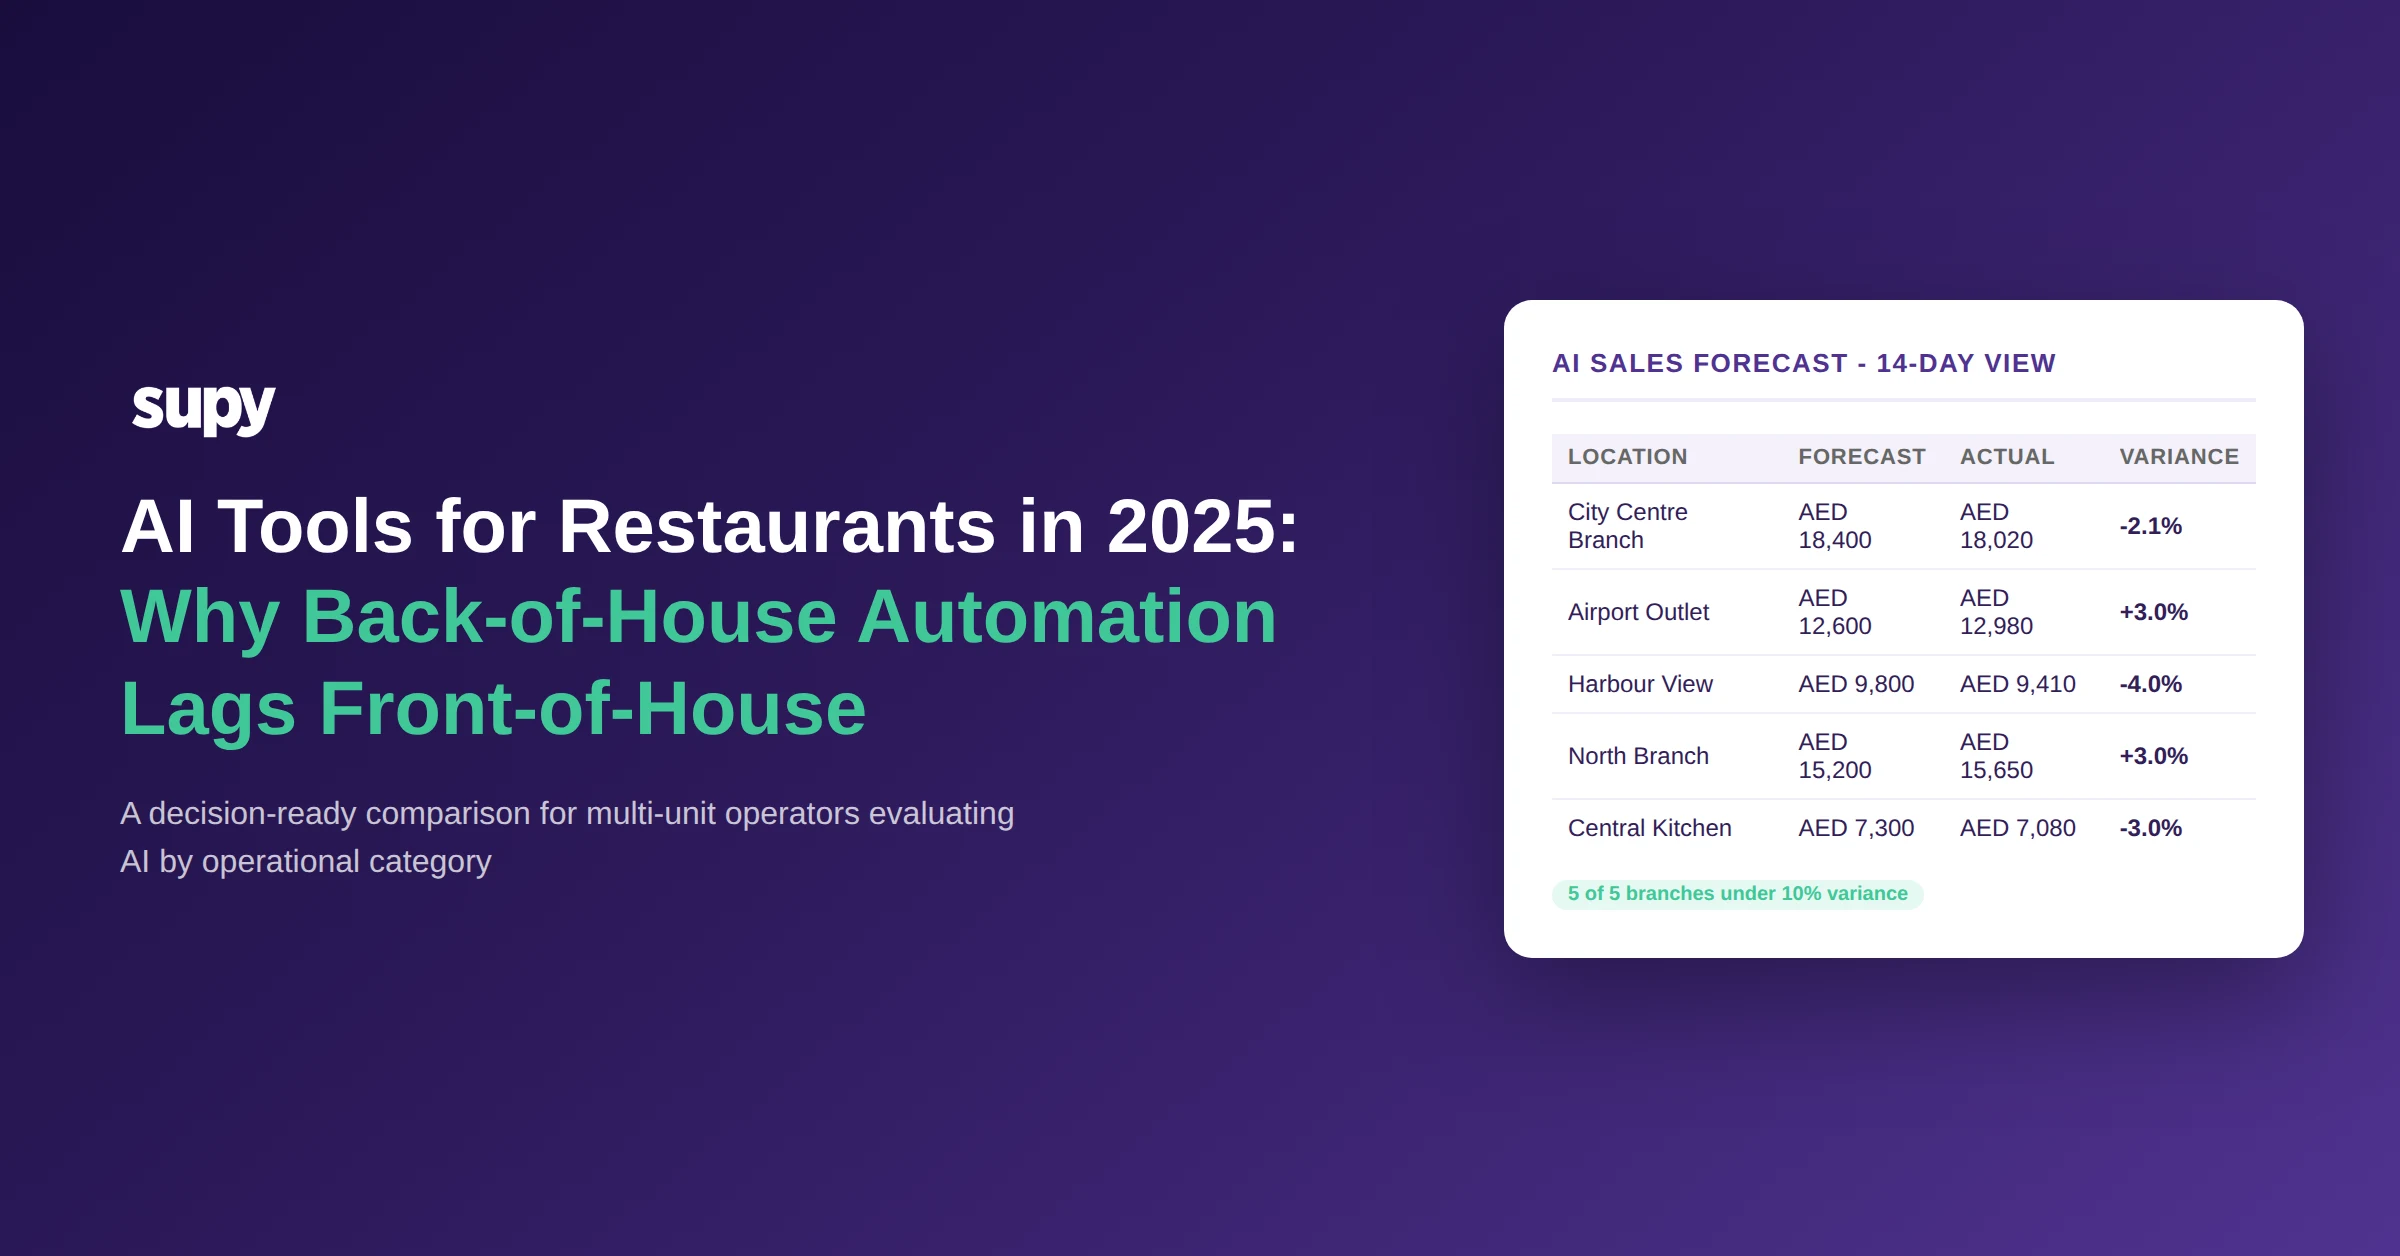
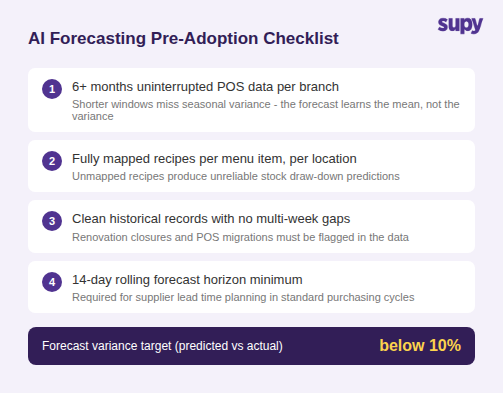
AI sales forecasting tools predict daily sales by branch, by menu item, for a rolling 14-day window. The forecast drives downstream decisions: how much to order, when to order it, and what par levels to set per SKU. When the forecast achieves below 10% variance between predicted and actual sales, those downstream decisions improve automatically. When it does not, errors compound: over-forecasting drives over-ordering; under-forecasting drives stockouts.
Want the numbers for your own kitchen? The free par level calculator works out a par for every item on your sheet from your usage, delivery days and supplier lead times.
Most vendor comparisons lead with accuracy metrics. The figure that is harder to find in vendor materials is the data prerequisite: most credible AI forecasting tools require at least 6 months of uninterrupted POS data per branch, fully mapped recipes, and complete historical records before the model can operate reliably. Shorter windows teach the model average demand but miss seasonal variance - and in purchasing, variance is where the cost sits.
Multi-site groups that achieve below 10% forecast variance share a common preparation path: they clean POS history, map recipes completely, and run the forecasting system in observe-only mode for 4-6 weeks before acting on recommendations. The operators who skip that calibration period report strong accuracy for the first 30 days, then degradation as the model encounters demand patterns it was not trained on.
Forecast horizon matters as much as accuracy. A tool with a 7-day window does not give supplier lead times enough runway. A minimum 14-day rolling window is the practical threshold for most purchasing cycles.
What to ask before committing: Show forecast vs actual variance data from live operator deployments, by branch, from months two through six of deployment - not month one, which is calibration. What happens to forecast accuracy at a branch that closes for two weeks and then reopens?
AI Inventory Management: What Changes When Par Levels Stop Being a Manual Weekly Task
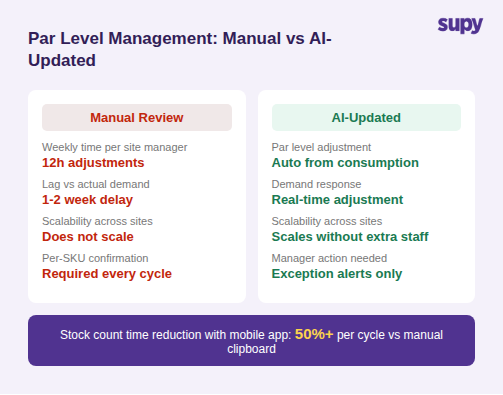
Par levels - the minimum stock thresholds that trigger reorders - need updating as consumption patterns shift with seasons, menu changes, and local demand. Multi-unit operators managing hundreds of SKUs across multiple locations typically spend 12 hours per week on manual par level adjustments, with results that lag behind actual demand by one to two weeks.
The operational separation between basic and advanced AI inventory tools is not whether they calculate par levels - most credible platforms do this. The separation is whether the system adapts par levels automatically as consumption patterns change, or whether every adjustment requires a manager to review and confirm a queue of individual recommendations.
Auto-updating par levels scale; manual-confirm queues do not. A group managing 5 locations with 200 SKUs each faces 1,000 par level decisions per review cycle if each SKU requires individual confirmation. At 20 locations, that queue becomes operationally unworkable.
Stock counting is the other workflow where AI inventory tools show measurable impact. Operations that replace manual clipboard counting with mobile app counting against a system calculating theoretical usage report stock count time reductions of over 50% per cycle. The gain disappears if counted stock does not feed directly into the same system generating reorder suggestions - a disconnected counting tool eliminates the AI value.
What to ask in a demo: Run a par level review from your current live operator data. How many individual SKU confirmations does a manager need to action in a typical weekly cycle? How does the system handle a location running a limited-time menu item not in the standard recipe set?
AI Ordering and Invoice Processing: The Automation Stack That Removes Manual Data Entry
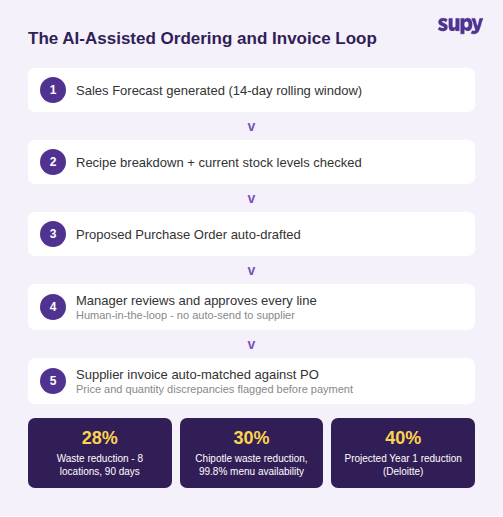
AI-assisted ordering and invoice processing are adjacent workflows that most comparison lists treat separately. In practice they form one data loop: the sales forecast drives a proposed purchase order, the supplier fulfils the order, and the supplier invoice needs to be matched against what was ordered and received. Manual steps in either half create reconciliation lag and introduce entry errors.
On the ordering side, the most operationally effective configuration is AI-generated purchase orders that a manager reviews before submission - not fully automated auto-send. An eight-location group reported 28% food waste reduction within 90 days using this human-in-the-loop approach, where managers reviewed every proposed order line before it was sent. Chipotle, at larger scale, reported 30% waste reduction while maintaining 99.8% menu availability. In both cases, the outcome combined AI recommendation quality with human oversight.
Deloitte projects 30-40% first-year food waste reduction for operators who implement AI forecasting tools with ordering integration. The range reflects data quality variance: operators with clean data inputs and active manager review reach the upper end; those catching up on data quality during deployment sit at the lower end.
On the invoice side, AI invoice scanning extracts supplier names, invoice numbers, line items, prices, quantities, and taxes from inconsistent document formats - PDF, scanned image, email body text - and auto-matches against open purchase orders. The commercial value beyond speed is discrepancy detection: price changes from contracted rates, quantity differences between ordered and invoiced, and format variations that manual keying misses or delays. The capability gap to test is format coverage - tools trained on structured layouts fail on non-standard supplier invoices, which are common in multi-supplier operations.
What to ask: Does the ordering system generate a proposed PO for human review, or does it auto-submit? For invoicing: what document formats does the tool handle, and what is the PO match rate on a sample of invoices from five of your current suppliers?
Choosing Your AI Tool: The Evaluation Framework That Separates Operational Fit From Demo Performance
The most common mistake in restaurant AI tool evaluation is treating demo performance as deployment performance. A forecasting tool can show 96% accuracy on historical data in a presentation and consistently miss by 15% in live operation. The root cause is almost always data: the demo runs on a curated set; your live operation runs on your messy, incomplete, migration-affected data.
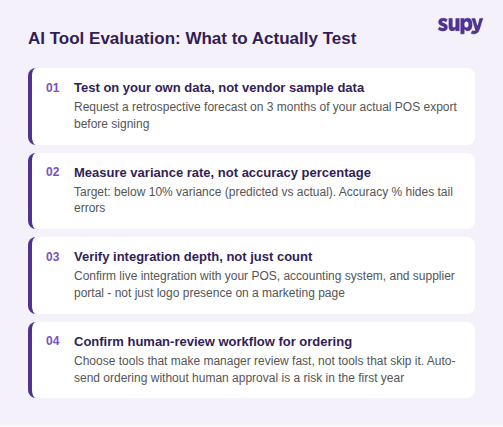
Four principles that separate operational fit from demo quality:
Test on your own data, not vendor sample data. Ask every vendor to run a retrospective forecast against three months of your actual POS history before you buy. A tool that cannot run on your POS export during evaluation will not perform better after you pay for it.
Measure variance rate, not accuracy percentage. For forecasting: target below 10% variance between predicted and actual. Accuracy percentage hides tail errors. For inventory: count par level adjustments per week that required manual override. For ordering: measure waste reduction after 90 days live, not projected savings from a sales deck.
Evaluate integration depth, not just count. A platform with 75+ integrations is only relevant if your specific POS, accounting system, and supplier portal are on the list. Request a live integration test with your three most critical systems before contract.
Confirm that human review exists in the ordering workflow. For most multi-unit operators in the first 12 months, human review of AI-generated orders outperforms auto-submission. The calibration period is real. Choose a tool that makes manager review fast - one that eliminates review is a risk, not a feature.
The full-stack versus point-solution decision follows from integration depth. A platform connecting forecasting, inventory, and ordering over a shared data layer - where the forecast directly drives the stock check that generates the order, without a manual export step between systems - maintains data coherence across the workflow. A point-solution stack requiring CSV exports between tools is not the same operationally, even if individual tools score higher in category-specific comparisons.
Supy covers the three highest-value back-of-house workflows discussed in this guide as a connected platform. AI Sales Forecasting delivers 14-day rolling predictions by branch and menu item, requiring 6+ months of POS history for reliable calibration. AI Predictive Ordering generates proposed purchase orders from that forecast run against current stock levels - every order is reviewed by a manager before submission, with no auto-send. AI Invoice Scanning captures supplier invoices directly by email, extracts line items across inconsistent formats, auto-matches against open purchase orders, and flags price and quantity discrepancies before payment. All three modules share a live stock layer with 75+ integrations to POS, accounting, and ERP systems. Learn more about Supy's back-of-house platform or book a demo to run the forecasting-to-ordering workflow on your own data.