.jpg)


Bar Inventory Software Guide

Most bar operators track inventory the same way they always have. Spreadsheets, paper stocktake sheets, or a POS system that tells them what sold but never what was lost. The cost of that approach is invisible until you measure it: a 50-venue bar group losing $115,000 annually at just 2% over-pour variance alone. Bar managers who control pour cost, variance, and multi-location beverage purchasing treat software as operational control, not a nice-to-have. This guide covers everything bar operators need to know to evaluate and select the right software for beverage inventory.
What Bar Inventory Software Actually Does (vs. Generic Inventory Tools)
Bar inventory software is not the same as restaurant inventory management software, even though they sound similar. A bar inventory solution is built specifically for the unique challenges of beverages - liquid units, weight-based counting for kegs, pour cost calculation, and the high variance that defines every bar operation.
Generic inventory software (the kind built for retail or restaurants) assumes discrete, fixed units: a bottle is a bottle, a case is 12 bottles. Beverages work differently. A keg is 100 units on day one and 40 units three days later, counted by weight. A cocktail uses 1.5 ounces of vodka, 0.75 ounces of lime juice, 0.5 ounces of simple syrup - three ingredients, three separate inventory movements, one unified cost. A wine cellar has 240 bottles by vintage, each with its own par level, shelf life, and pricing.
Bar inventory software handles all of this natively. It understands weight-based counting (reducing reconciliation time from 6 hours to 90 minutes per stocktake). It calculates cocktail recipe costing automatically (average 3.2 ingredients per drink, $1.80-$2.40 COGS per serve). It flags pour variance by product category and venue before it compounds into margin loss.
Restaurant inventory systems don't do this.
They track food cost. Bar software tracks pour cost - the metric that actually drives beverage profitability.
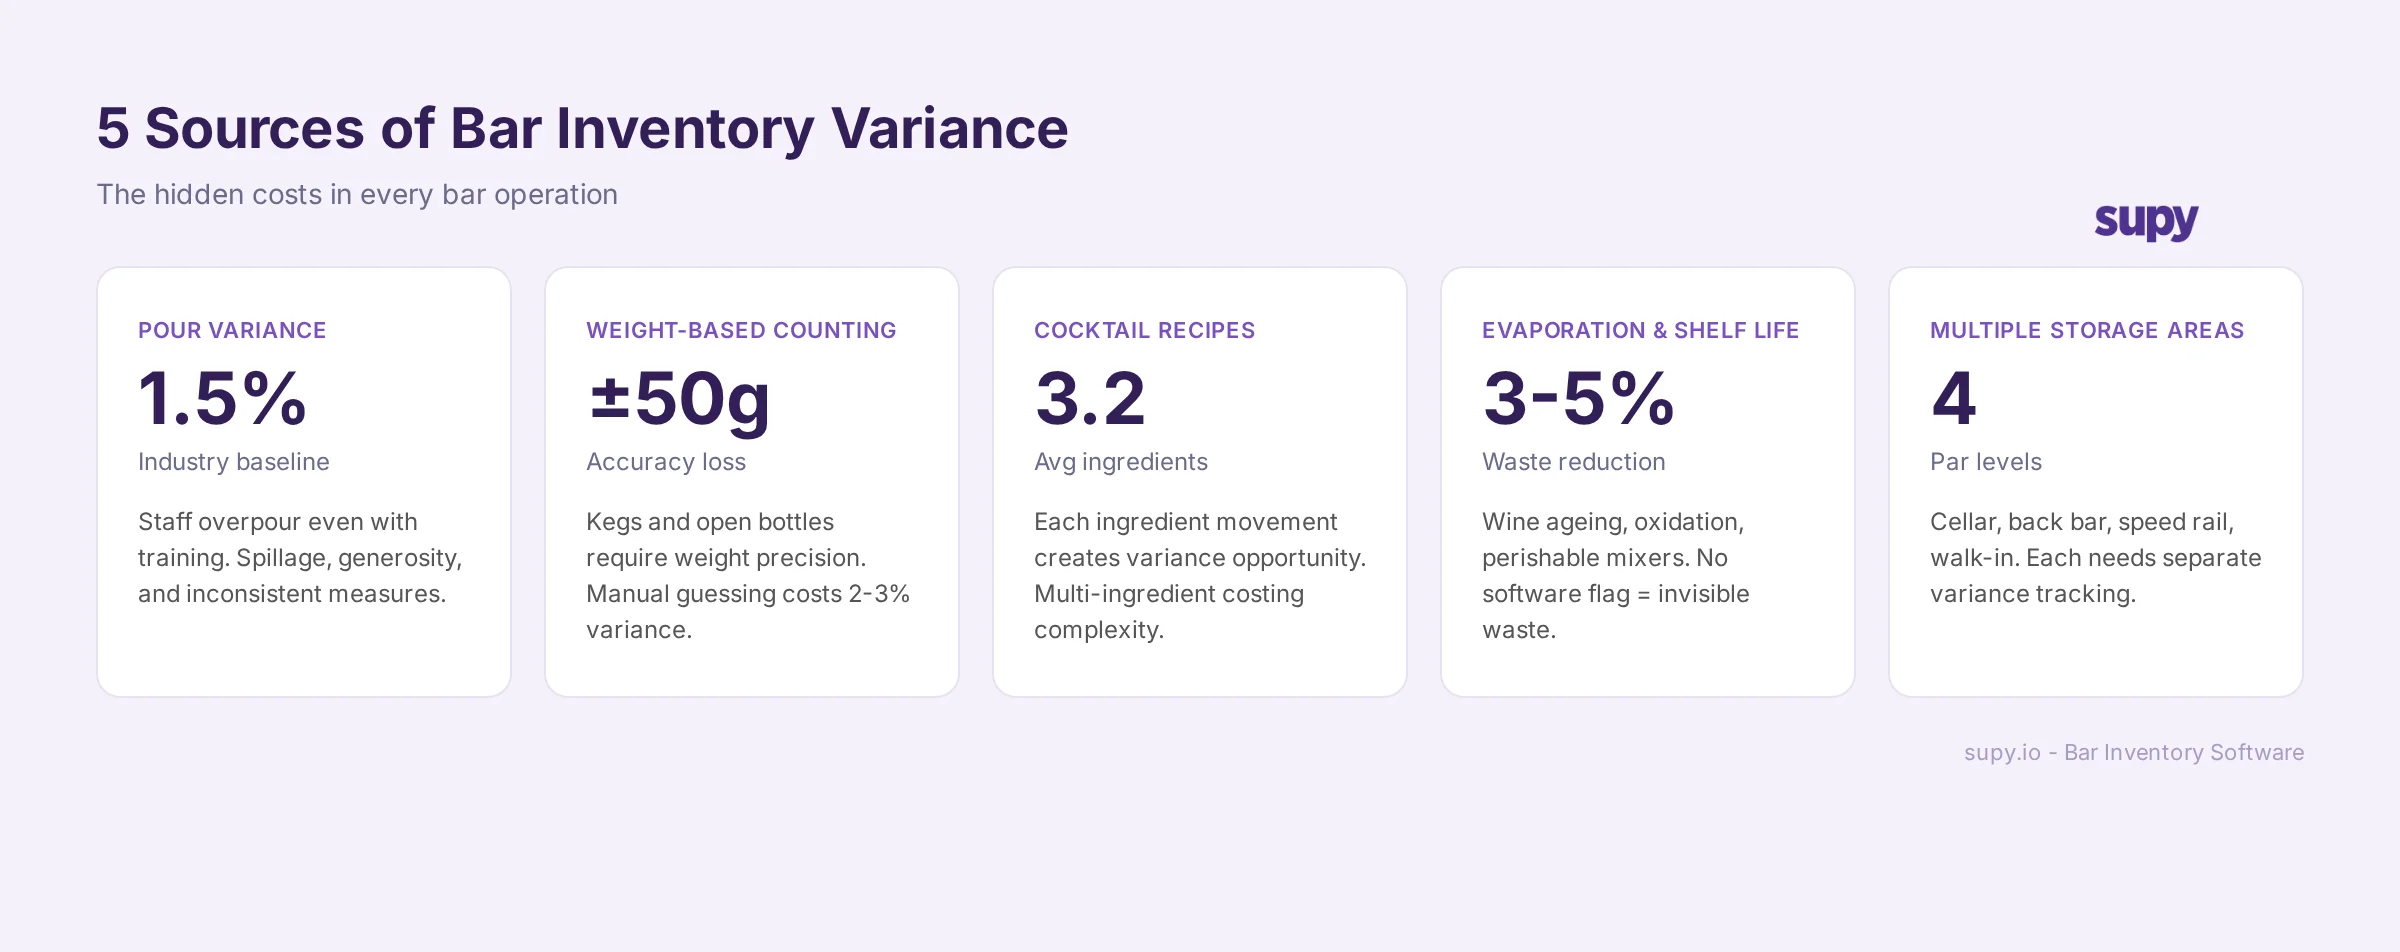
Why Bar Inventory Is Uniquely Difficult
Bar operations introduce five sources of variance that restaurant inventory does not have to manage at the same scale.
Multi-venue bar operations multiply this complexity by the number of locations.
The Core Features Bar Operators Need
When evaluating bar inventory software, look for these five capabilities.
1. Weight-based stock counting with multiple unit types. The software must support bottles, kegs, litres, millilitres, and weight. When a manager opens a 1-litre bottle of vodka and records the opening weight (1.05 kilograms), subsequent inventory movements should deduct in weight, not guesswork. Weight accuracy within 50 grams is standard. 2. Pour cost calculation. The software calculates pour cost automatically by product and by venue. Enter the cost per bottle and the software tracks remaining stock. Reconcile actual vs. expected and the variance is transparent. Industry benchmark is 18-24% pour cost; actionable software flags variance at 1-2% above your baseline. 3. Cocktail recipe costing. Define a margarita as 1.5 oz silver tequila + 0.75 oz triple sec + 0.5 oz lime juice + 0.25 oz simple syrup + salt rim. The software calculates COGS per serve ($2.10) and flags recipes that are under-priced or over-engineered. This is not standard in restaurant software - it is essential in bar software. 4. Beverage par levels and variance analysis. The software allows different par levels for back bar, speed rail, and cellar. It flags variance by product, category, and venue. A variance alert ("Premium spirits at venue 3 are 6% above historical baseline") is actionable; "overall variance 1.8%" is not. 5. Integration with bar POS systems. The software pulls sales data from the POS (drinks sold, quantities, revenue). It matches POS sales to inventory deductions. When the POS says 40 margaritas sold but inventory shows 60 ounces missing, the variance is 4 ounces unaccounted for (theft, spillage, free pours). This reconciliation is what makes variance analysis real.Pour Cost: What It Is, How to Calculate It, and What Good Looks Like
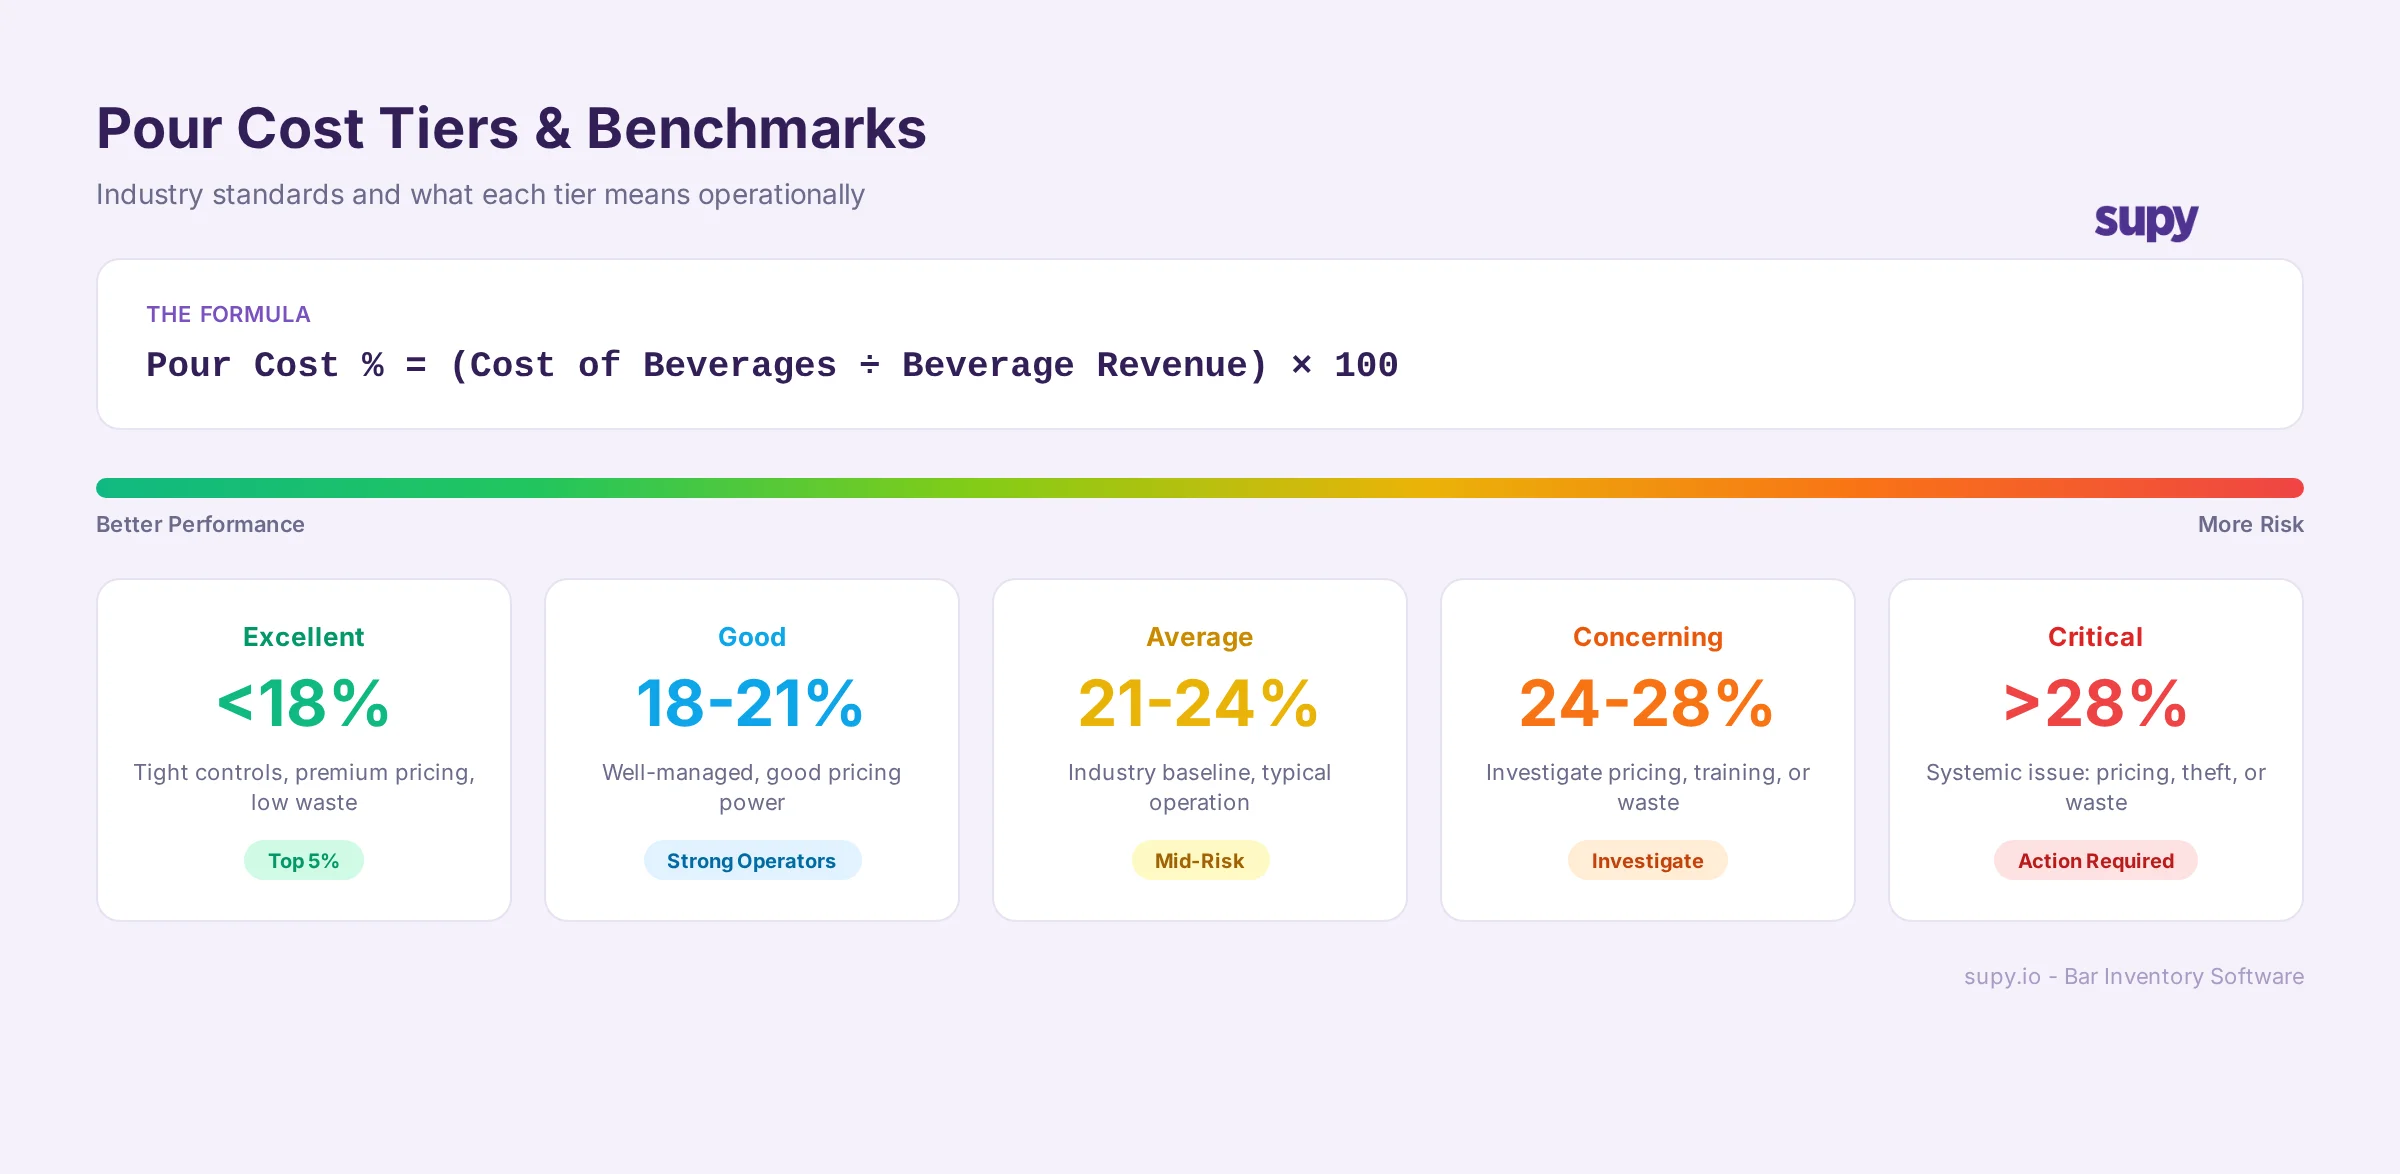
Pour cost is the ratio of beverage cost (what the bar paid) to beverage revenue (what the customer paid). It is the beverage equivalent of food cost percentage.
The formula: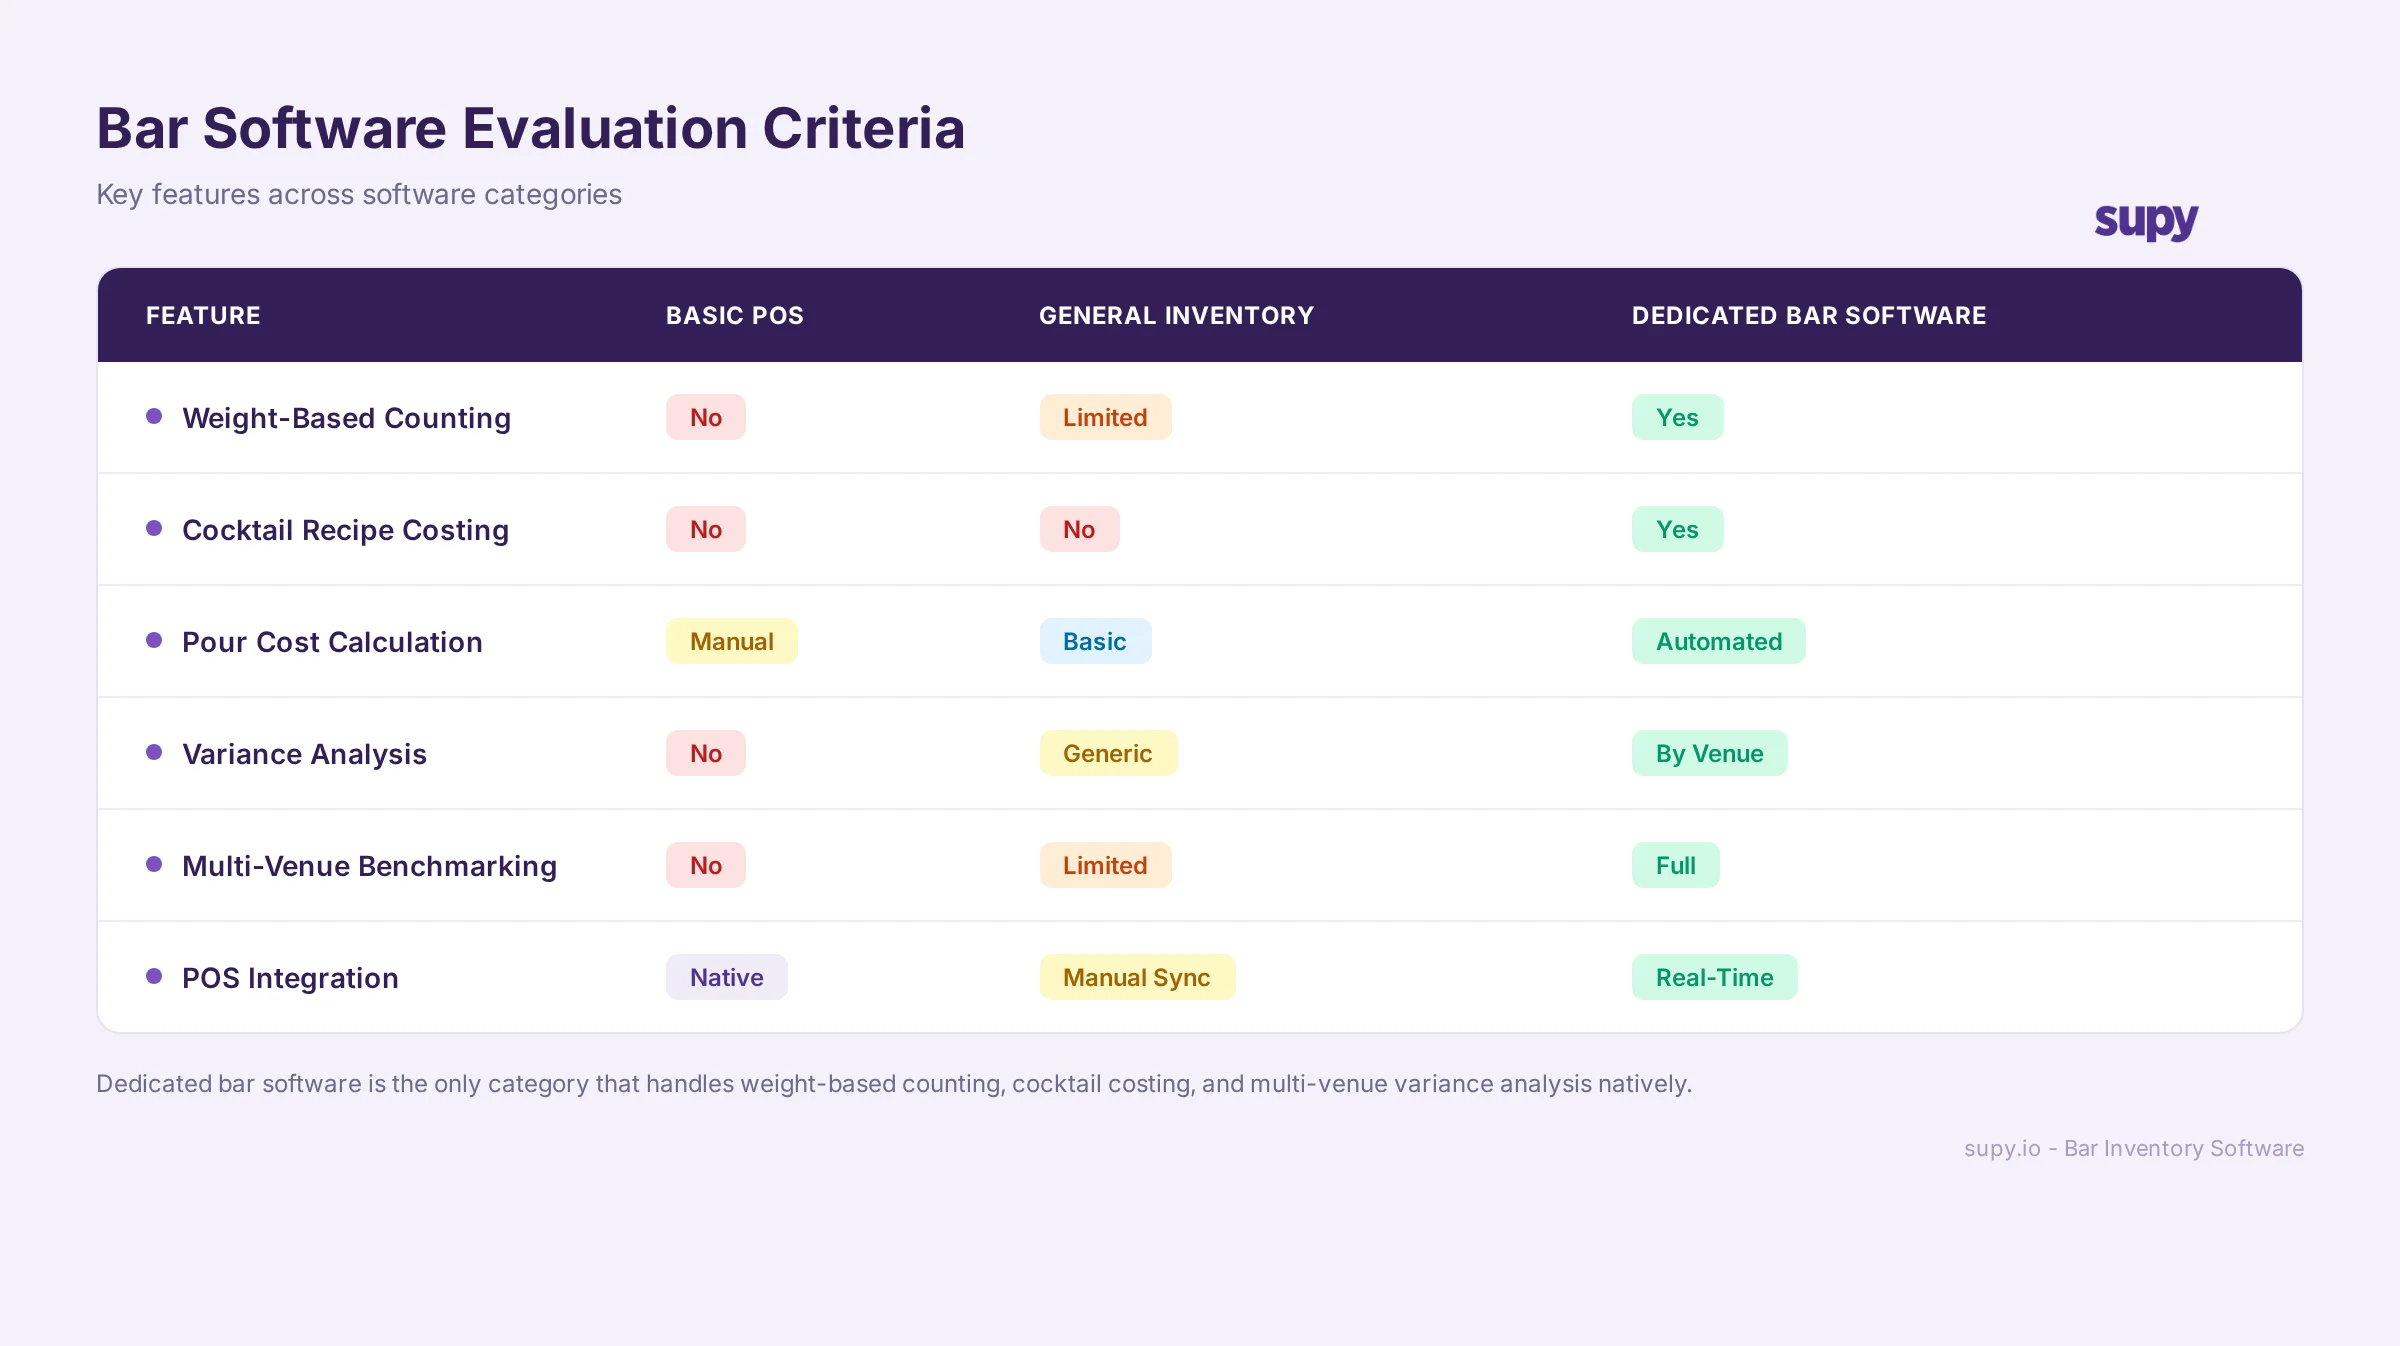
Pour Cost % = (Cost of Beverages Sold ÷ Beverage Revenue) × 100
Worked example:A neighbourhood bar serving 200 covers per week. Last week, spirits, wine, and beer cost $1,200 to replace stock (opening inventory + purchases - closing inventory). Revenue from beverage sales was $5,100.
Pour Cost % = ($1,200 ÷ $5,100) × 100 = 23.5%
What good looks like:- Premium spirits (whisky, vodka, gin): 16-20% pour cost
- Wine: 25-30% pour cost
- Beer (draught): 20-25% pour cost
- Cocktails (mixed): 20-25% pour cost (variance depends on recipe)
- Overall bar: 18-24% pour cost is industry baseline
- Under 18%: Suspiciously low. Check pricing (are you underpricing?) or accuracy (are recipes being followed?).
- 18-24%: Normal. Monitor by category.
- 24-30%: High variance. Investigate pour training, theft, or incorrect par levels.
- Over 30%: Problem. Either pricing is broken, waste is systemic, or theft is occurring.
The difference between a 20% bar and a 24% bar across a 5-venue group is $18,000 annually in margin. That is why pour cost control matters.
Bar Inventory Software vs. Spreadsheets vs. POS Add-Ons
Three approaches bar operators consider when weighing solutions.
| Approach | Pros | Cons | Best for |
|---|---|---|---|
| Spreadsheet | Low cost. Full control. Familiar to staff. | Manual data entry (reconciliation 8-18 hours/week). No variance alerts. No recipe costing. No POS integration. Errors compound. | Single-site bars with <200 SKUs and stable operation. Not scalable. |
| POS add-on | Already integrated with sales. Lower learning curve. Built into existing system. | Assumes bottled units (kegs and partial bottles are hard). No weight-based counting. Limited recipe costing. Limited multi-venue visibility. Variance analysis is generic. | Single-site venues where POS is already the hub. Acceptable for beer-heavy bars. |
| Dedicated bar software | Weight-based counting. Cocktail recipe costing. Pour cost by product and venue. Variance alerts. Multi-location benchmarking. Integration with POS. Multi-unit support. | Requires training and adoption. Higher cost than spreadsheet. Depends on data quality (accurate opening counts, POS sync). | Multi-venue operators. Venues with >300 SKUs or cocktail-heavy menus. Operations prioritising variance control. |
Spreadsheets work until they don't. At 3-5 venues or 300+ SKUs, a spreadsheet becomes an anti-pattern - managers spend time correcting errors rather than using data to make decisions.
POS add-ons bridge the gap for simple operations (draught beer, standard spirits, pre-made cocktails). They fail when you need weight-based counting or detailed recipe costing.
Dedicated bar software is the only approach that handles the full complexity of modern bar operations at multi-venue scale.
Multi-Venue Bar Operations: What Changes at Scale
Single-venue bar managers know their operation intimately. They see pour variance immediately. Multi-venue bar directors manage operations they never physically see. Scale introduces three new challenges that software must solve.
Multi-venue software also handles approved supplier lists, contract pricing across venues, and purchasing authority workflows - operational governance that single-venue software does not need.
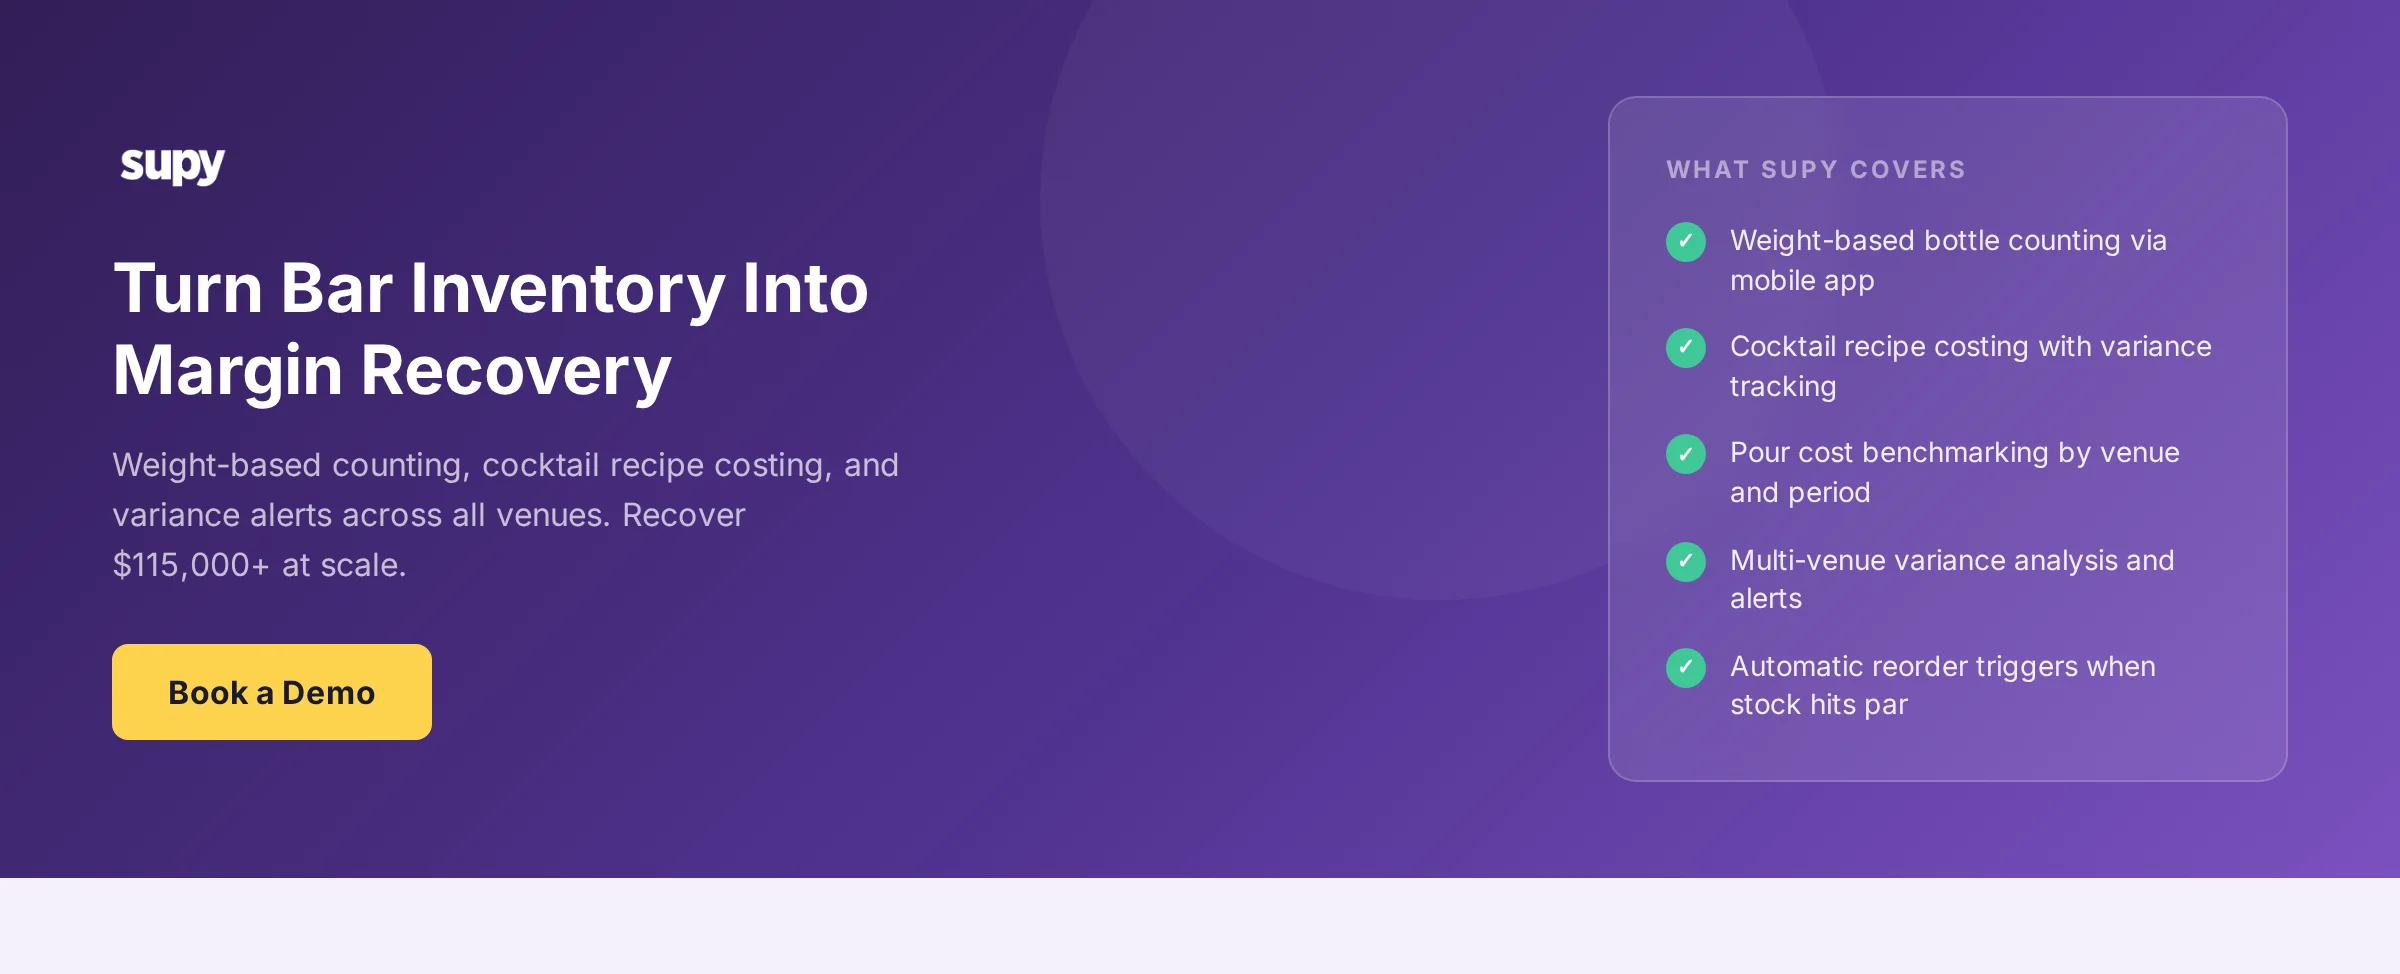
How Supy Handles Bar Inventory
Supy's bar inventory capabilities align directly with the challenges outlined above.
Weight-based stock counting. Supy supports bottles, kegs, litres, weight, and count units in the same system. Managers open a 12-litre keg, record the opening weight (12.8 kg), and Supy deducts in weight per use. Reconciliation is accurate to ±50 grams. This eliminates the guesswork that plagues spreadsheet operations. Pour cost by product and venue. Enter the cost per bottle and Supy calculates pour cost automatically by product, category, and location. Variance alerts flag venues or products 1-2% above your baseline. Rather than "overall pour cost is 22%", operators see "premium spirits at venue 3 are running 24% (baseline 21%)". Cocktail recipe costing. Define a cocktail once - specify spirits, mixers, and garnish in millilitres and grams. Supy calculates COGS per serve and flags recipes that are underpriced or expensive to make. A seasonal cocktail using premium tequila shows higher COGS; happy-hour recipes are flagged if they are margin-negative. Beverage par levels. Set different par levels for back bar, speed rail, and wine cellar. Supy tracks stock against par by location and area. When stock falls below par, purchasing alerts trigger. This is particularly valuable for wine-focused venues where par management is critical. Multi-venue benchmarking and centralised purchasing. Supy provides consolidated dashboards showing all venues' inventory, pour cost, and variance trends. This visibility enables approved-supplier lists, volume-based ordering, and location-level performance accountability. A 5-venue group can identify $10,000+ annual purchasing savings within the first month.Supy's integration with restaurant inventory (food + beverage in one system) is unique. A hotel with multiple bars and restaurants, or a restaurant group with a dedicated bar, use a single platform for all inventory - no parallel systems, no reconciliation between food and beverage data, no disjointed reporting. This integration is particularly valuable for mixed venues.
Bar Inventory Software vs. Spreadsheets vs. POS Add-Ons: A Detailed Comparison
The decision matrix for bar operators.
Data accuracy:- Spreadsheet: Manual data entry introduces 2-5% error rate
- POS add-on: Accurate for sales, limited for inventory (no weight)
- Bar software: Accurate to ±50 grams with automated POS sync
- Spreadsheet: 8-18 hours per stocktake
- POS add-on: 3-5 hours (basic counting only)
- Bar software: 60-90 minutes (weight-based, automated)
- Spreadsheet: Manual calculation per recipe (time-intensive, error-prone)
- POS add-on: Not available
- Bar software: Automatic, ingredient-level, alerts on margin
- Spreadsheet: Requires manual consolidation across five sheets
- POS add-on: Limited to single-location (or fragmented across systems)
- Bar software: Real-time unified dashboard across all venues
- Spreadsheet: $0 (hidden cost: 10-15 hours/week staff time)
- POS add-on: $100-300/month
- Bar software: $300-1,200/month depending on venue count and features
The decision comes down to scale and complexity. A single-site bar with a stable operation can manage with a POS add-on. A multi-venue group or a cocktail-heavy venue needs dedicated software.
Frequently Asked Questions
Q: Do I need bar inventory software if I use a POS system?
A POS system tells you what sold. It does not tell you what was lost, stolen, or wasted. Most bar operators assume the difference is "spillage", but without variance analysis, you are blind to the actual cost. Bar inventory software reconciles what the POS said sold against what inventory deductions show was used. That reconciliation is where margin recovery happens. If you are not measuring variance, you are leaving $50,000-$200,000 annually on the table across a multi-venue group.
Q: What is a realistic pour cost percentage for my bar?
Industry baseline is 18-24%, but this varies widely by bar type. Premium spirit-heavy bars run 20-24%. Wine bars run 25-30% (wine has lower margins than spirits). Cocktail-focused venues run 22-26% depending on recipe complexity. The key metric is trend, not absolute: if your pour cost was 21% last quarter and is now 24%, something has changed (price increase, waste, theft, training drift). Software that tracks month-to-month trend is more valuable than an absolute benchmark.
Q: Can I integrate bar inventory software with my existing POS?
Most modern bar software integrates with major POS systems (Toast, Square, Lightspeed, TouchBistro). Integration pulls sales data into inventory software, automating the variance calculation. If your POS is older or proprietary, integration may not be possible - you would need manual data sync (daily export from POS, import into software). Check before buying.
Q: How do I account for opening inventory if I have never stocktaken properly?
Your opening inventory is whatever stock you physically have on day one of software implementation. You conduct a full physical count (weighing kegs, counting bottles, measuring open bottles by pour count). You record this in software as your baseline. From there, software tracks all movements (purchases, sales, waste, adjustments). Do not use historical "guesses" - use actual physical count. This is a one-time, 2-4 hour task per venue.
Q: Will bar inventory software catch theft?
Software flags variance, which sometimes indicates theft. If a venue's premium spirits show 8% over-pour variance when baseline is 1.5%, something is wrong - it could be training, it could be theft, it could be incorrect par levels. Software makes the anomaly visible; it does not prove the cause. You then investigate (staff retraining, par-level audit, inventory controls, or potential staff changes). Software does not replace management discipline, but it makes invisible problems visible.
Q: How long does it take to implement bar inventory software?
Implementation is typically 2-4 weeks for a single venue, 6-8 weeks for a 5-venue group. Week 1 involves training and data setup (product master, suppliers, par levels, recipes, POS integration). Week 2 is a parallel run (comparing software variance to spreadsheet). Weeks 3-4 are live, with daily support as staff adopt the system. Multi-venue rollout is sequential - one venue at a time, transferring learning to the next. Budget for 4-6 hours of staff time per week during implementation.
Bar operators have two choices: manage inventory reactively (reacting to variance when margins suffer) or proactively (controlling variance before it compounds). Spreadsheets enable reactive management. POS add-ons enable basic inventory tracking. Dedicated bar inventory software enables proactive control - seeing variance real-time, understanding its cause, and correcting it before it scales across multiple venues.
The $115,000 margin loss at a 50-venue group running 2% over-pour variance is not inevitable. It is the cost of not measuring. Software makes measurement possible, variance visible, and control operational.
Supy's approach to bar inventory - weight-based counting, cocktail recipe costing, multi-venue benchmarking, and integration with restaurant inventory - is built specifically for multi-location bar operators who prioritise operational control and margin accountability. It is the system designed for the complexity of modern bar management.
Getting started is straightforward: audit your current variance (conduct a full physical count and compare to records), map your pain points (time spent on reconciliation, uncertainty about pour cost, multi-venue visibility gaps), and evaluate software that addresses those specific gaps.

