.jpg)


Restaurant Food Cost Control: Why Multi-Site Groups Overspend on Purchasing
Where Food Spending Leaks Before It Reaches Reported Costs
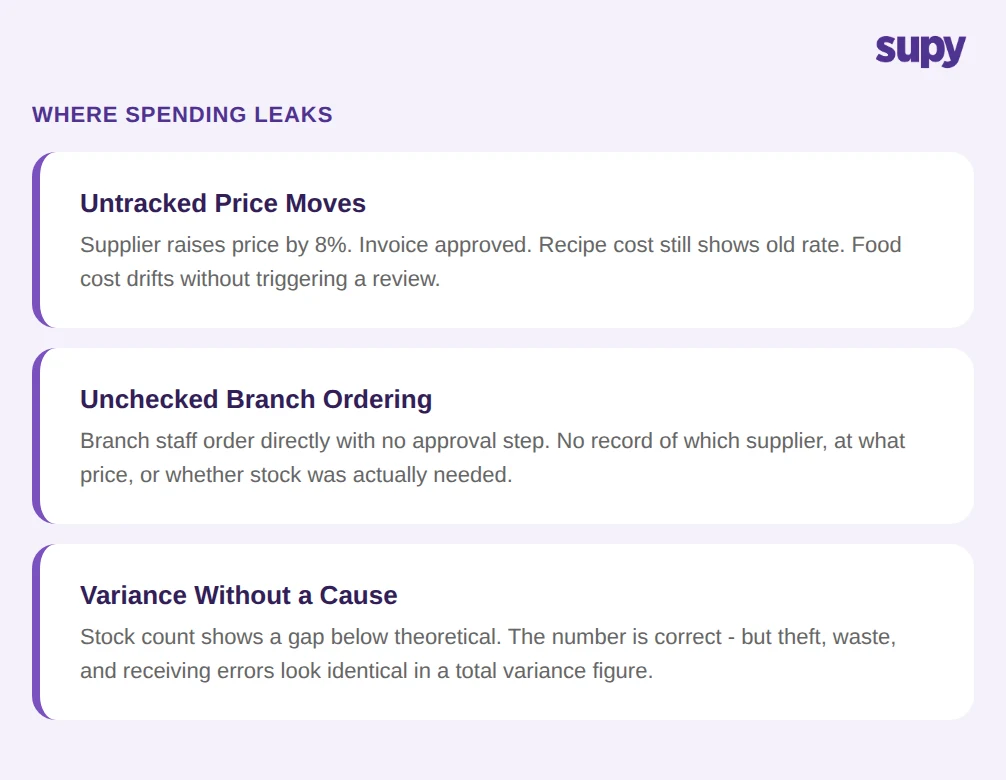
The gap between what an operator believes food costs and what it actually costs almost always comes from the same three places.
The first is untracked price movement. A supplier raises the price of a key ingredient by 8%. The change appears on the invoice. The invoice is approved. But unless someone has updated the item's purchase price in the system - and linked that change to every recipe that uses the ingredient - the recipe cost still shows the old price. Operators running food cost at 28% discover at month-end that they are actually at 33%, with no clear explanation.
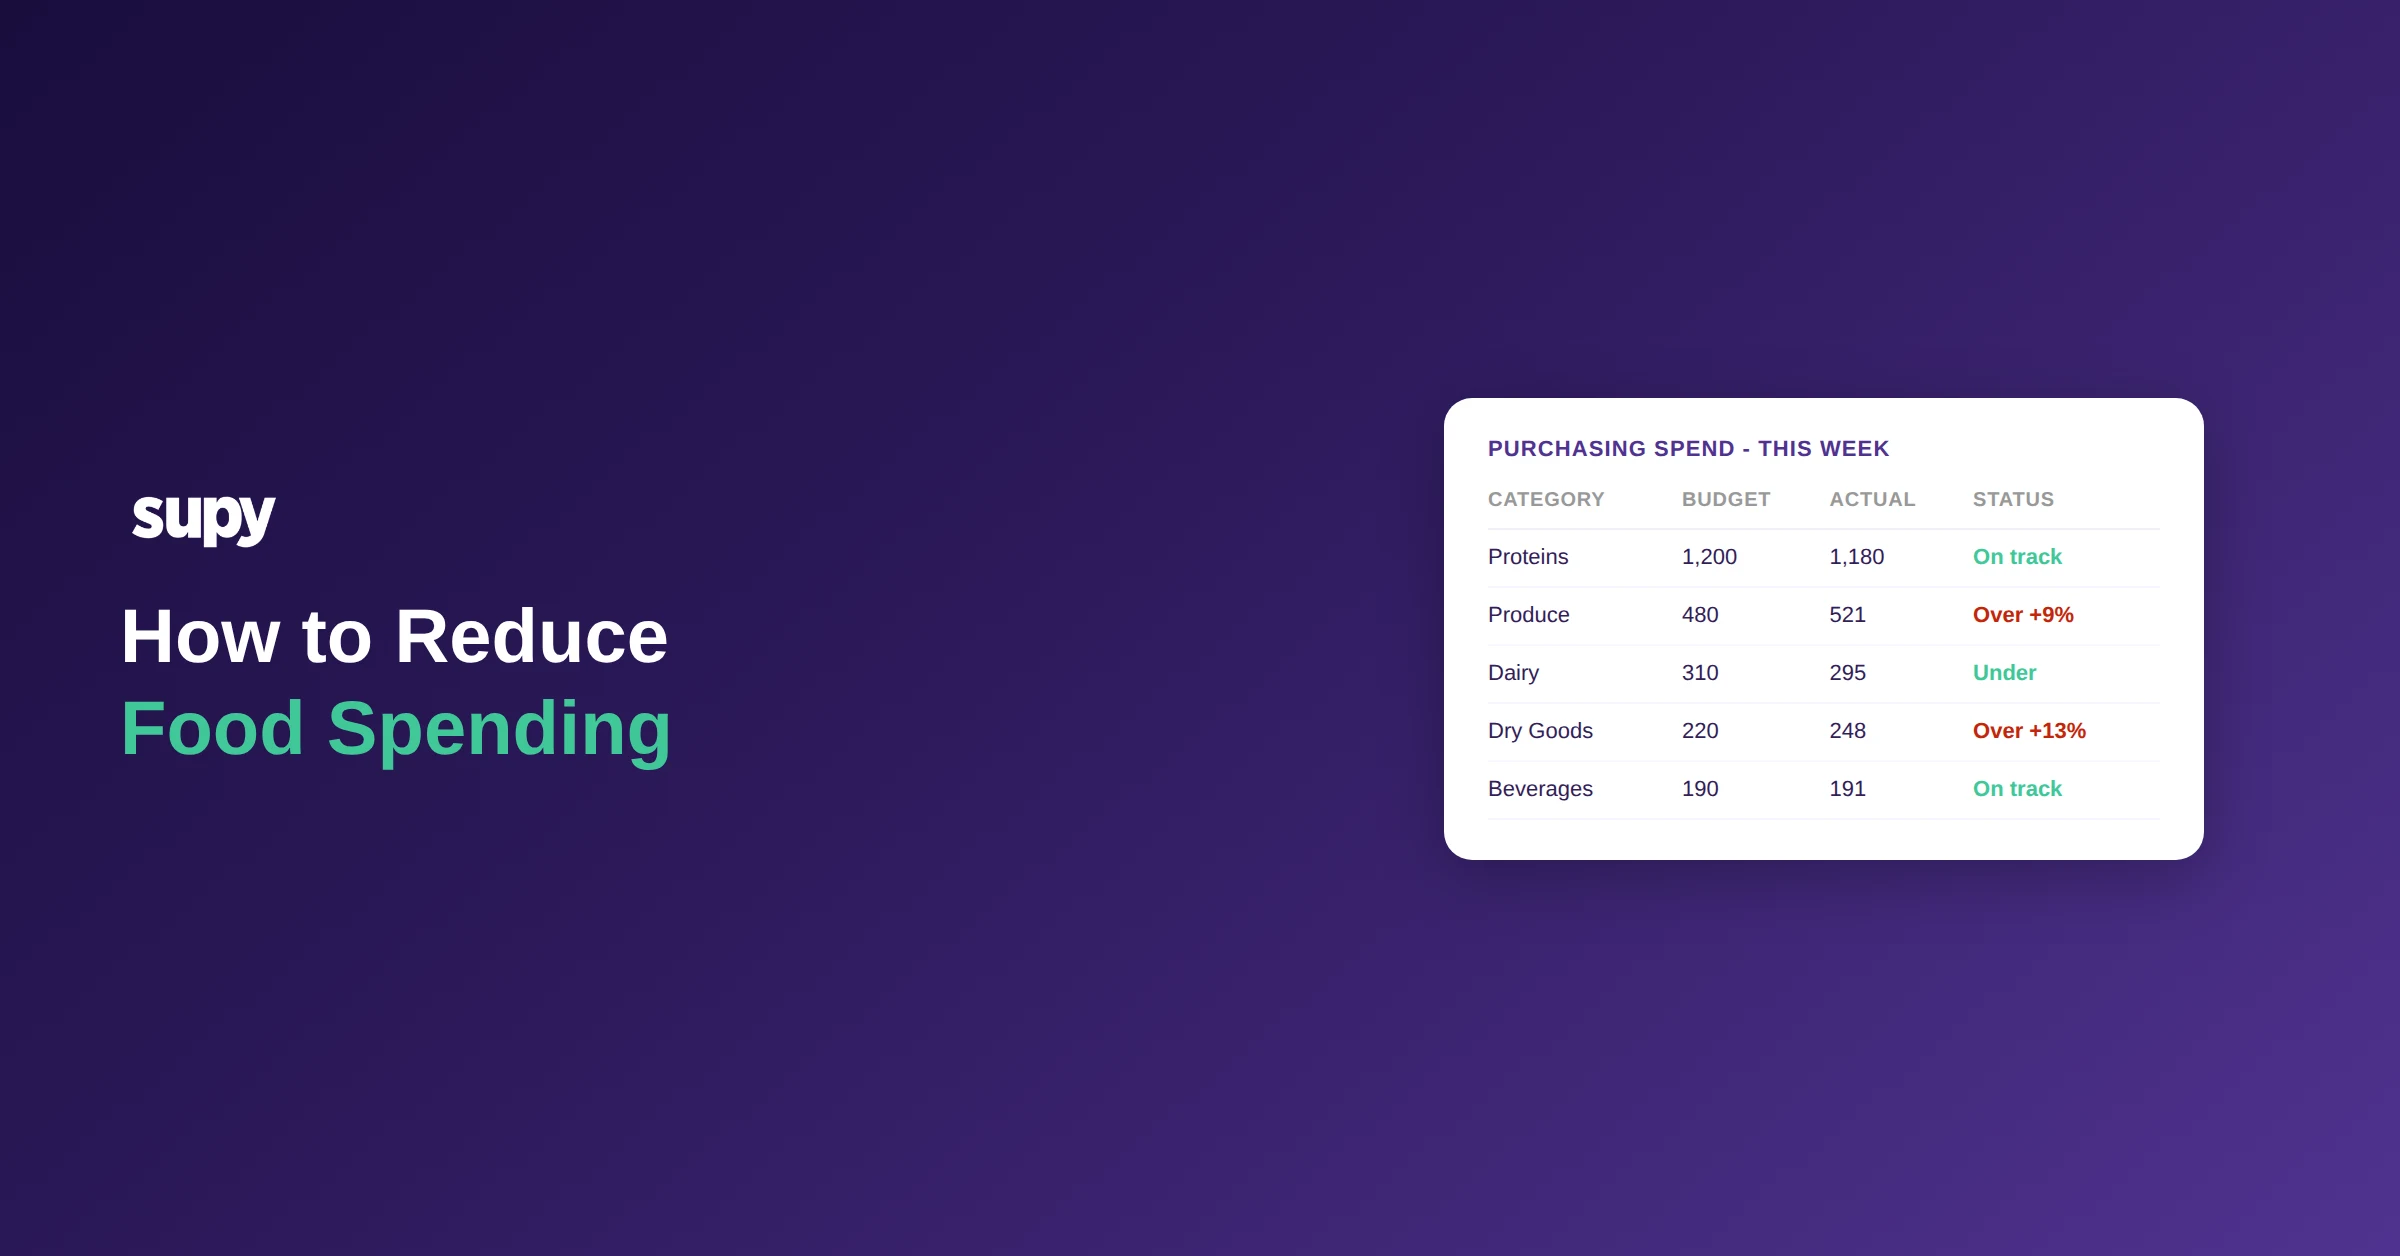
The second is purchasing without approval structure. In multi-location groups where branch staff order directly from suppliers by email or through supplier portals, there is no centralised view of what is being ordered, at what price, or from which supplier. A branch manager reorders from a convenience supplier at a higher rate because they are out of stock. Another location places a duplicate order that is not caught until delivery. Neither event appears in a report; both increase food spending.
The third is variance that cannot be traced. When a stock count shows that actual inventory is below theoretical, that gap has multiple possible causes: receiving errors, waste not logged, theft, or overproduction. If the system reports a single variance number without a breakdown by movement type, operators cannot distinguish between a receiving problem and a waste problem - and they cannot fix either.
The Purchasing Controls That Prevent Unplanned Spend
The most direct lever for reducing food spending is structuring purchasing decisions before they happen, not explaining overspend after it has occurred.
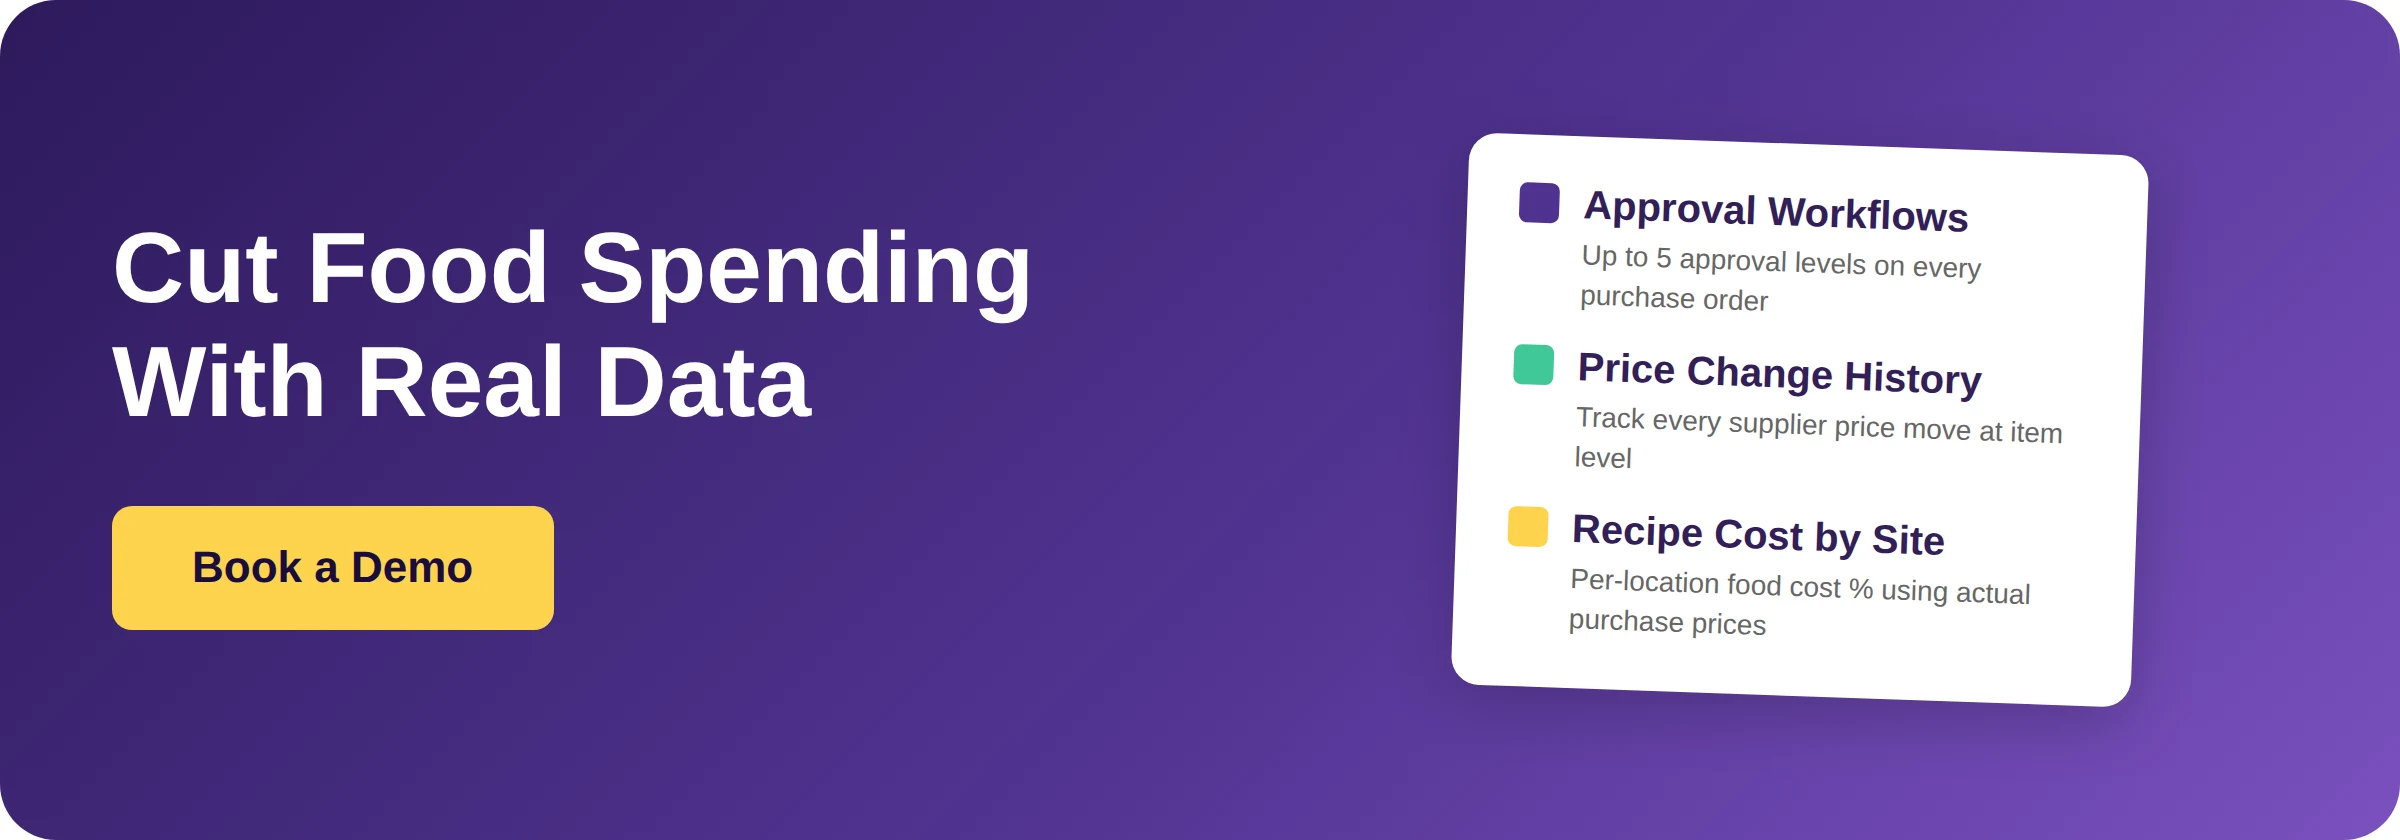
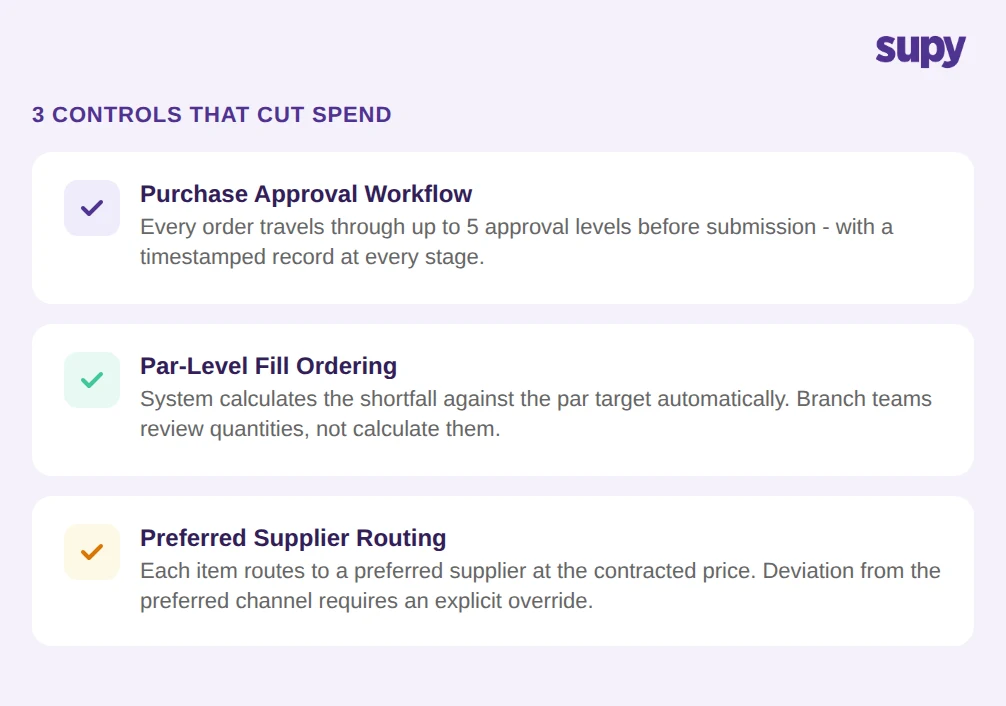
A purchase request and approval workflow means that before any order is placed by a branch team, it travels through a configurable set of approvers - finance, the operations manager, or both, depending on order size or category. Each step is timestamped and attributed to a named approver, so the audit trail is complete. For groups running five or more locations, this replaces the WhatsApp-and-email ordering process that creates no record and enforces no controls.
Par-level ordering gives the purchasing decision a data foundation. Setting a minimum and maximum stock level for every item at every location means the system calculates the fill-to-par quantity automatically - the branch team sees how much to order rather than guessing. Reorder decisions based on guesswork produce inconsistent quantities; par-level orders produce consistent stock levels and predictable spend.
If you'd rather not work par out by hand, the free par level calculator does it for every item on your sheet from your usage, delivery days and supplier lead times.
Preferred supplier assignment prevents the ad hoc sourcing decisions that inflate purchasing costs. When every item in the product master has a preferred supplier with a contracted price, the default ordering path routes to that supplier. Deviation from the preferred supplier requires an explicit action - and leaves a record.
Tracking Supplier Prices Before They Drift Into Food Cost
Supplier price management is the purchasing control that most operators underinvest in. Price changes happen regularly; most are not disputed because they are not caught.
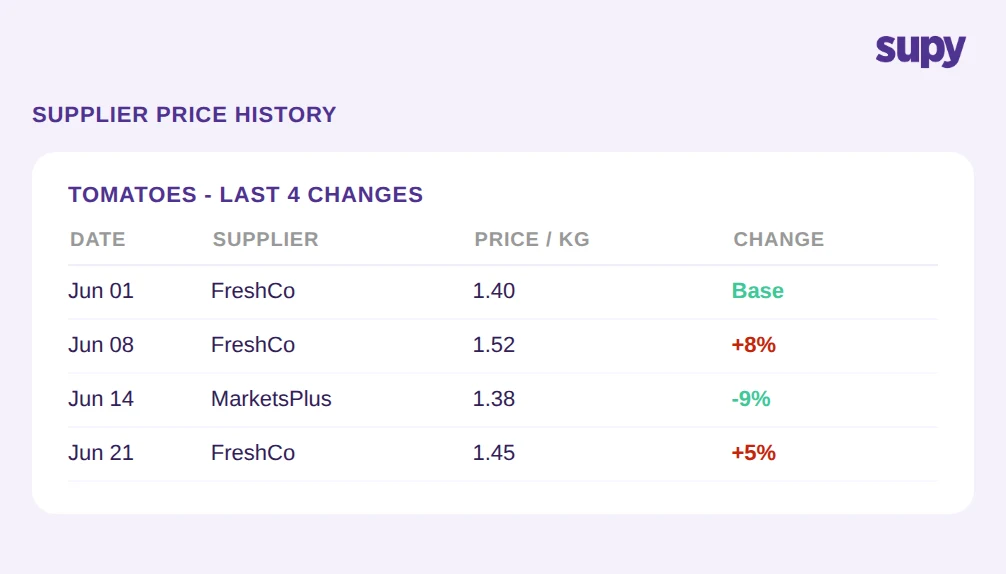
A full price-change history at the item level means operators can see exactly when a supplier adjusted a price, by how much, and whether that change was authorised or simply applied. This turns a passive record into an active negotiation tool: when a supplier proposes a price increase, operators can pull the change history and compare it to previous discussions.
Scheduling a future price change on a supplier item - with an effective date rather than an immediate override - prevents the common problem of applying a negotiated rate too early or too late. The system activates the new price on the correct date without manual intervention on the day. Combined with price-change history, this gives operators a documented trail of every pricing agreement.
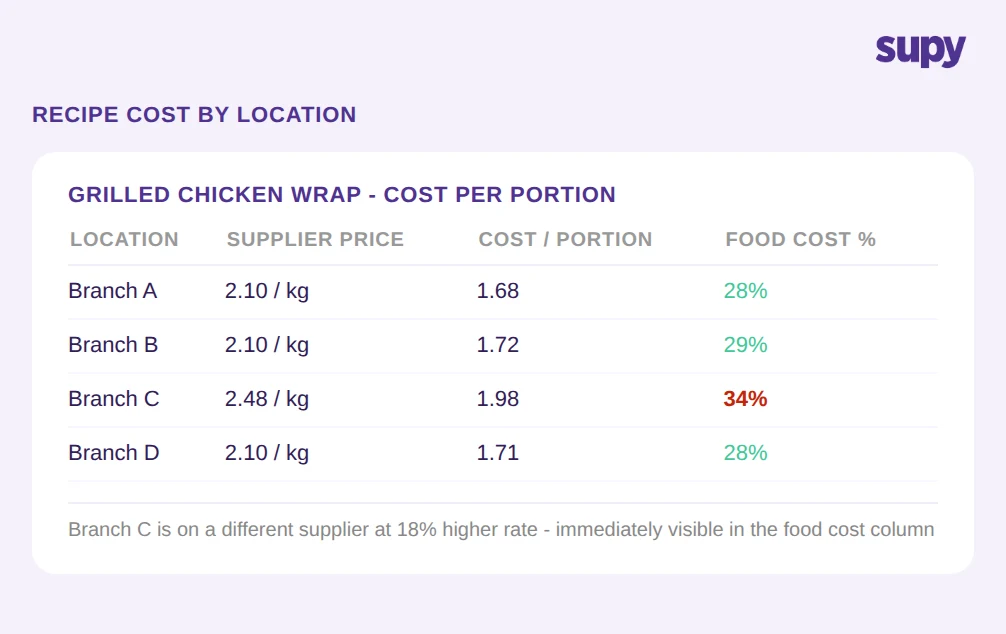
Location-specific price overrides extend this control to multi-location groups where different branches have negotiated different rates from the same supplier. Each location sees its contracted price; the group sees the full picture. Without this, the cost reporting either uses a group average that is accurate for no individual site, or requires site-level exports that are too slow to be operational.
Connecting Supplier Prices to Recipe Cost Percentage
Reducing food spending requires knowing where the cost is sitting in the production chain - not just what the total purchasing bill was, but how purchasing prices are flowing into recipe costs and where the gap between theoretical and actual consumption is accumulating.
Recipe costs calculated using either average cost or last purchase price, applied per location and per date, reflect the real cost of production at each site. A group that purchases the same ingredient at different prices from different locations will see different recipe costs at each site - which is the correct signal. A system that calculates a group-level average and applies it uniformly obscures the site-level cost structure.
Including prep wastage and yield percentage in recipe cost calculation means the food cost percentage shown to operators reflects what the kitchen actually uses, not just what the recipe specifies. A kitchen that peels and trims 20% of a vegetable before use has a higher actual cost per portion than the recipe ingredient list suggests. Yield-adjusted recipe costs bring the reported food cost percentage in line with what the kitchen actually spends.
Per-item purchasing analytics that show spend and order history by ingredient across all locations give operators the data to identify which items are driving cost increases, which suppliers have changed their pricing most frequently, and where consolidated purchasing across locations could unlock better negotiated rates. For a broader look at how inventory controls connect to cost management, see our guide to inventory software for restaurants.
Turning Variance Reports Into a Weekly Cost-Reduction Signal
Variance between theoretical stock and actual counted stock is the signal that connects all the above controls. A well-configured system turns variance into a weekly diagnostic rather than a monthly report to explain.
When every goods receipt updates the live stock position, every sale depletes recipe ingredients automatically, and every inter-branch transfer records a movement against both sites, the variance at period-end reflects genuine unexplained consumption - not data that was never entered. A variance that cannot be explained by a specific movement event is a real operational problem worth investigating.
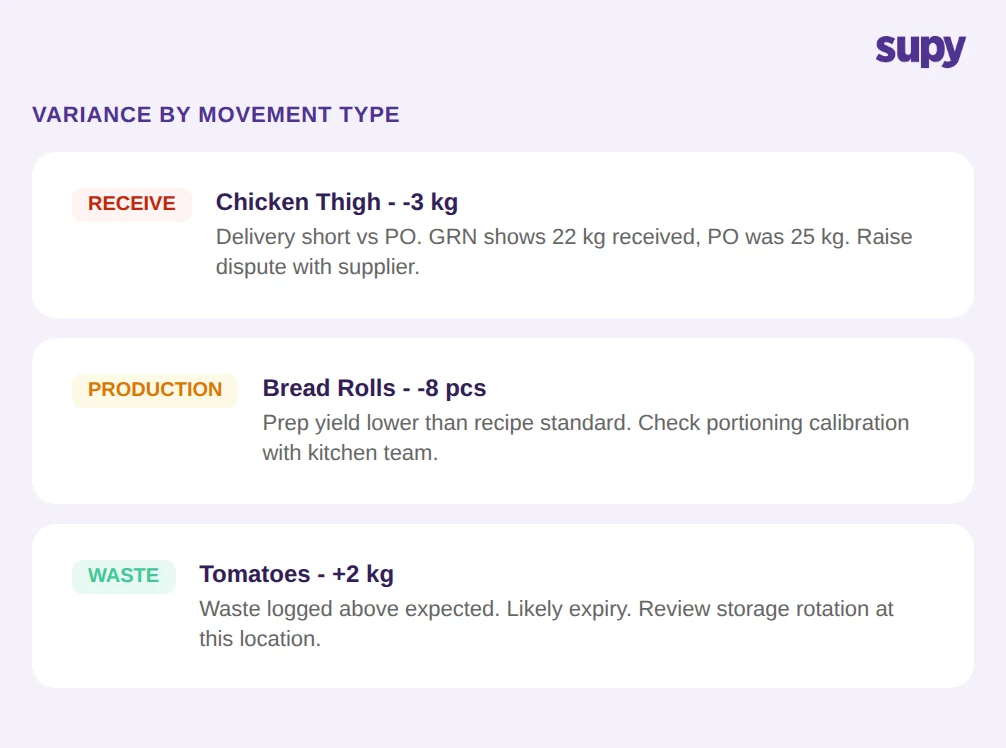
Variance broken down by movement type - receipts, production, waste logs, transfers - allows operators to route the investigation to the right team. A variance in the receiving category is a delivery discrepancy or an entry error; a variance in the production category is a portioning or recipe-compliance issue; a variance in the waste category points to disposal practices. Each has a different fix, and confusing them wastes time.
Using variance data on a weekly rather than monthly cadence means cost problems are identified and addressed within the same trading period, not explained after the financial close. For multi-location groups operating at tight margins, the difference between a weekly and a monthly feedback loop is the difference between a recoverable deviation and a structural cost problem.
Supy connects all four layers - purchasing approval and par-level ordering, supplier price tracking, recipe cost per location, and variance reporting with movement-level audit trail - in a single platform built for multi-site restaurant groups. To see how it works on your operation, book a demo at supy.io/book-a-demo.