.jpg)


Budget vs Actual Food and Beverage Spend: Live Multi-Site Control
What Live Budget vs Actual Looks Like Across Every Site
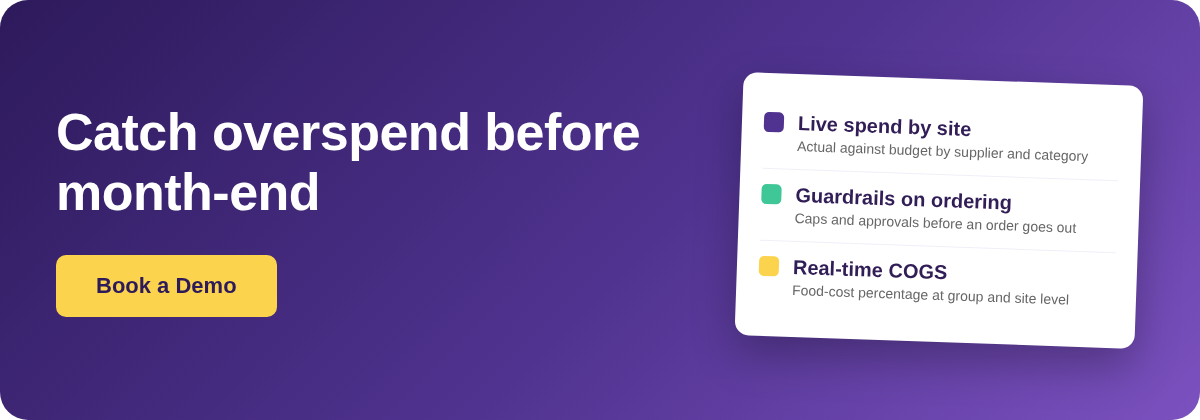
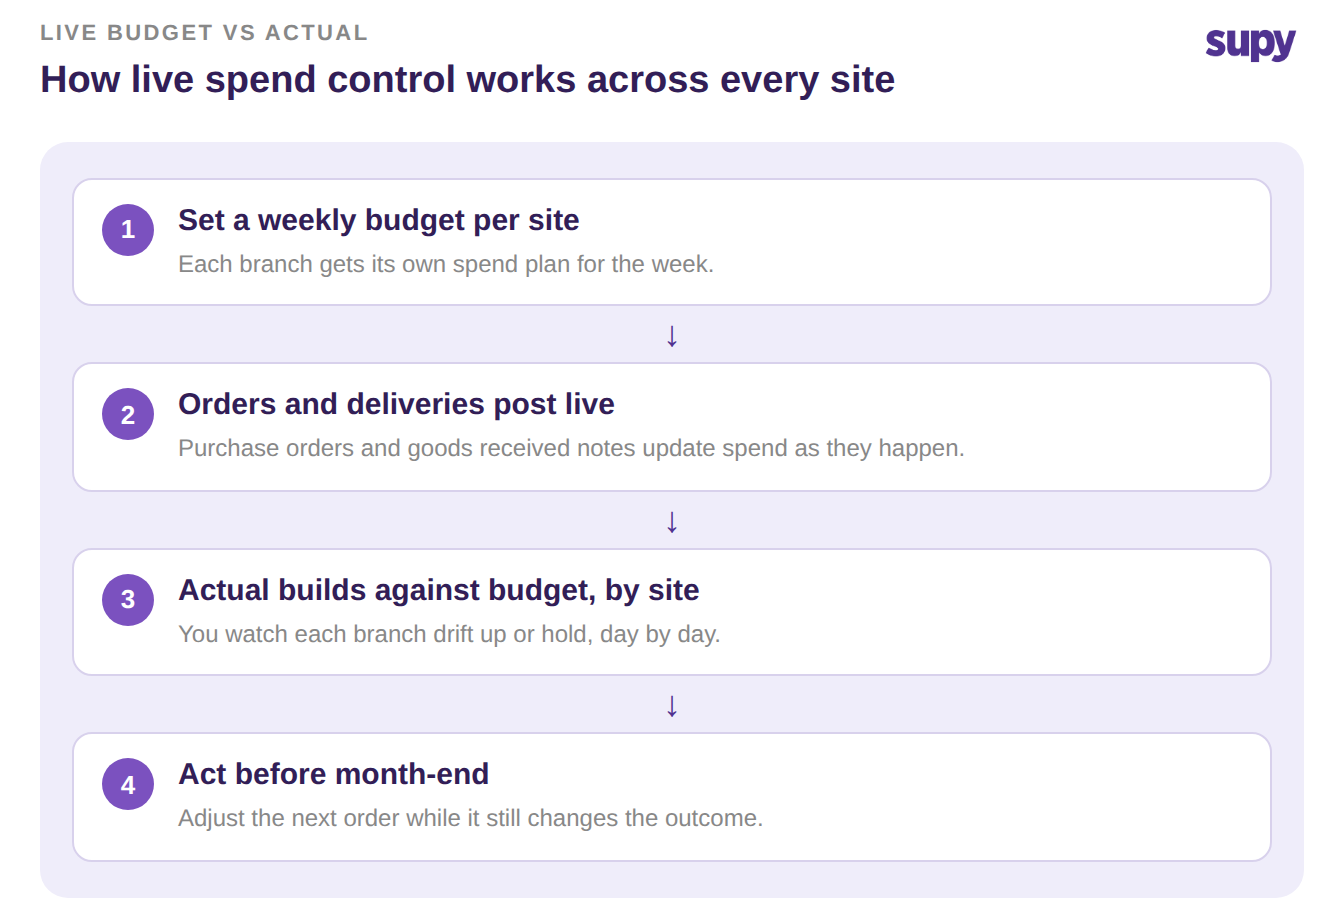
Budget vs actual food and beverage spend tracking sets what each site planned to spend, then measures what it actually spent as orders and deliveries post, not at month-end. For a multi-site group, doing it live means an overspending branch, supplier or category shows up within days. That head start is the difference between adjusting next week's order and explaining a lost month.
Most groups still run this in reverse. Costs get reviewed after the period closes, once the margin is already gone. By then the only move left is to promise a better result next month.
A live view flips the order. You set a weekly budget per site. Actual spend builds against it as purchase orders go out and deliveries land. The moment a branch drifts, you see it and act.
The generic budget-versus-actual advice online stops at a spreadsheet template. None of it connects the variance to live purchasing and cost data, or to controls at the site placing the orders. That is the gap this guide covers: an operational view built on real spend, not a monthly reconciliation you fill in by hand.
Break Actual Spend Down by Site, Supplier, and Category
The actual side is only useful if you can see where it came from. A single group number tells you that you are over. It does not tell you which branch, which supplier or which category to call about today.
Supy's purchasing dashboard breaks actual food and beverage spend down by location, supplier and item category for any period you choose. You compare sites side by side, see which locations or suppliers are driving an increase, and export the detail for finance. Because the same view slices by category, a group total resolves into a specific line you can act on.
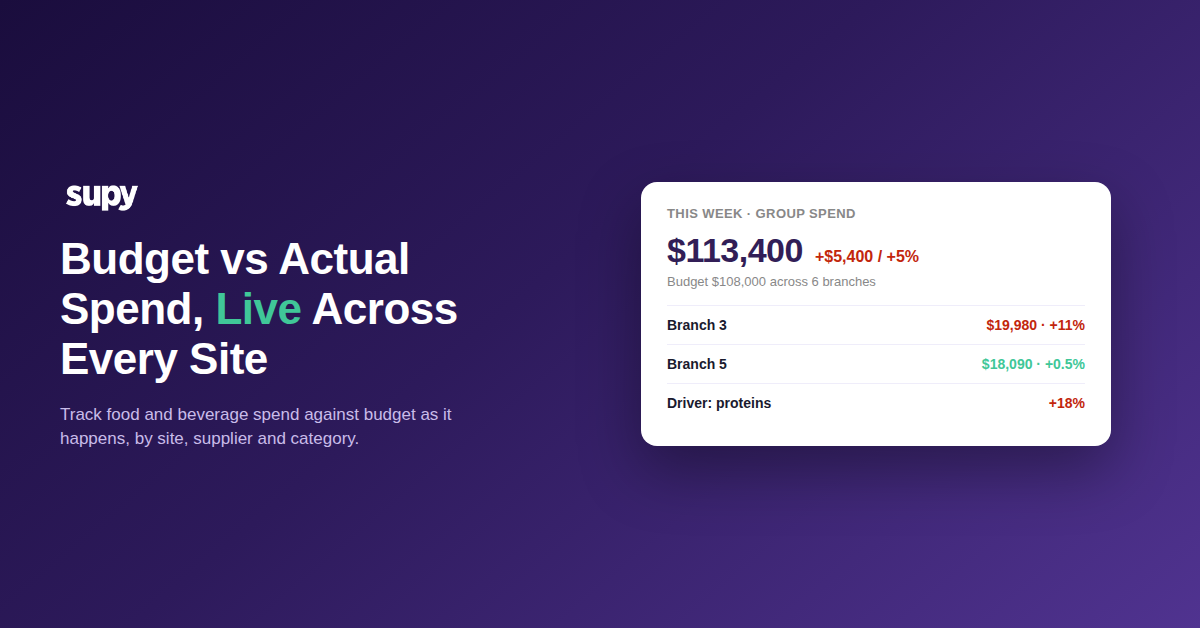
Take an illustrative six-site group on a USD 18,000 weekly budget per branch, so USD 108,000 across the group. One week actual lands at USD 113,400, a USD 5,400 overspend, five percent above plan. The group number alone would send you hunting. The breakdown points straight at one branch.
Branch 3 ran USD 19,980 against its USD 18,000 budget, an eleven percent overspend, while Branch 5 held at USD 18,090. Drill into Branch 3 by category and the driver is obvious.
| Category | Budget | Actual | Variance |
|---|---|---|---|
| Proteins | $7,200 | $8,500 | +18.1% |
| Produce | $3,600 | $3,960 | +10.0% |
| Dry goods | $1,800 | $1,920 | +6.7% |
| Dairy | $2,160 | $2,280 | +5.6% |
| Beverage | $3,240 | $3,320 | +2.5% |
| Total | $18,000 | $19,980 | +11.0% |
Proteins carried most of the overspend, traced to a nine percent price rise from one produce and protein supplier. That is a specific conversation: renegotiate, switch, or adjust the menu. It is not visible in a group total, and it is gone by the time a month-end report surfaces it.
Watch Live Cost of Goods Sold and Food-Cost Percentage by Site
Spend against budget answers how much. Cost percentage answers whether the spend was healthy for the sales it produced. You want both, and you want them without waiting for a close.
Supy surfaces live cost of goods sold (COGS) and food-cost percentage at group, individual site and menu-category level at the same time. You see where actual spend sits against theoretical cost as the week runs. A gap between what a site should be spending and what it actually spends is visible now, not after a manual spreadsheet build.
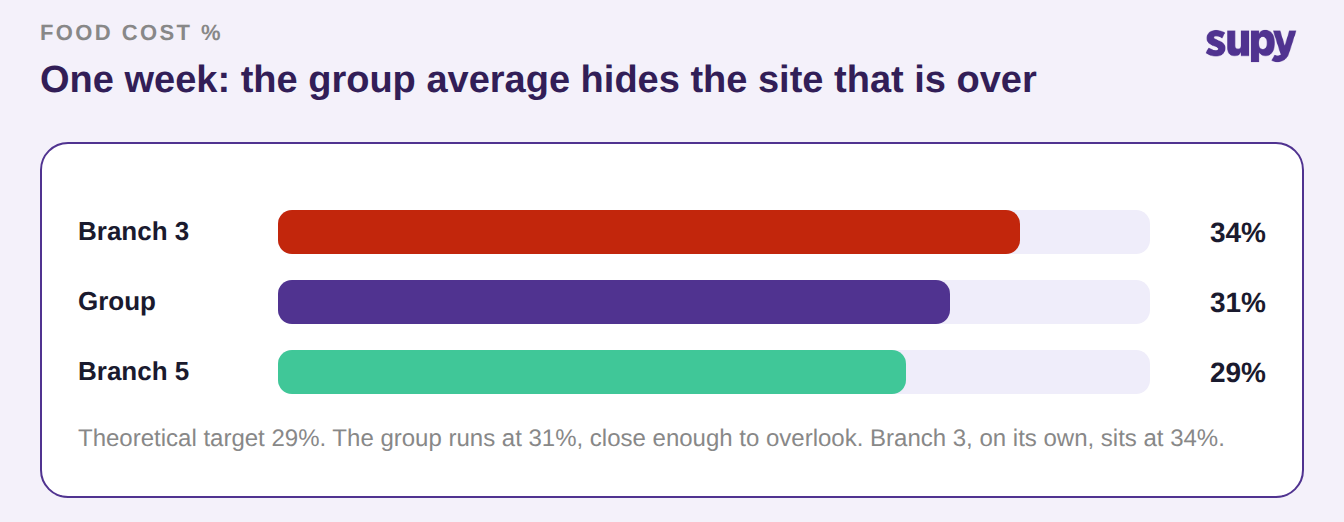
In the same illustrative group, theoretical food cost sits at 29 percent. The group actual runs at 31 percent, which looks close enough to ignore. Branch 3, viewed on its own, is at 34 percent. The site-level number is the one that tells you where to look; the group average hides it. It is the same pattern that shows up in multi-site gross profit reporting, where a healthy group line can sit on top of one site quietly dragging.
That is the point of holding all three levels together. A calm group figure and a hot single site can live inside the same week, and only the split view shows you which is which.
Set Spend Guardrails Before the Order Goes Out
Seeing overspend fast is worth more when you can stop some of it before it happens. If site managers order freely with no controls, budget vs actual becomes a report card you read after the fact rather than a limit that holds.
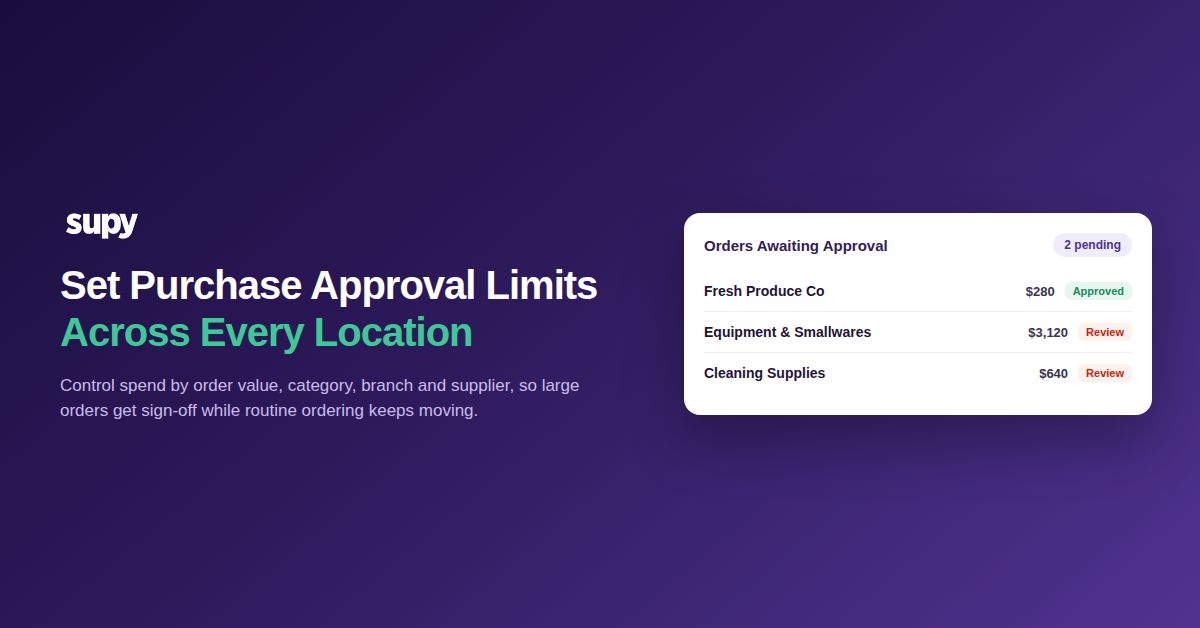
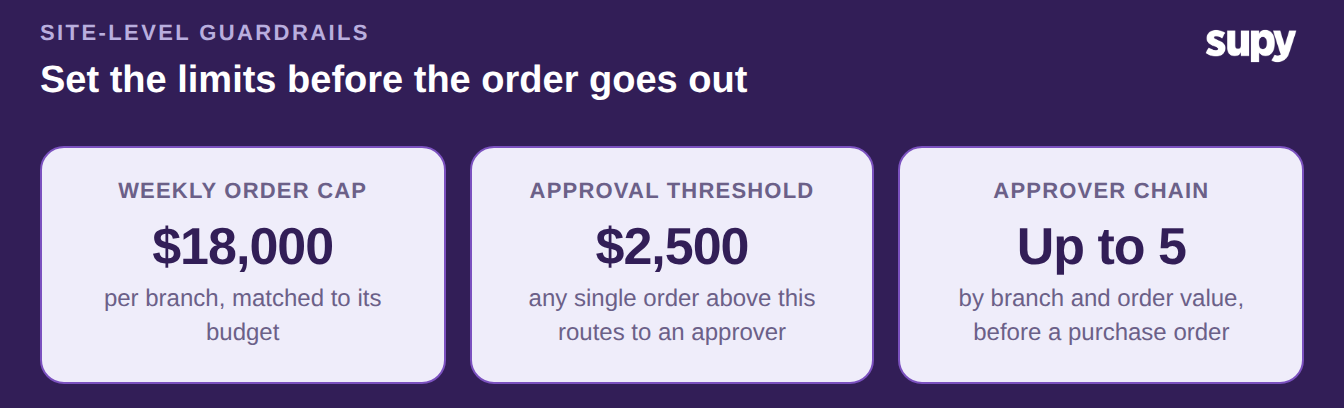
Supy's spending policies and guardrails set limits per location, supplier and frequency, scoped to a site, region or individual, with defined approvers. Permissions and limits add sequential approvals, up to five approvers, triggered by branch and order value, plus purchase-order value caps by supplier, branch, category, user or par. You can set the rules by day, week, month or quarter.
In practice, a branch can carry a weekly order ceiling near its USD 18,000 budget. Any single order above a set threshold, say USD 2,500, then routes to an approver before it becomes a purchase order. The budget stops being a hope and becomes a rule the ordering flow enforces.
Operators increasingly want the budget itself tied to recent trading, setting next week's ordering allowance from last week's actual spend. Guardrails are how you hold whatever number you land on: the control lives at the point of ordering, at the site, before the money is committed.
Make Actual Spend Reconcile to Your Accounts
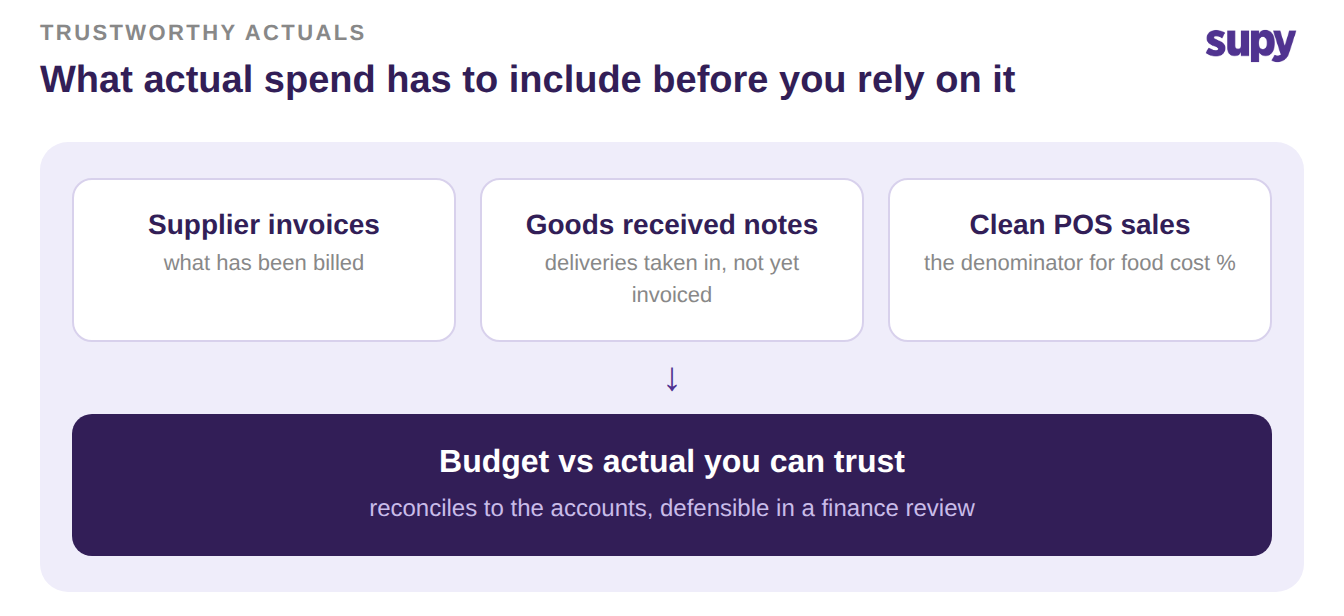
A budget vs actual view is only as trustworthy as the spend feeding it. Two gaps quietly break it, and both are fixable before you rely on a single number.
The first is timing. Actual spend has to include goods you have received but not yet been invoiced for. If the view counts invoices only, a delivery that arrived Friday is missing until the invoice posts, and the week looks cheaper than it was. Capturing spend at the goods-received note, when stock physically lands, closes that gap so actual reconciles to what the accounts will eventually show.
The second is the sales side. Food-cost percentage divides cost by sales, so a broken point-of-sale feed distorts every percentage built on it. If that data is not clean, fix it first; a variance you cannot trust is worse than no variance at all.
Get both right and the live number becomes something you can defend in a finance review, not just a dashboard you glance at. That is when proactive spend control actually holds across every site.
Run your own numbers this week. Take one site's weekly budget, pull its actual spend including received-but-uninvoiced deliveries, and read the variance as a percentage. If a site is more than a point or two over budget two weeks running, that is your signal to act, and the category and supplier breakdown tells you where. Set one guardrail on the branch that drifts most: a weekly ceiling and an approval threshold on large orders. Live budget vs actual only pays off when what you see turns into what you change.