Food cost

Restaurant Food Yield Percentage: Where Multi-Site Recipe Costs Drift
Restaurant food yield percentage is one of the few food-cost numbers you can measure, chart, and act on the same week. Get it right and every plate cost you carry reflects what the kitchen actually pulls from stock. Get it consistent across sites and your group costs stop drifting apart for reasons no one can name.

This guide covers the calculation, then the part generic calculators skip: where that percentage quietly drifts once you run more than one kitchen.

How to Calculate Food Yield Percentage

Restaurant food yield percentage is the share of a raw ingredient that survives prep and reaches a plate or a finished batch. You weigh what you start with, weigh what is usable after trimming and portioning, and divide. The formula is yield % = (usable weight / starting weight) x 100.

Take a whole beef striploin. You start with 5.0 kg. After trimming fat and silverskin you have 3.9 kg of usable steak. That is a 78% yield, and it is the number your recipe cost should be built on, not the 5.0 kg you paid for.

Food yield percentage worked example: 5.0 kg beef striploin trims to 3.9 kg usable, a 78 percent yield


The mechanics of turning that yield into a recipe cost are their own topic. Our guide to restaurant yield costing walks through costing a recipe from yield, and you can pressure-test a single item in the food cost calculator. This article stays on the percentage itself, because that is what moves once you scale.

Where Yield Percentage Drifts Across Sites and Recipes

Here is the part a single-kitchen calculator never shows you. A yield percentage is not one fixed number. It moves by supplier, by cut, by station, and by site. A fixed theoretical figure hides all of that.

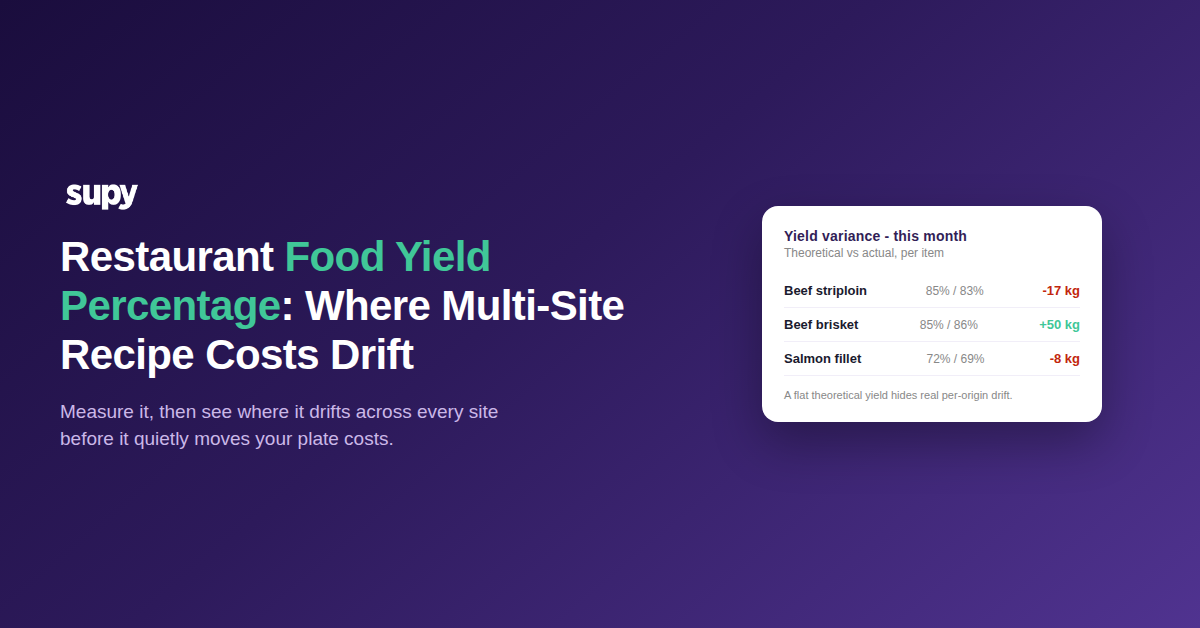
A central kitchen carried a flat 85% theoretical yield on semi-finished beef. Actual daily yield ran between 83% and 86%. Over one month that spread added up to real cost variance on two beef origins bought under the same recipe.

ItemTheoreticalActualVariance
Beef striploin (Origin 1)85%83%-17 kg / -$204
Beef brisket (Origin 2)85%86%+50 kg / +$450
Salmon fillet72%69%-8 kg / -$152


The pattern matters more than any single row. When your costed theoretical yield never changes but the real number drifts a few points per site, plate costs go wrong quietly. Nothing looks broken. The margin just erodes. Seeing it needs actual yield measured against theoretical, per item and per site, which is what live variance reporting does across a group. If you also record real production quantities per batch, our guide to prep recipe yield and batch production tracking covers that side.

Prep Wastage vs Portion Yield: The Fields Operators Confuse

Two recipe fields both adjust for loss, and mixing them up is the fastest way to a wrong cost. The rule is short. Prep wastage is for trim loss on an ingredient you still use most of. Portion yield is for when the item is wholly discarded, or when you know the finished batch weight and cost back from it.

Set prep wastage to 99% or 100% to model a largely discarded ingredient and you get impossible recipe costs, because the field was never meant to carry that case. The same confusion hides on separated ingredients. Cost an egg yolk at the whole-egg price of $0.22 with no yield allowance and the true yolk cost is close to $0.73, roughly three times what the recipe carries.
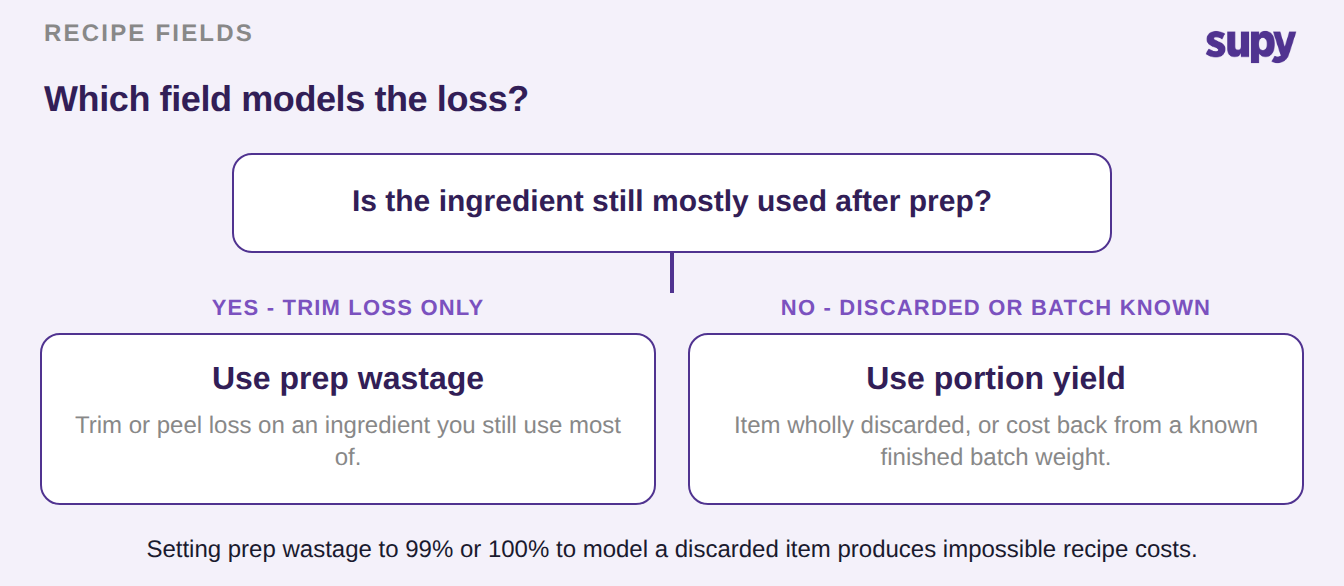
Decision guide: use prep wastage for trim loss on an ingredient still mostly used, use portion yield when the item is discarded or the batch weight is known


Getting these two fields right is a per-ingredient discipline, and stale or misused percentages are worth auditing on their own. Our guide to stale prep wastage percentages and variance goes deeper than we will here.

Keeping Theoretical Cost Honest as You Scale

You do not fix drift by re-weighing every delivery by hand. You fix it by making the costed number reflect real loss and then watching where actual pulls away from it.

Supy grosses up each recipe ingredient by its own prep-wastage rate, so the theoretical cost reflects what the kitchen actually pulls from stock, not just what reaches the plate. An ingredient set at 8% prep wastage is grossed up so the recipe pulls about 1.09 times the plated quantity. Each ingredient carries its own rate, configured once, flowing into every recipe that uses it.

How a per-ingredient prep-wastage rate keeps recipe cost honest: rate set once, recipe grosses up about 1.09x, drift stays visible on dashboards


From there, theoretical-versus-actual usage and variance show up per item, per category, and per site on your dashboards. A two-point drift at one branch becomes visible instead of buried. You can see the mechanics on the recipes and prep recipes page, and the group-level variance view on restaurant analytics.

Put your yield numbers to work this week. Start with one high-value protein. Weigh it in and weigh the usable output for a week, then compare the real yield to the theoretical figure your recipe carries. If actual sits 2 points or more below theoretical for a month, re-cost the recipe on the real number.

Then repeat for your next most expensive ingredient, and check the same item at each site rather than assuming one kitchen speaks for all of them. Small, measured, and per-site beats one clever calculation you never revisit.


Book a Demo with Supy - keep restaurant plate costs honest as you scale

Ready to optimize your restaurant operations?

Blog

Our operational insights

No items found.

Your questions 
answered

Everything you need to know about Supy — from setup to integrations, pricing, and daily use. If it’s not covered here, just ask.

What is restaurant food yield percentage?
+

Restaurant food yield percentage is the share of a raw ingredient that survives prep and reaches a plate or a finished batch. You weigh what you start with, weigh what is usable after trimming and portioning, then divide the usable weight by the starting weight and multiply by 100. It matters because your recipe cost should be built on the weight that actually reaches the dish, not the weight you paid for. On high-value proteins the gap between the two is where plate costs quietly go wrong across a group.

How do you calculate food yield percentage?
+

How you calculate it is simple: yield percentage equals usable weight divided by starting weight, times 100. Take a whole beef striploin at 5.0 kg. After trimming fat and silverskin you are left with 3.9 kg of usable steak, which is a 78 percent yield. Build the recipe cost on that 3.9 kg, not the 5.0 kg you bought. Weigh the raw input and the usable output the same way each time so the number is comparable, and record it per ingredient so the yield you cost with reflects the yield your kitchen actually gets.

Why does food yield percentage drift across sites?
+

Yield drifts because a yield percentage is a real measurement, not a fixed constant, and it moves by supplier, by cut, by station, and by site. A central kitchen carrying a flat 85 percent theoretical yield on semi-finished beef can see actual daily yield run between 83 and 86 percent. Over a month that spread adds up to real cost variance across two beef origins bought under the same recipe. When the costed theoretical figure never changes but the real number moves a few points per site, plate costs erode quietly and nothing looks broken until you measure actual against theoretical.

What is the difference between prep wastage and portion yield?
+

What separates them is which loss they model. Prep wastage is for trim or peel loss on an ingredient you still use most of. Portion yield is for when the item is wholly discarded, or when you know the finished batch weight and cost back from it. Mixing them up is a common source of wrong recipe costs. Set prep wastage to 99 or 100 percent to model a largely discarded ingredient and you get impossible costs, because the field was never meant to carry that case. Pick the field that matches how the ingredient is actually used.

How does food yield percentage affect recipe and plate cost?
+

Yield percentage sets the true unit cost of every ingredient that loses weight in prep. Cost a recipe on the raw purchase weight and you understate what each portion really uses, so the plate cost you carry is wrong. The effect is largest on separated or semi-finished ingredients. Cost an egg yolk at the whole-egg price of 0.22 dollars with no yield allowance and the true yolk cost is close to 0.73 dollars, roughly three times what the recipe carries. Applying the right yield per ingredient is what keeps the plate cost you report honest.

What is a good food yield percentage?
+

What counts as good depends entirely on the product and the cut, so there is no single target that fits every ingredient. A whole fish, a primal beef cut, and a bag of leafy greens all yield very differently, and comparing them against one number tells you nothing. The useful benchmark is your own: track actual yield against the theoretical figure your recipe carries, per item and per site. If actual sits two points or more below theoretical for a month, that item is worth re-costing on the real number rather than chasing a generic industry figure.

How does Supy keep yield-adjusted costs accurate?
+

Supy grosses up each recipe ingredient by its own prep-wastage rate, so the theoretical cost reflects what the kitchen actually pulls from stock, not just what reaches the plate. An ingredient set at 8 percent prep wastage is grossed up so the recipe pulls about 1.09 times the plated quantity, and each ingredient carries its own rate, configured once and flowing into every recipe that uses it. From there, theoretical versus actual usage and variance show up per item, per category, and per site on your dashboards, so a two-point drift at one branch is visible instead of buried.

Ready to transform your operations?

Join 3500+ restaurant operators cutting costs, streamlining operations and making smarter decisions with Supy.