.jpg)


Restaurant Food Waste Statistics: Seafood and Meat Are Wasted Most
What national food waste statistics leave out
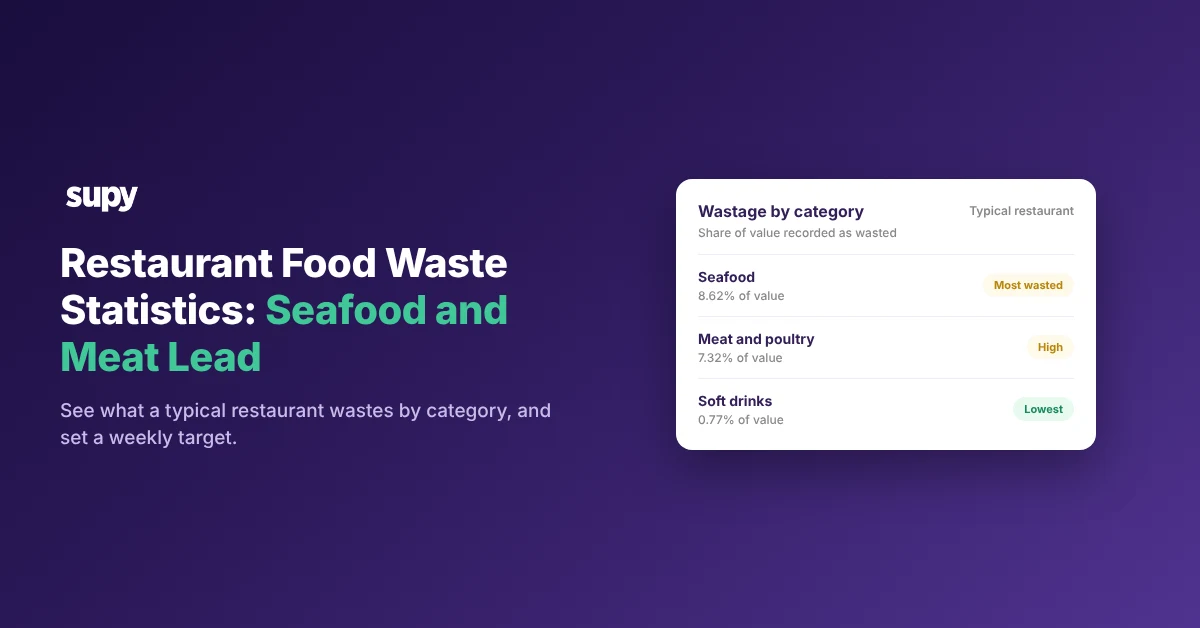
Across the typical restaurant, waste concentrates in the most expensive ingredients, not the cheap ones. Supy's recorded data puts seafood at 8.62% of its value wasted and meat and poultry at 7.32%, against 0.77% for soft drinks. National food waste statistics give sector tonnage, not the items draining your own kitchen. This article shows what a typical restaurant wastes by category, why seafood and meat lead, and how to set a weekly target.
National food waste statistics measure the whole sector. They add up tonnage across every restaurant in a country, or put one dollar figure on the industry. A policy team can use that. A head chef deciding what to fix this week cannot, because the number never points to a shelf, an item or a category.
Two things are missing from those figures:
- Category. A national total does not say whether your waste sits in seafood, in prep trim or in soft drinks, and each one needs a different fix.
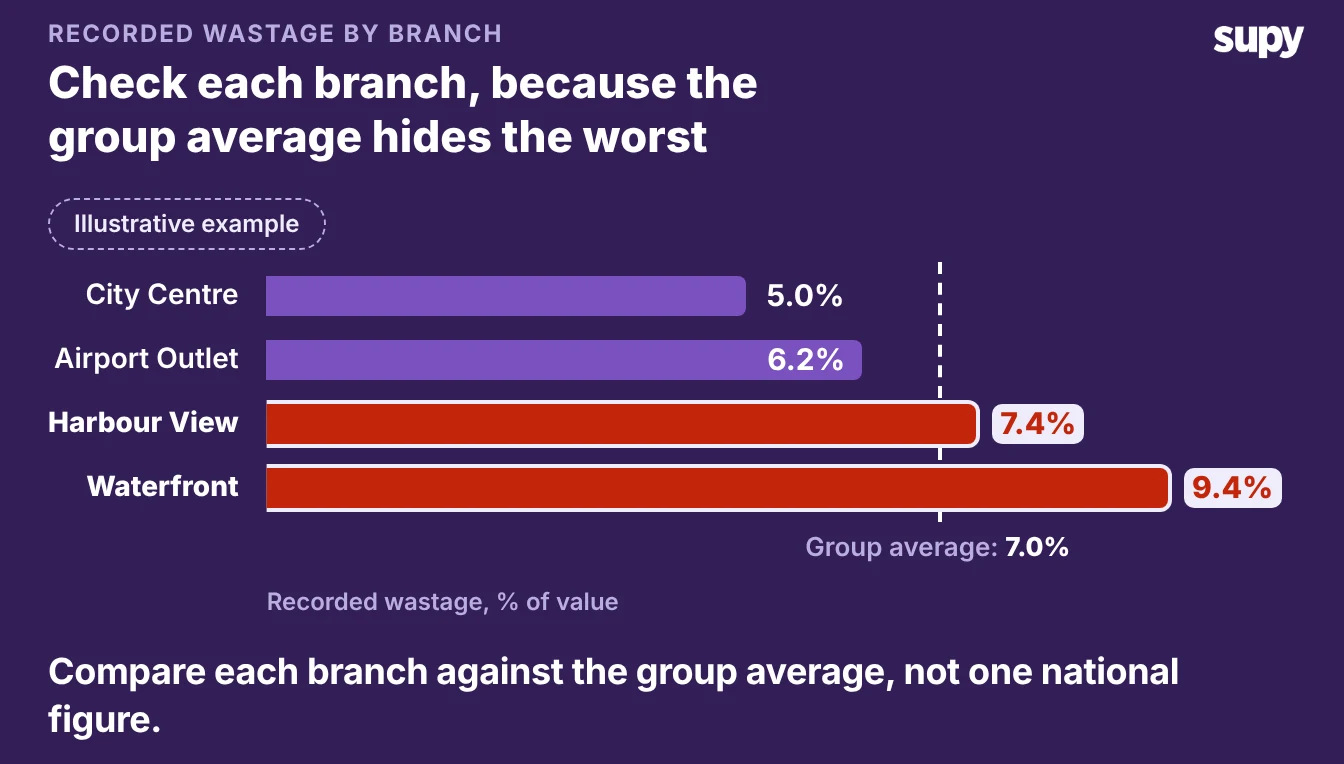
- Your own site. A sector average hides the gap between your best branch and your worst, so you cannot tell which kitchen to visit first.
The rest of this post uses Supy's recorded wastage data, drawn from restaurants that log wastage by item and reason, to fill both gaps. If you want to set up that tracking first, read our guide to tracking restaurant food waste.
What a restaurant wastes by category
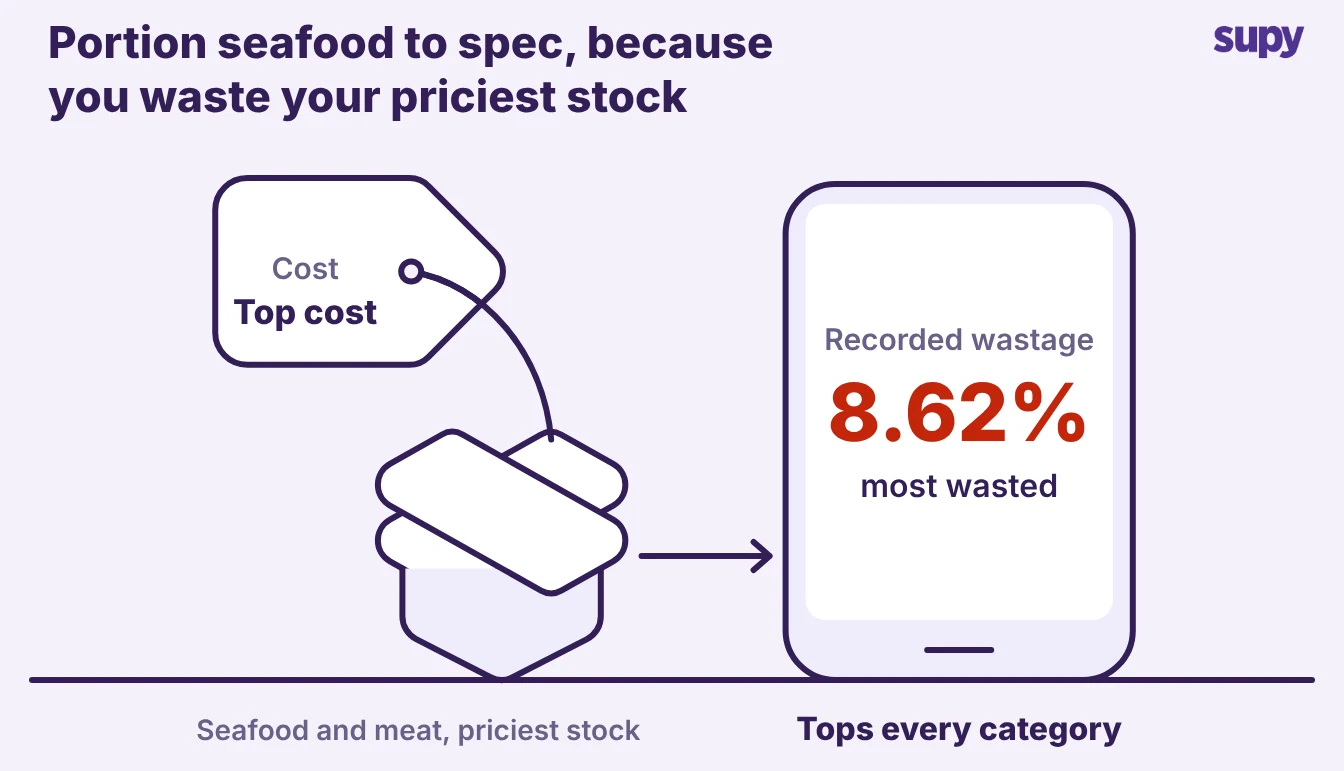
Seafood is the category the typical restaurant wastes most, at 8.62% of its value, with meat and poultry close behind at 7.32%. These figures come from Supy's own recorded data, published in The Spread. They cover the median restaurant for each category, over a trailing twelve months, across at least thirty businesses.
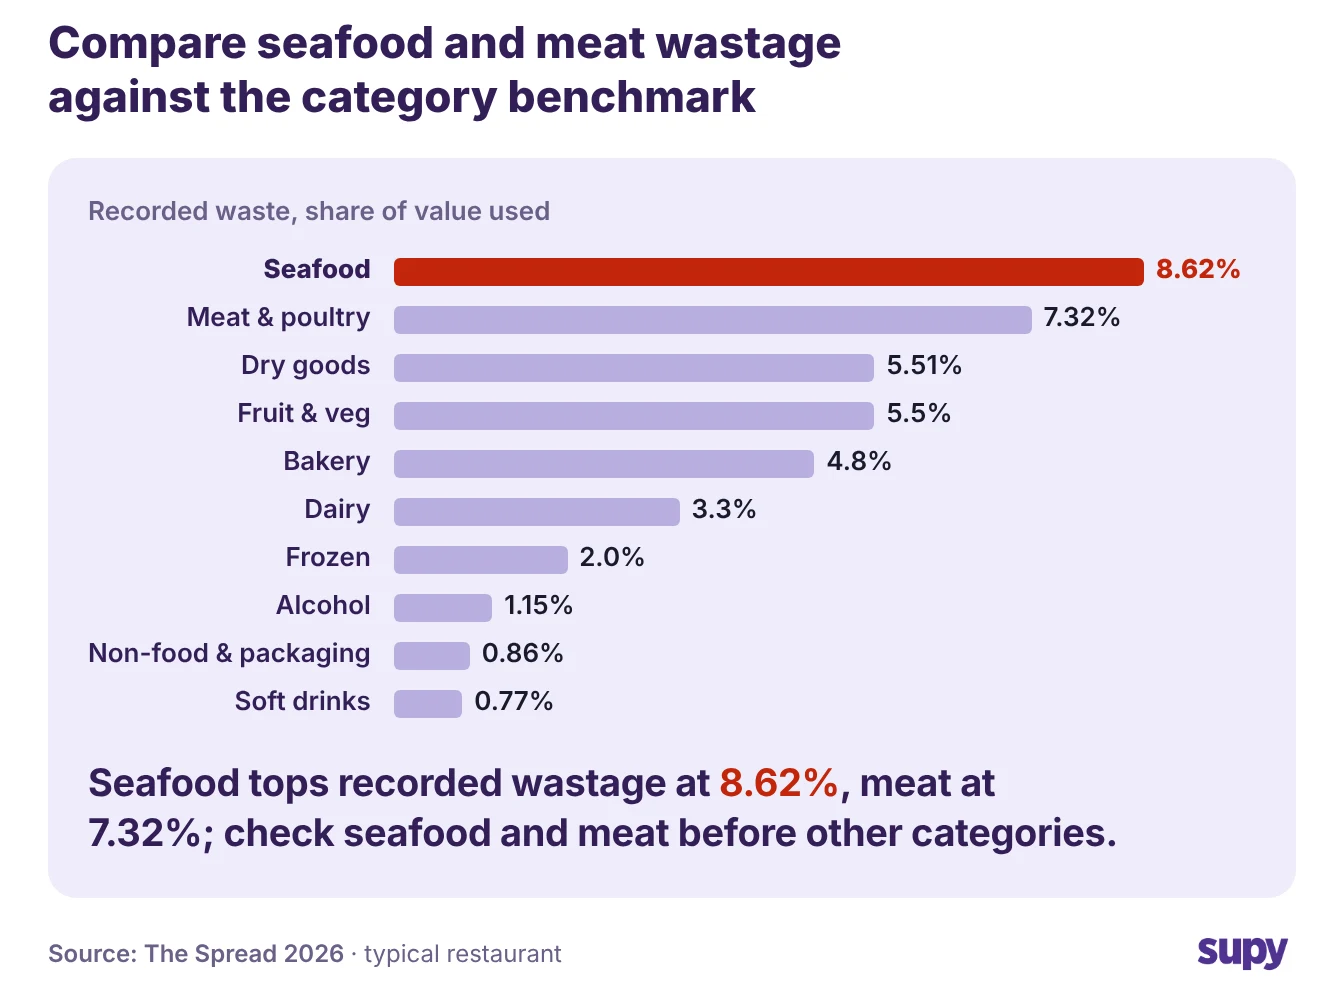
The ranking holds steady from top to bottom. Dry goods and fruit and veg sit in the middle, around 5.5% each. Bakery is near 4.8%, and dairy, frozen, alcohol and packaging fall away below that. Soft drinks waste almost nothing, 0.77%, because a sealed bottle does not spoil, get over-portioned or come back from a table half eaten.
These shares count only the wastage that staff logged, so the low categories are floors, not final figures. Read the chart as a ranking you can trust at the top and a minimum everywhere else.
Why seafood and meat are wasted most
Seafood and meat top the list for two reasons. They are the hardest ingredients to handle without loss, and the most expensive when you lose them. A whole fish or a primal cut has to be trimmed, portioned and stored with no margin for error. Every gram of trim and every over-cut portion is value you have already paid a premium for.
Three handling steps drive most protein wastage:
- Trim and butchery. Breaking down a whole fish or a primal cut leaves bone, skin and off-cuts. Some of that is unavoidable, but a cook working fast, or working from a cut they do not know well, leaves more on the board than they need to.
- Over-portioning. A steak cut 20 grams heavy, plated hundreds of times a week, is a steady loss of your most expensive stock. It never shows on a single plate, only in the month-end variance.
- Spoiling before service. Fresh protein has a short window. Over-prep for a quiet night, a warm fridge, or a late delivery, and the product is gone before you can sell it.
The pattern holds across the top categories. The more an ingredient costs, and the more a person handles it, the more of its value ends up in the bin.
Why your recorded food waste understates the real figure
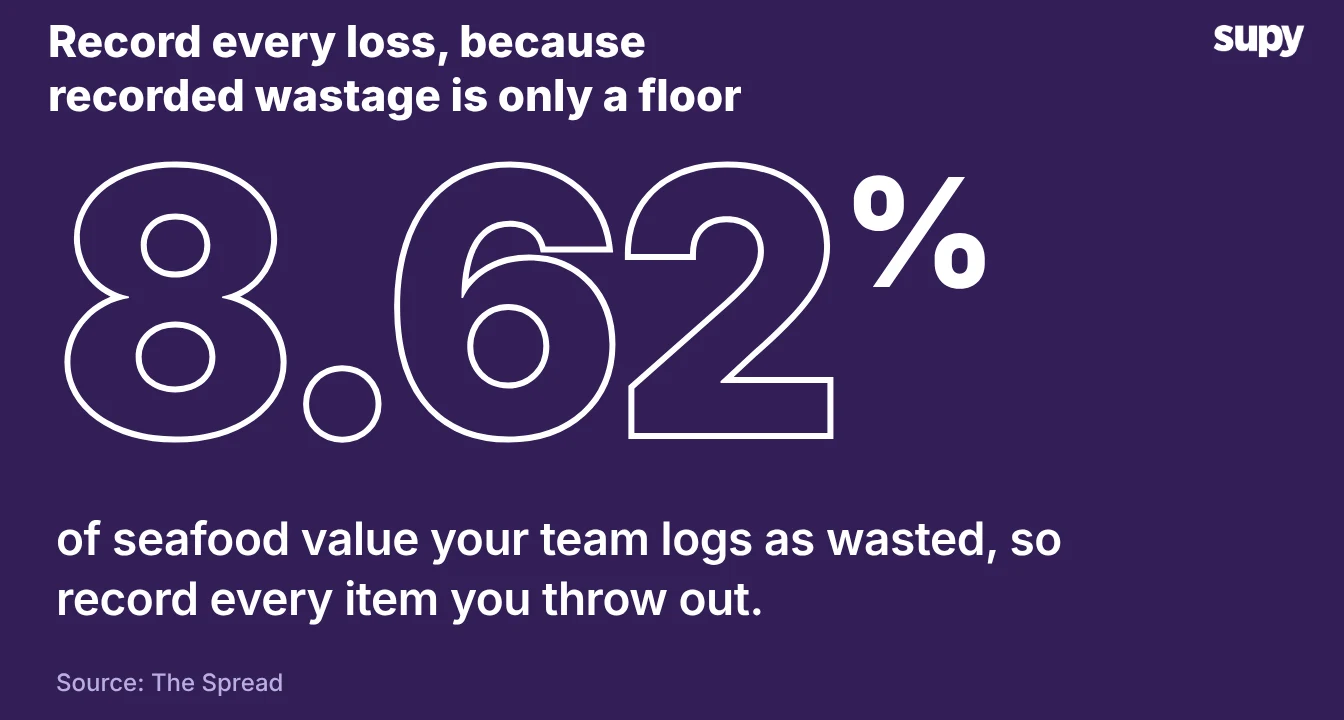
Your recorded wastage is a floor, not a ceiling. Every category figure above counts only the wastage that someone stopped to log. So the real number runs higher in every kitchen, and much higher in kitchens that log little.
Two habits keep recorded wastage below the truth:
- Wastage that nobody logs. A site that tracks sales on its point-of-sale system but never records wastage sees none of it in its numbers, so its reports look clean while its stock quietly runs down. The variance appears only at the month-end count, and nobody can explain it.
- Catch-all reasons. When a cook logs everything as "end of day" or "other", the total might be right but the cause is lost. You cannot fix a problem you cannot name, so the wastage logged without a real reason is only slightly more useful than the wastage nobody logs.
Treat the category benchmarks as the minimum you should expect to find once you log properly. A kitchen recording far less than 8.62% seafood wastage has probably not caught all of it yet.
Turning your wastage records into a weekly target
The move is to log wastage the same way every day, compare your own category shares against these benchmarks, and set one weekly target. National statistics cannot do this for you; your own records can.
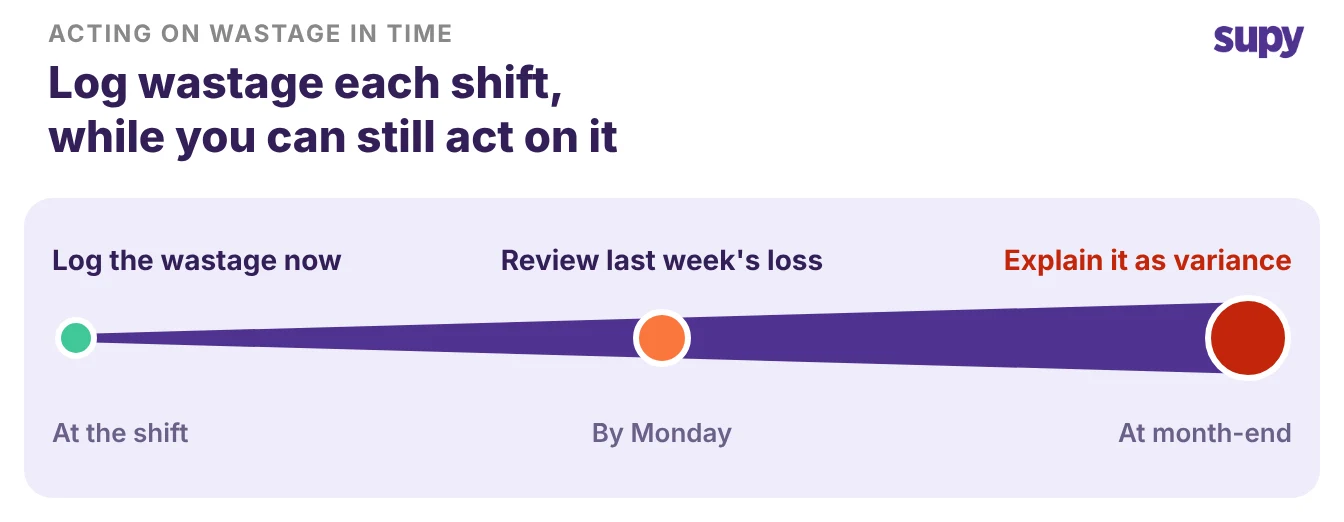
Start where the money is. Seafood and meat top the benchmark, so log them first, by item, quantity and reason, every shift. Supy records wastage by item, quantity and reason and shows the cost impact by site, category and period. You can see what the fish you lose on Tuesday cost that branch, instead of meeting an unexplained variance at month-end.
Then set the target:
- Pick the category costing you most. Usually seafood or meat. Compare your logged share against the benchmark: 8.62% for seafood, 7.32% for meat and poultry.
- Set one number for the week. Not a vague "cut waste", but a share to beat, for one category, at one site.
- Check it on Monday. Read last week's logged wastage for that category, by reason, and act on the biggest reason first.
A national tonnage figure tells you the industry wastes food. Your own category shares tell you where yours goes, which item to cut first, and whether this week beat last week. That is the number worth tracking.