.jpg)


Restaurant Cost Centre Reporting: Multi-Site Profit by Category
What Cost Centre Reporting Shows a Multi-Site Restaurant Group
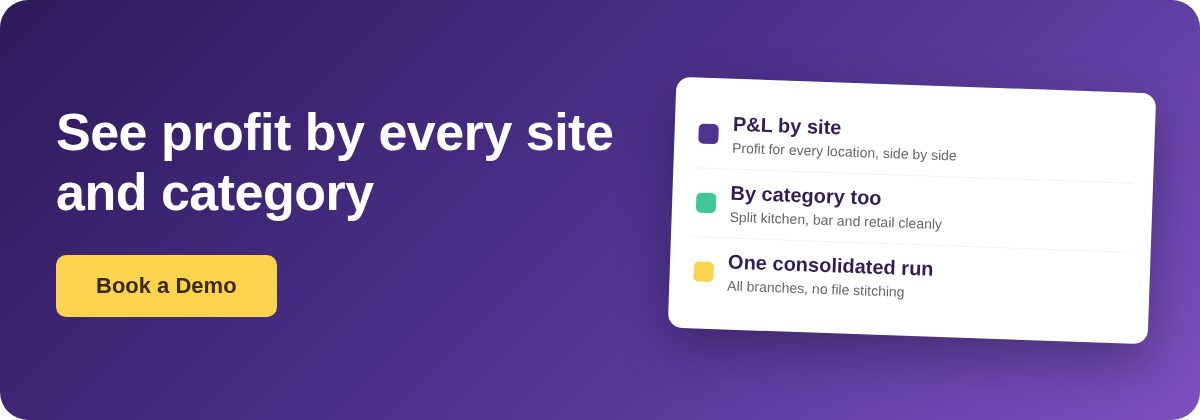
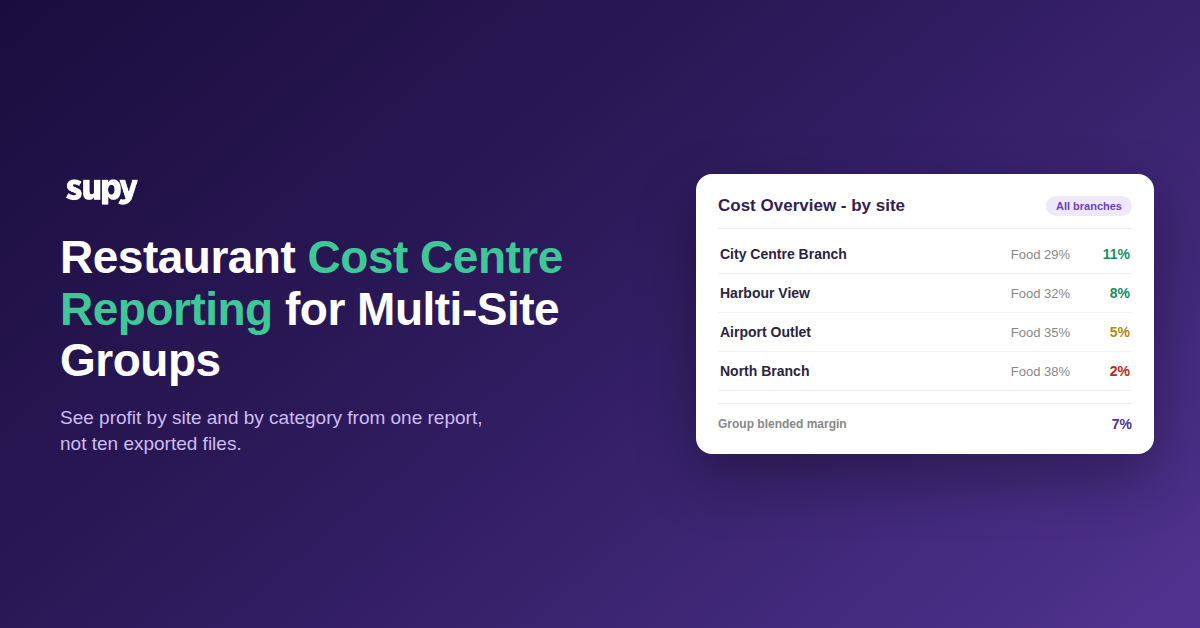
Cost centre reporting groups every cost and every sale under the part of the business that owns it. So multi-site restaurant groups can read a profit and loss (P&L) view by site and by category, not just one blended total. Done well it answers a plain question: which locations, and which parts of the menu, actually make money.
A cost centre is simply a slice of the operation you want to see on its own. That can be a site, a kitchen, a bar, or a whole brand inside the group. The value shows up the moment you stop looking at the group average.
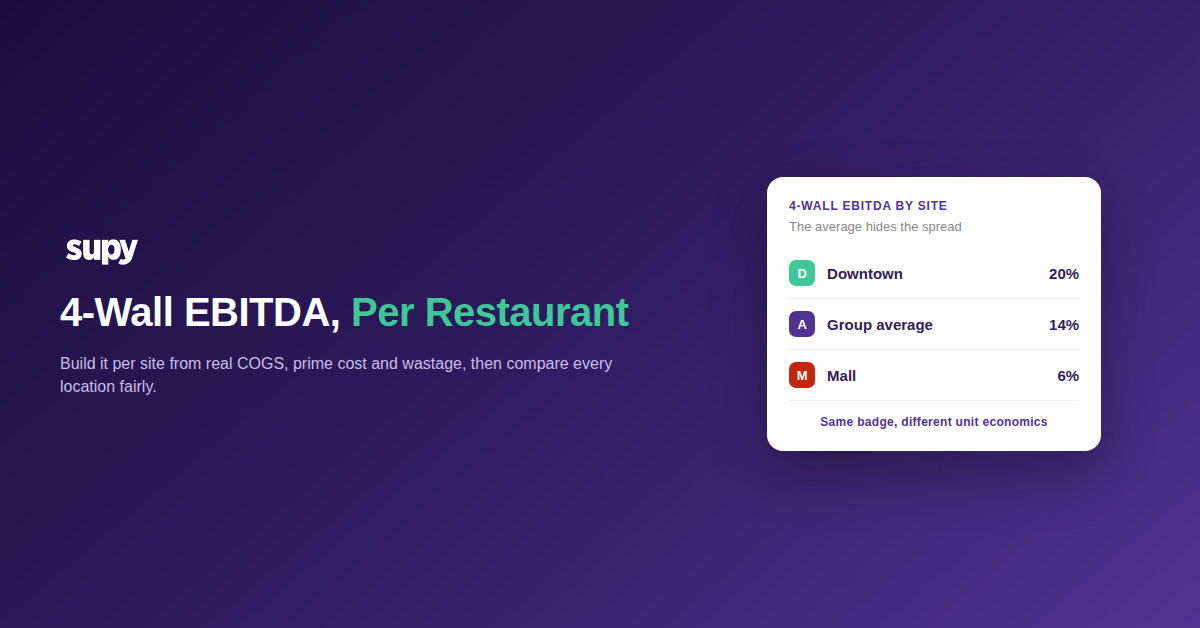
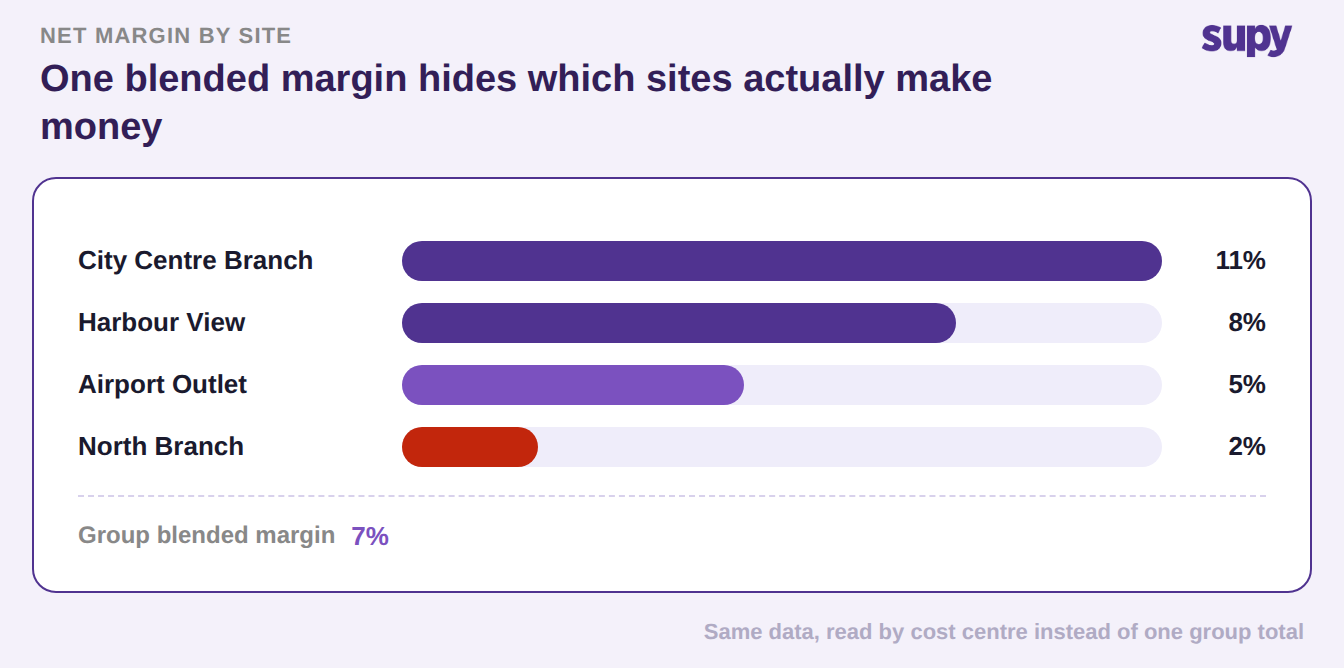
A blended margin hides the spread underneath it. One strong site can carry two that barely break even, and the group total never tells you. Reporting by cost centre puts each site and category side by side, so the weak ones have nowhere to hide.
Structure Your Cost Centres Before You Trust the Report
The report is only as honest as the structure under it. Operators who get this right decide their cost centres at setup, before the first invoice lands. Prospects routinely share their cost centre map on day one, because everything else keys off it.
Start with the site, then split by category inside each site. Most groups land on a short, stable set: kitchen, bar, and any part of the business with its own margin, such as retail or catering. Keep it small enough to read at a glance and consistent across every site, or the group roll-up will not line up. The split decides where each cost centre's cost of goods sold (COGS) lands.
| Cost centre | What it captures | When to split it out |
|---|---|---|
| Kitchen | Food prep and dining COGS | Always, it is your core food cost |
| Bar | Beverage COGS | When drinks are a real share of sales |
| Retail | Packaged goods sold to take away | When you sell retail alongside dining |
| Catering | Off-site covers and events | When catering runs its own margin |
| Central kitchen | Production sent out to sites | When one kitchen supplies several sites |
Get the split right and the platform holds you to it. In Supy each recipe is assigned to one or more cost centres within a branch, with revenue percentages set per location. The system checks the allocation is complete before it saves, so a cost never lands in an uncategorised bucket and quietly skews the report. Structure it once, and every report after that inherits it.
See One Profit and Loss View Across Every Site, Not Site-by-Site Exports
The old way is a spreadsheet marathon. Finance exports each location, then stitches the files together by hand to get a group view, and the group view is stale the day it is built. That is the job cost centre reporting is meant to remove.
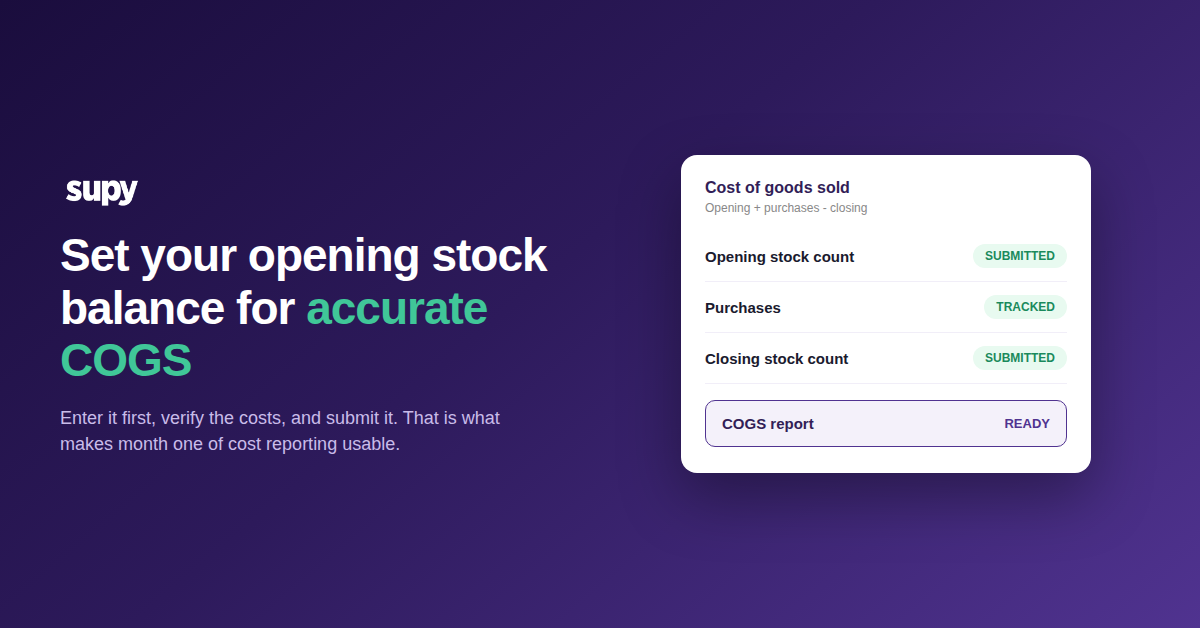
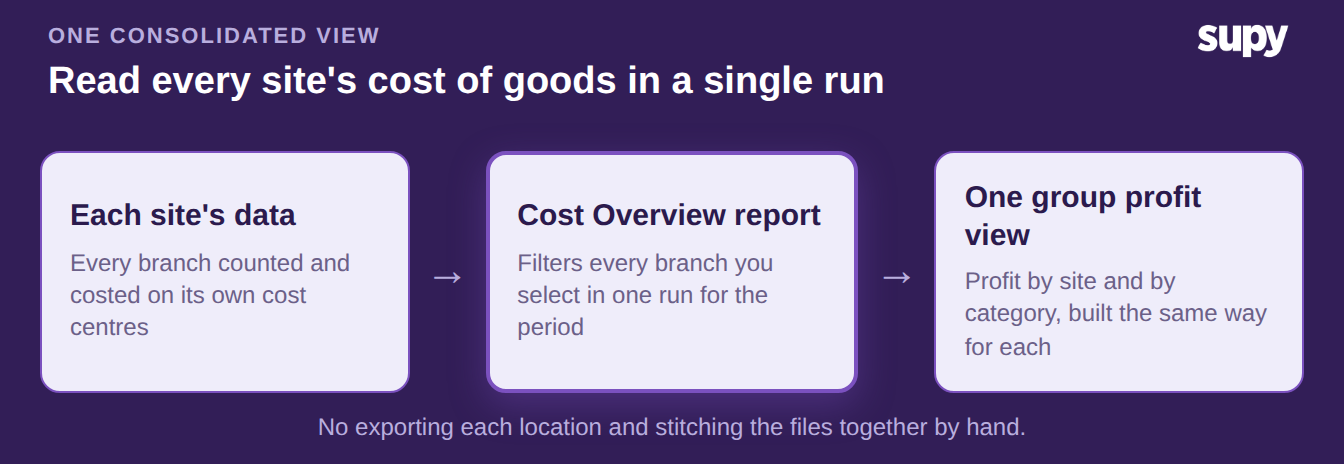
Supy's Cost Overview report reads across branches in a single run. It applies the same stock-count-bounded logic as the per-location report, so you get one consolidated cost-of-goods view across every site you select for the period you choose. Group dashboards then roll all entities up, and you compare food cost and margin across brands from one screen instead of ten tabs. For the deeper mechanics of a group-wide view, our guide to restaurant group COGS reporting walks through it.
The same data comes as interactive dashboards or a one-click export, across 95+ reporting dimensions. So the finance director slices it for the board and the site manager slices the same numbers for tomorrow's order, without a second source of truth. You can see the full restaurant analytics platform for how the cuts are built.
Why Your In-System Numbers Won't Match the Accounts
At some point finance will find a gap between the in-system cost centre P&L and the accounting P&L, and assume the system is wrong. Usually it is a setup problem, not a real cost movement. The three usual causes are unlinked recipes, items costed at the wrong price, and accidental dual cost centre tagging that counts the same COGS twice.
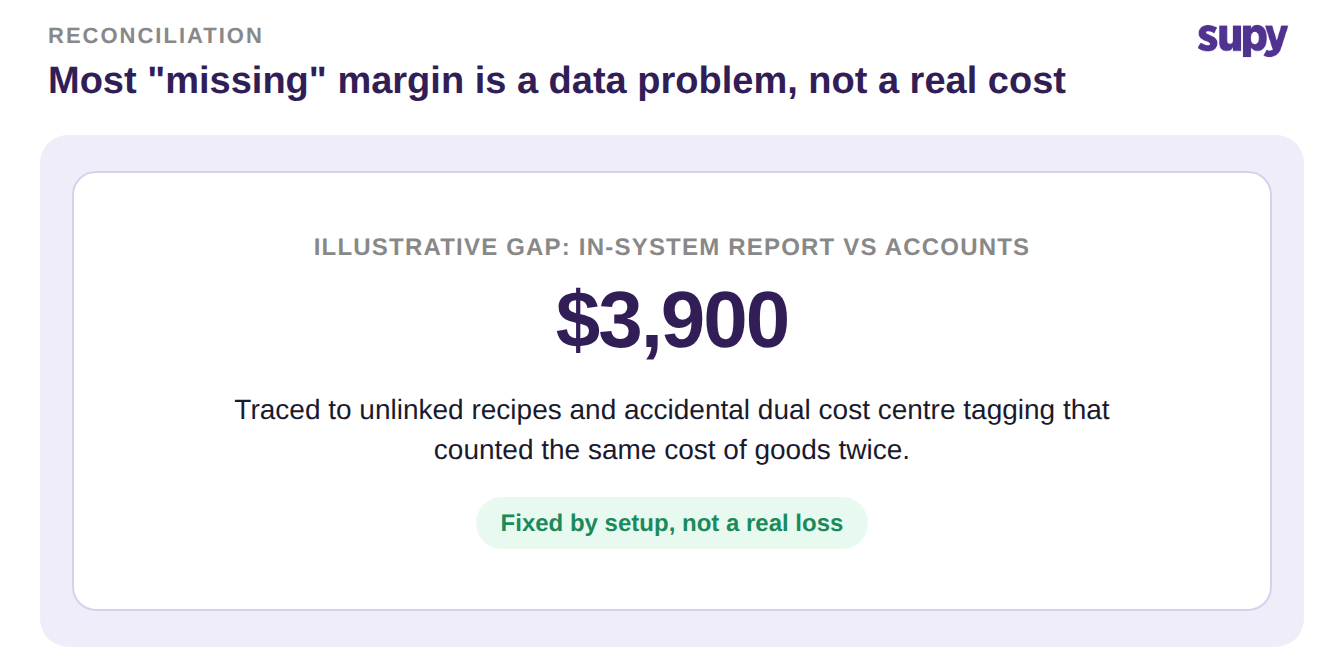
Reconcile before you doubt the numbers. Link every recipe so consumption posts to a cost centre. Check each item carries one cost centre unless a split is deliberate. Then match your cost centre map to the accounting cost centres one to one.
Deciding the structure is its own skill, and our note on cost centre versus location covers the common trap. Do this and the two P&Ls converge, and the report stops being something finance argues with.
Decide Whether Cost Centre Reporting Earns Its Setup
This pays off most for operators who actively manage cost of goods. If you run thin margins across several sites, any inaccuracy in COGS is a direct financial risk, so a trustworthy per-site P&L is worth the setup. If food is not your core cost, or you do not track consumption closely, the return is smaller and you can keep the structure simple.
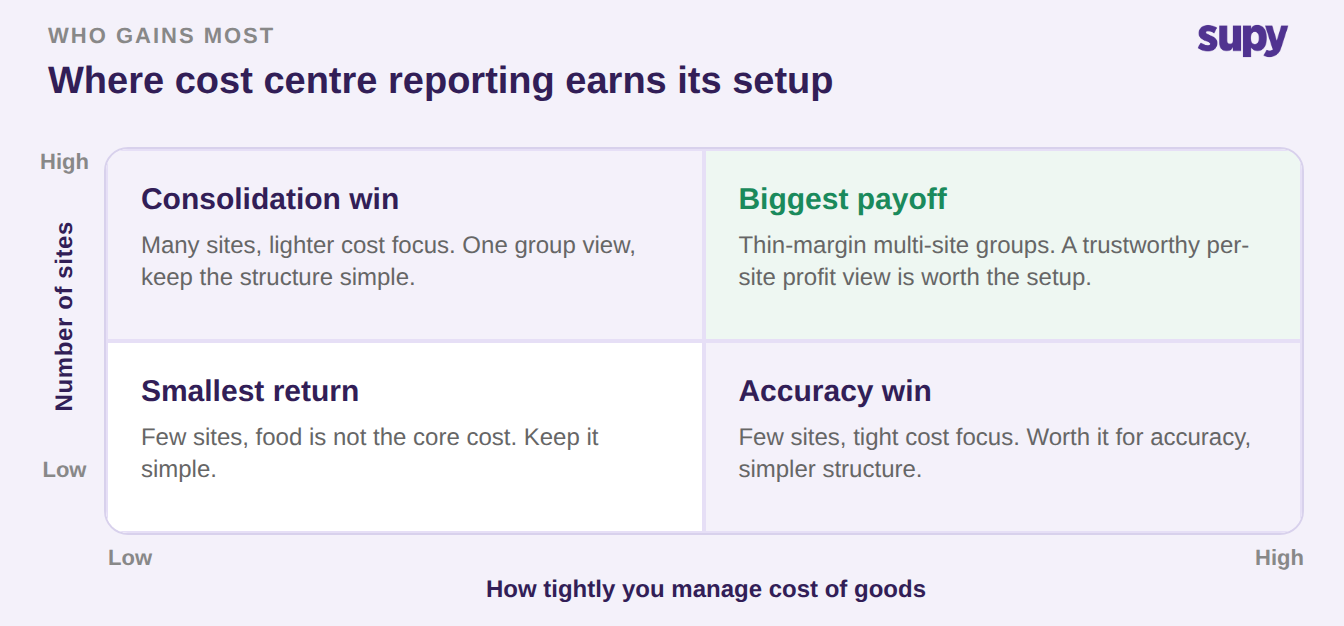
You can go granular where it earns its keep. Recipe cost centres break a dish down by ingredient and location on the web app, and multi-location goods received notes let you reassign a received item to the right cost centre on the spot.
There are limits worth knowing up front. The recipe cost centre breakdown is a web view, and the mobile app shows a summary. Tracking tools or equipment upkeep as a sub-category inside a cost centre is not something the platform does today.
Start With Three Moves
Set your cost centres by site, then by category, and keep the same shape across every location. Link every recipe and item so nothing posts to an uncategorised bucket. Then run the consolidated Cost Overview across all sites for last month and lay it next to your accounting P&L.
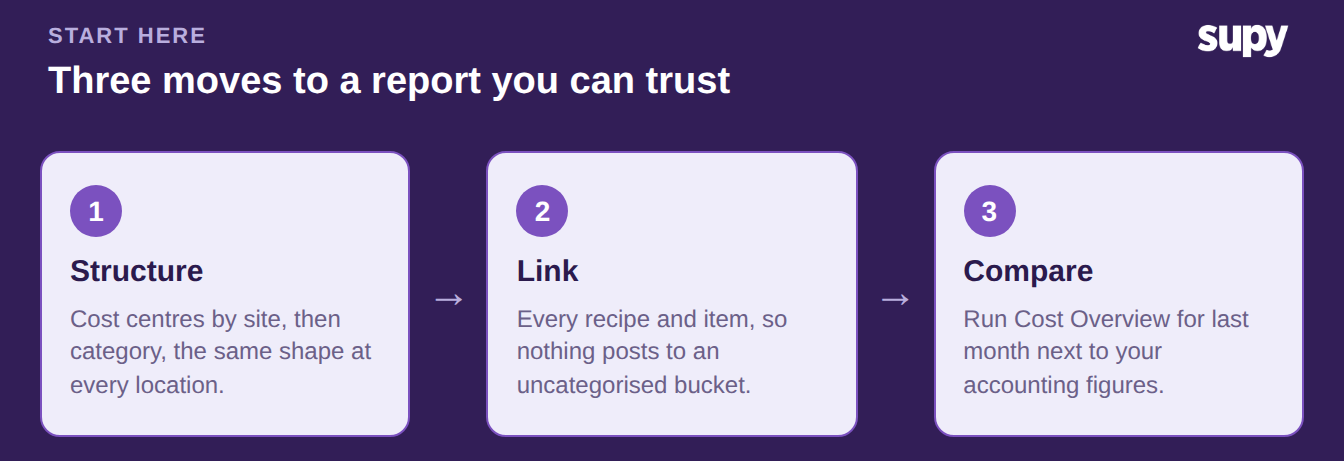
If the two match, your structure is sound and you can trust the per-site cuts. If they do not, the gap is in your setup, not your kitchens, and you now know exactly where to look. Ready to see profit by site and category from one report? Book a demo and bring last month's numbers.