.jpg)


Restaurant Cost of Goods Sold (COGS) in Power BI: Native Reporting or Your Own BI Stack?
Two Places Your Restaurant COGS Data Can Live
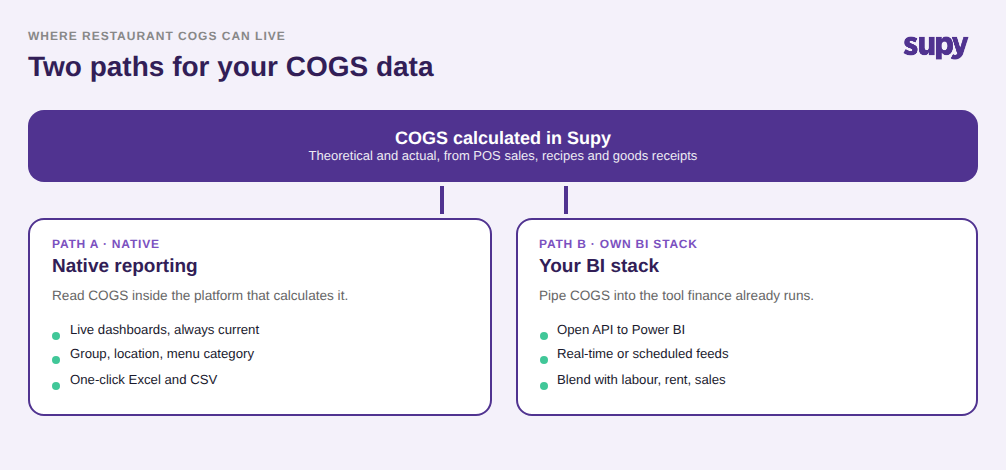
Restaurant cost of goods sold (COGS) can be reported two ways: read it inside the dashboards of the inventory platform that already calculates it, or pipe it into a business intelligence (BI) tool like Power BI that your finance team runs. Native reporting is faster to stand up and always current; a restaurant COGS Power BI integration unifies cost with the rest of your numbers. The right answer depends on who reads it, how fresh it must be, and what else it sits beside.
That decision only exists because COGS is no longer a month-end figure. In a 12-location group across 3 territories, a territory manager wants theoretical and actual food cost side by side every week, not a P&L six weeks later. One multi-territory casual dining group's head of operations described exactly this: before they had inventory software, capturing food cost meant territory managers sifting through theoretical profit-and-loss statements by hand. The pull toward a dashboard is real. The open question is which dashboard.
When Native COGS Reporting Is Enough
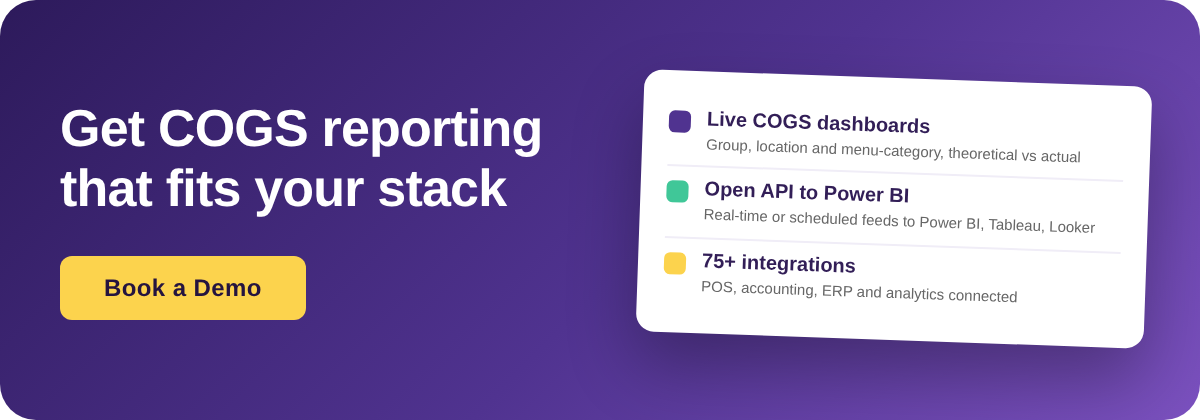
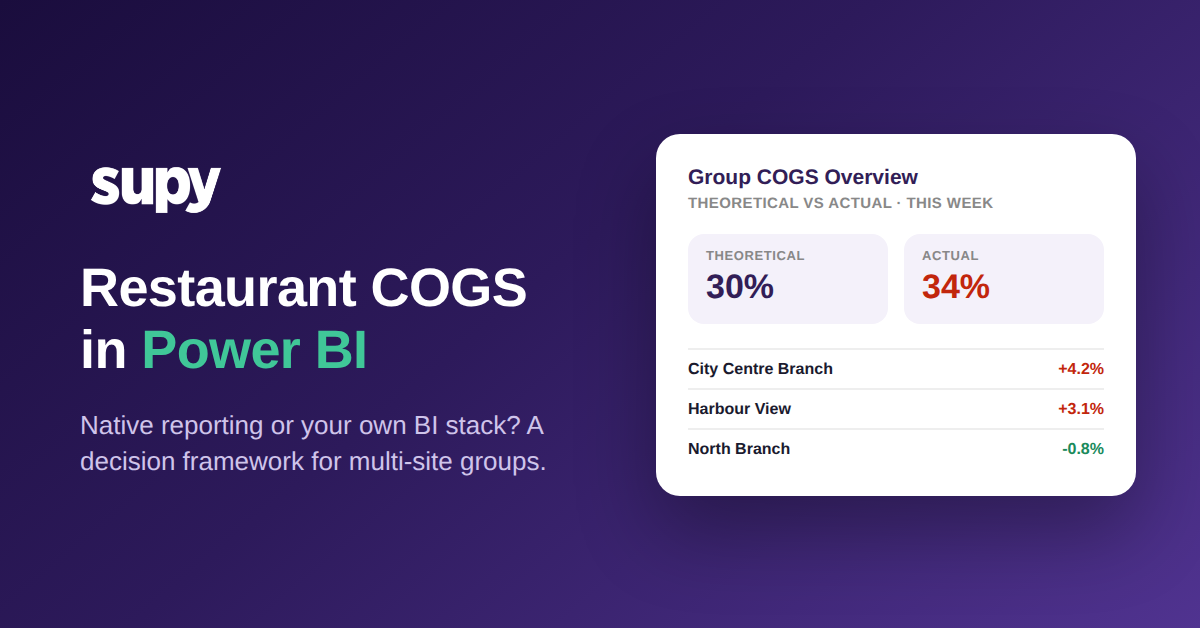
For most operators, the platform that calculates COGS already reports it well enough to skip a separate BI build. Supy's interactive dashboards show live COGS and food-cost percentage at group, location and menu-category level, with theoretical-versus-actual variance and drill-down into the dishes and branches driving the gap. That is the same number a BI tool would show, without the pipeline to build or maintain.
Native reporting wins when the reader is an operator, not an analyst. A general manager checking whether this week's actual food cost of 34% has drifted from a 30% target does not need a data model; they need the 4-point gap in front of them and the ability to click into it. Supy also generates one-click Excel and CSV reports across sales and COGS, menu engineering, and stock movement and variance at group or site level, so the accountant who wants the raw rows gets them in minutes. If your COGS questions are answered inside those views, adding Power BI adds cost and lag for no new insight. For the mechanics of the gap itself, see our guide to theoretical vs actual food cost variance.

When to Pipe COGS Into Your Own BI Stack
A BI stack earns its keep when COGS has to sit beside numbers Supy does not hold. If finance already runs Power BI, Tableau or Looker, and reports blend cost with labour, rent, delivery-platform fees and same-store sales, then COGS is one feed among many and belongs in that model. This is the profile behind the original request: a multi-territory group whose head of operations needed theoretical and actual COGS flowing natively into Power BI for territory-manager financial health checks.
Supy's open API supports exactly this. It exposes documented data across procurement, inventory, production, recipes, wastage, sales and COGS, is data-lake-ready for S3, Azure, Google Cloud Storage, Databricks, Snowflake and BigQuery, and offers native BI connectors for Power BI, Tableau and Looker on a real-time or scheduled basis. It sits alongside 75+ POS, accounting, ERP and analytics integrations, so a group standardised on Microsoft Dynamics 365 as its ERP backbone can exchange COGS and inventory data rather than rekey it. Choose this path when the audience is analysts building blended models, not managers reading a single number. Supy documents this on its open API integrations page.

The Freshness Trade-Off Between the Two
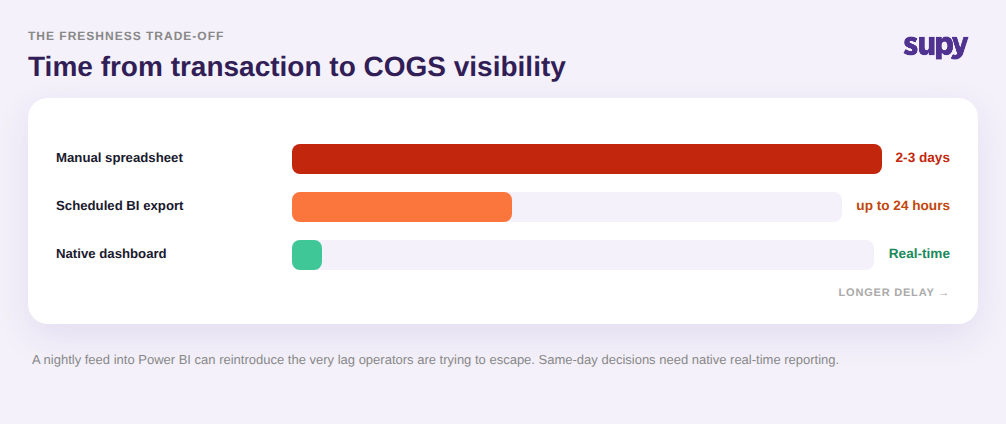
The choice most teams underweight is not features, it is freshness. A native dashboard updates as goods receipts and recipe usage post, so COGS is current when a manager opens it. A scheduled feed into a BI tool is only as fresh as its last run, which is often overnight. One multi-location operator's operations director flagged a 24-hour data lag as making reports unusable for real-time or late-night ordering decisions, and a nightly export can reintroduce exactly that lag on top of a stack you paid to build.
The rule is simple. If the decision is same-day, ordering tonight, catching a variance this shift, native real-time reporting beats a scheduled export. If the decision is periodic, a monthly territory review or a quarterly menu re-engineering, a scheduled refresh into Power BI is fine because the reader is looking backward, not acting now. A restaurant COGS Power BI integration set to refresh nightly is a reporting tool, not an operating one, and pricing that difference in before you build it saves a lot of disappointment later.
How to Choose (and the One Prerequisite Both Share)
Choose native reporting when operators are the audience, decisions are same-day, and COGS questions are answered inside cost, variance and menu-engineering views. Choose your own BI stack when analysts are the audience, COGS must blend with labour, rent and sales in one model, and finance has already standardised on Power BI, Tableau or a data warehouse. Many groups end up doing both: native dashboards for the floor, a scheduled API feed for finance.

Whichever you pick, both paths share one prerequisite, and it is upstream of either dashboard: the COGS feed is only as good as the POS integration underneath it. Operators repeatedly name POS API gaps as their primary blocker, and invoices that import with missing prices quietly understate cost no matter where it is displayed. Before you compare dashboards, confirm your POS and invoice data lands clean and complete. A polished Power BI report built on a broken feed is a confident wrong answer, and that is worse than no report at all. Fix the feed first, then decide where COGS should live.