.jpeg)


تكلفة البضاعة المباعة (COGS) للمطاعم في Power BI: التقارير الأصلية أم حزمة ذكاء الأعمال الخاصة؟
مكانان يمكن أن تتواجد فيهما بيانات COGS الخاصة بمطعمك
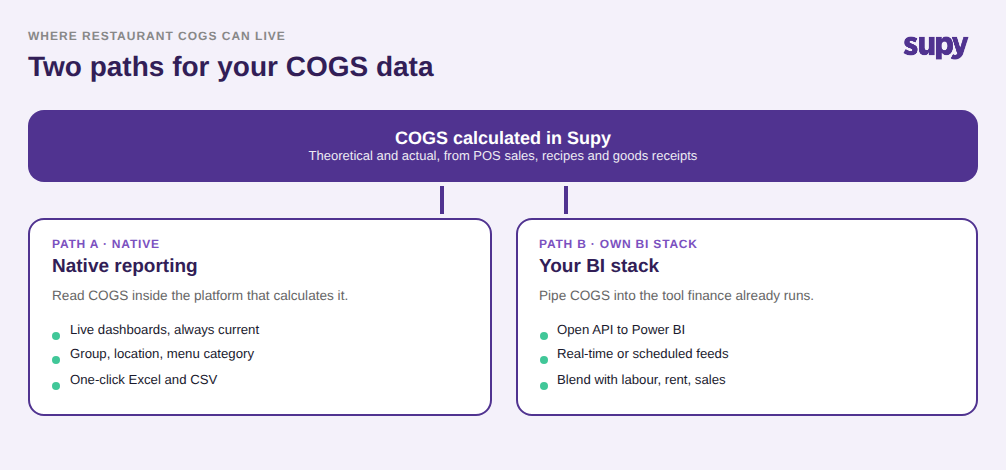
يمكن الإبلاغ عن تكلفة البضاعة المباعة (COGS) للمطاعم بطريقتين: إما قراءتها داخل لوحات المعلومات التابعة لمنصة المخزون التي تحسبها بالفعل، أو إرسالها إلى أداة ذكاء الأعمال (BI) مثل Power BI التي يديرها فريقك المالي. التقارير الأصلية أسرع في الإعداد ودائمًا محدّثة؛ أما تكامل COGS للمطاعم مع Power BI فيوحّد التكاليف مع بقية أرقامك. الإجابة الصحيحة تعتمد على من يقرأ البيانات، ومدى حداثتها المطلوبة، وما الذي تجاوره.
لا يوجد هذا القرار إلا لأن البيانات لم تعد مجرد رقم شهري. في مجموعة من 12 موقعًا تمتد عبر 3 مناطق، يريد مدير المنطقة الاطلاع على تكلفة الغذاء النظرية والفعلية جنبًا إلى جنب كل أسبوع، لا على بيان الأرباح والخسائر بعد ستة أسابيع. وصف رئيس عمليات إحدى مجموعات المطاعم غير الرسمية متعددة المناطق هذا الأمر بالضبط: قبل امتلاكهم برنامج مخزون، كان رصد تكلفة الغذاء يعني اضطرار مديري المناطق إلى تصفح بيانات الأرباح والخسائر النظرية يدويًا. إن الجاذبية نحو لوحة معلومات أمر حقيقي. والسؤال المفتوح: أي لوحة معلومات؟
متى تكون تقارير COGS الأصلية كافية
بالنسبة لمعظم المشغّلين، تُعدّ المنصة التي تحسب COGS كافيةً للتقارير دون الحاجة إلى بناء BI منفصل. تعرض لوحات معلومات تفاعلية من Supy بيانات COGS الحية ونسبة تكلفة الغذاء على مستوى المجموعة والموقع وفئة القائمة، مع التباين بين النظري والفعلي وإمكانية التعمق في الأطباق والفروع التي تقود الفجوة. وهذا هو نفس الرقم الذي ستعرضه أداة BI، دون الحاجة إلى بناء خط تدفق البيانات أو صيانته.
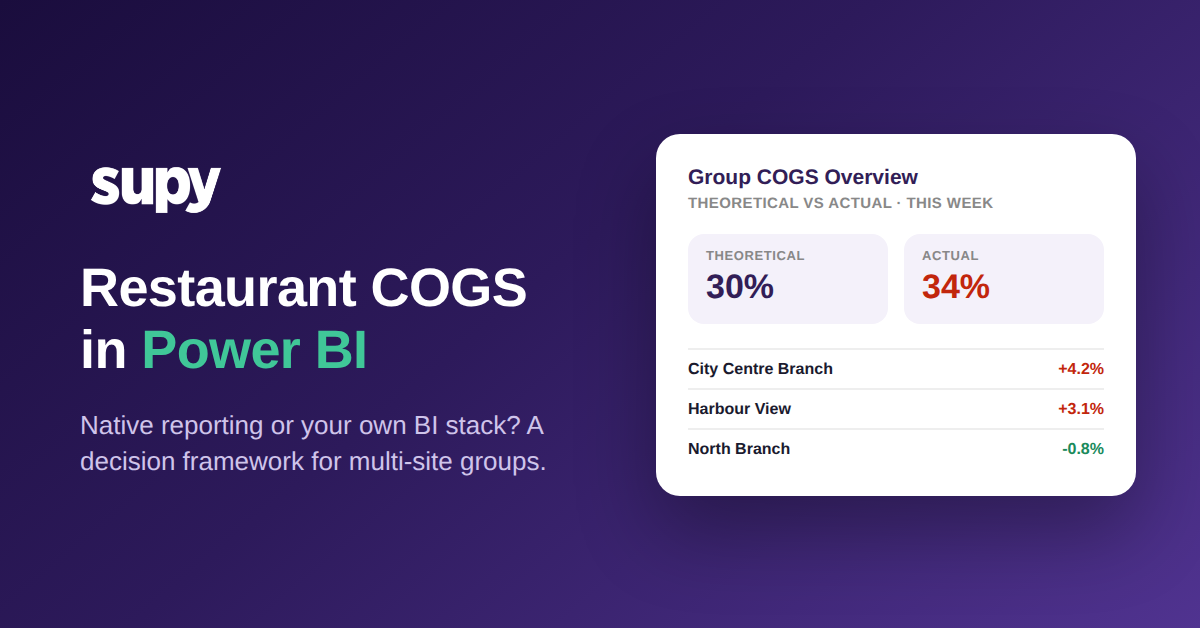
تتفوق التقارير الأصلية حين يكون القارئ مشغّلًا لا محللًا. المدير العام الذي يتحقق مما إذا كانت تكلفة الغذاء الفعلية هذا الأسبوع البالغة 34% قد ابتعدت عن هدف 30% لا يحتاج إلى نموذج بيانات؛ بل يحتاج إلى الفجوة البالغة 4 نقاط أمامه وإمكانية النقر للتعمق فيها. تُولّد Supy أيضًا التقارير بصيغة Excel وCSV بنقرة واحدة تشمل المبيعات وCOGS وهندسة القائمة وحركة المخزون والتباين على مستوى المجموعة أو الموقع، بحيث يحصل المحاسب الذي يريد البيانات الخام عليها في دقائق. إذا كانت هذه الأسئلة تُجاب داخل تلك العروض، فإن إضافة Power BI يضيف تكلفةً وتأخرًا دون أي رؤى جديدة. للاطلاع على آليات الفجوة نفسها، راجع دليلنا حول التباين بين تكلفة الغذاء النظرية والفعلية.

متى تُرسل COGS إلى حزمة ذكاء الأعمال الخاصة بك
تستحق حزمة ذكاء الأعمال جهدها حين يجب أن تجلس COGS جنبًا إلى جنب مع أرقام لا تمتلكها Supy. إذا كان الفريق المالي يشغّل Power BI أو Tableau أو Looker بالفعل، وتمزج التقارير التكلفة مع العمالة والإيجار ورسوم منصات التوصيل والمبيعات المتكافئة، فإن COGS تصبح إحدى تغذيات بيانات متعددة وتنتمي إلى ذلك النموذج. هذا هو النمط الكامن وراء الطلب الأصلي: مجموعة متعددة المناطق كان رئيس عملياتها بحاجة إلى تدفق COGS النظري والفعلي بشكل أصلي إلى Power BI لإجراء فحوصات صحية مالية لمديري المناطق.
تدعم Open API المفتوحة من Supy هذا بالضبط. فهي تكشف بيانات موثّقة تشمل المشتريات والمخزون والإنتاج والوصفات والهدر والمبيعات وCOGS، وهي جاهزة لمستودعات البيانات على S3 وAzure وGoogle Cloud Storage وDatabricks وSnowflake وBigQuery، وتوفر موصّلات ذكاء أعمال أصلية لـ Power BI وTableau وLooker على أساس فوري أو بجدول زمني. وتقع إلى جانب أكثر من 75 من التكاملات مع أنظمة نقاط البيع والمحاسبة وتخطيط موارد المؤسسات والتحليلات، بحيث يمكن لمجموعة عيّارت على Microsoft Dynamics 365 كعمود فقري لتخطيط موارد المؤسسات تبادل بيانات COGS والمخزون بدلًا من إعادة إدخالها. اختر هذا المسار حين يكون الجمهور محللين يبنون نماذج مدمجة، لا مديرين يقرؤون رقمًا واحدًا. توثّق Supy ذلك في صفحة تكاملات Open API.

المفاضلة في الحداثة بين الخيارين
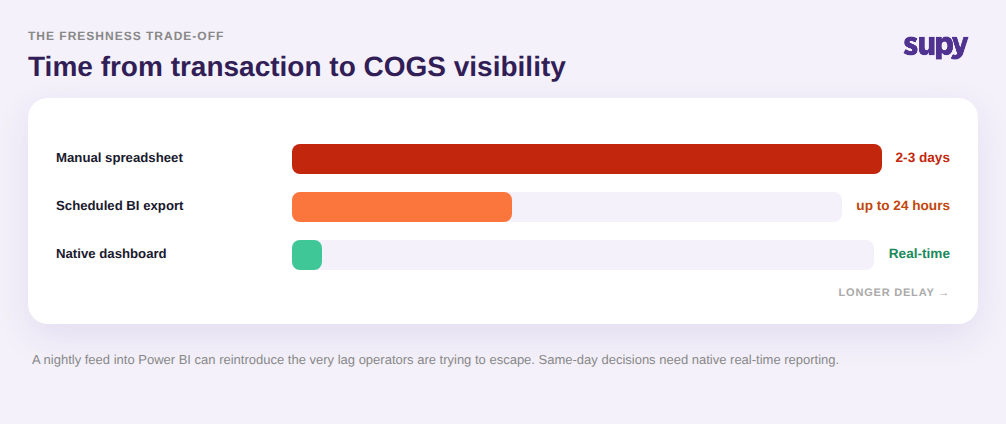
الاختيار الذي تُقلّل معظم الفرق من أهميته ليس الميزات، بل الحداثة. تُحدَّث لوحة المعلومات الأصلية مع ورود إيصالات البضائع واستخدام الوصفات، لذا فإن COGS محدّثة حين يفتحها المدير. أما التغذية المجدولة إلى أداة ذكاء الأعمال فهي محدّثة بقدر آخر تشغيل لها فحسب، وهو في الغالب بين عشية وضحاها. أشار مدير العمليات لأحد المشغّلين متعددي المواقع إلى أن تأخر البيانات 24 ساعة يجعل التقارير غير صالحة للقرارات الفورية أو قرارات الطلب في وقت متأخر من الليل، وأن تصدير الليل قد يُعيد تمامًا ذلك التأخر فوق بنية دفعتَ مقابل بنائها.
القاعدة بسيطة. إذا كان القرار في نفس اليوم — الطلب الليلة، أو رصد التباين في هذه النوبة — فإن التقارير الأصلية الفورية تتفوق على التصدير المجدول. أما إذا كان القرار دوريًا — مراجعة شهرية لمنطقة أو إعادة هندسة قائمة فصلية — فإن التحديث المجدول إلى Power BI مقبول تمامًا لأن القارئ ينظر إلى الماضي لا يتصرف الآن. إن تكامل COGS للمطاعم مع Power BI المُعيَّن للتحديث ليلًا هو أداة تقارير لا أداة تشغيل، والتسعير لهذا الفارق قبل البناء يوفّر الكثير من خيبات الأمل لاحقًا.
كيف تختار (والمتطلب الأساسي المشترك بين الخيارين)
اختر التقارير الأصلية حين يكون المشغّلون هم الجمهور، والقرارات في نفس اليوم، وتُجاب تلك الأسئلة داخل عروض التكلفة والتباين وهندسة القائمة. اختر حزمة ذكاء الأعمال الخاصة حين يكون المحللون هم الجمهور، وتحتاج COGS إلى الاندماج مع العمالة والإيجار والمبيعات في نموذج واحد، وقد عيّار الفريق المالي بالفعل على Power BI أو Tableau أو مستودع بيانات. تنتهي كثير من المجموعات إلى فعل الأمرين معًا: لوحات معلومات أصلية للطابق، وتغذية API مجدولة للفريق المالي.

أيًّا كان خيارك، يتشارك المساران في متطلب أساسي واحد يقع في مصب كلا المسارين: تغذية COGS لا تكون أفضل من تكامل نقاط البيع تحتها. يُسمّي المشغّلون مرارًا ثغرات API لنقاط البيع باعتبارها عقبتهم الرئيسية، والفواتير التي تُستورد بأسعار مفقودة تُقلّل التكلفة بهدوء بصرف النظر عن مكان عرضها. قبل مقارنة لوحات المعلومات، تأكد من أن بيانات نقاط البيع والفواتير الخاصة بك تصل نظيفةً وكاملة. تقرير Power BI المصقول المبني على تغذية معطوبة هو إجابة خاطئة واثقة، وهذا أسوأ من عدم وجود تقرير على الإطلاق. أصلح التغذية أولًا، ثم قرر أين يجب أن تكون COGS.