.jpeg)


Lieferantenbewertung im Restaurant: Ein Scorecard-Rahmen für Filialgruppen bei der Lieferantenauswahl
Was eine Lieferanten-Scorecard misst – und was Bauchgefühl nicht kann
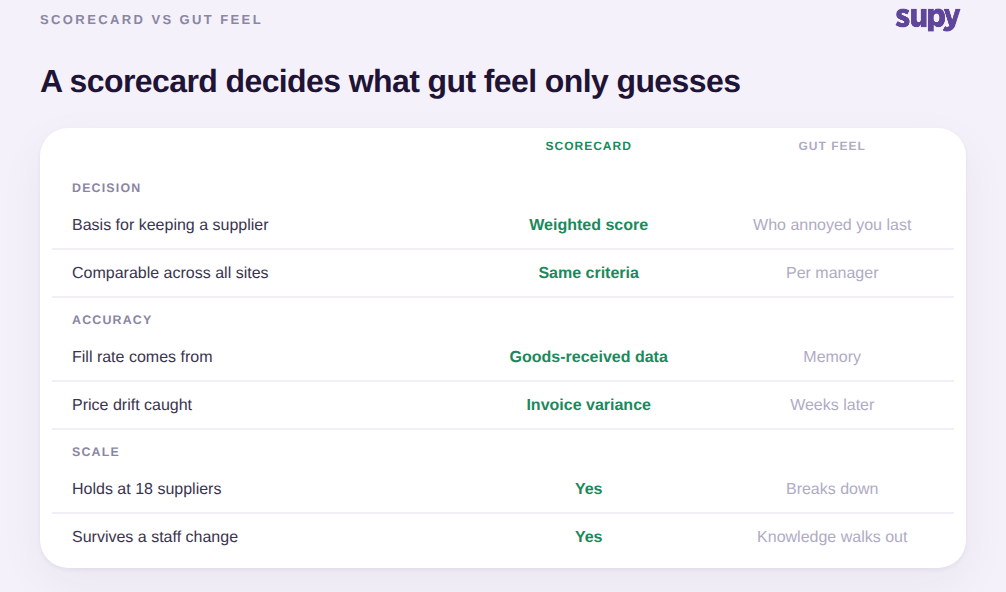
Eine Lieferanten-Scorecard für Restaurants bewertet jeden Lieferanten nach denselben festen Kriterien und führt diese Bewertungen zu einer einzigen Entscheidung zusammen: als Hauptlieferant behalten, als Reserve führen oder streichen. Statt auf die Erinnerung einer Führungskraft daran, welcher Lieferant letzten Monat die Küche geärgert hat, trägt jeder Lieferant eine vergleichbare Kennzahl, die jeder Standort einsehen und jeder Einkäufer vertreten kann.
An einem einzelnen Standort ist Bauchgefühl verkraftbar. Der Küchenchef weiß, welcher Gemüselieferant freitags zu wenig liefert, und bestellt still und leise etwas mehr. Bei einer Gruppe mit 18 aktiven Lieferanten, die 12 Standorte beliefern und einem jährlichen Einkaufsvolumen von rund 2,4 Mio. Dollar, lässt sich dieses Wissen nicht skalieren. Eine Filiale hält an einem Lieferanten fest, den die Gruppe längst hätte streichen sollen; eine andere trennt sich von einem Lieferanten, der anderswo gut abschneidet. Niemand vergleicht dieselben Dinge, sodass letztlich niemand wirklich entscheidet – man reagiert nur.
Eine praxistaugliche Scorecard legt sechs Kriterien fest und gewichtet sie danach, was tatsächlich Geld kostet. Eine Mustergewichtung: Liefererfüllungsquote und Bestellgenauigkeit je 25 %, Lieferzuverlässigkeit 20 %, Preisstabilität 20 %, Qualität und Retouren 15 %, Vorlaufzeit 10 % sowie Kommunikation und Dokumentation 10 %. Die genauen Gewichtungen legen Sie selbst fest, aber zwei Regeln gelten immer: Preis ist nie die einzige Achse, und die Kriterien bleiben für jeden Lieferanten identisch, damit die Bewertungen dasselbe bedeuten.
Das Unbehagliche daran ist, dass manche Lieferanten auf dem Papier gar nicht bewertet werden können. Bei der Hälfte des Einkaufsvolumens läuft es häufig über informelle Anbieter ohne Rechnungen und Bestellungen per Messenger, und eine Scorecard muss diese anerkennen, anstatt so zu tun, als existierten sie nicht. Der Rahmen soll keine perfekte Zahl liefern, sondern eine konsistente – damit eine Entscheidung für oder gegen einen Lieferanten auch einen Führungswechsel, einen neuen Standort und ein schwieriges Quartal übersteht. Wie Filialgruppen dieses System einbetten, zeigt der Überblick über Restaurant-Lieferantenverwaltung von Anfang bis Ende.
Wenn ein Lieferant preislich gut aussieht, aber bei der Liefertreue versagt
Die Liefererfüllungsquote ist der Anteil des Bestellten, der vollständig und zum versprochenen Liefertermin ankam. Sie ist das Kriterium, das Preislisten nie ausweisen, und meistens das, das im Verborgenen am meisten kostet. Die Back-of-House einer Filialgruppe musste eine Gutschrift für einen Artikel ausstellen, den ein Lieferant schlicht nie geliefert hatte – der Fehlbestand tauchte erst Tage später auf, als jemand die Unterlagen abglich, nicht an der Tür, als der Menüpunkt bereits ausverkauft war.
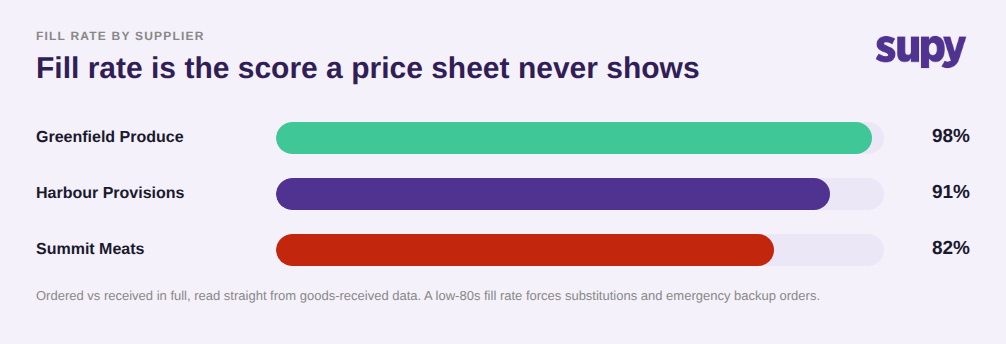
Im Portfolio-Vergleich sind die Unterschiede eindeutig. Ein starker Hauptlieferant erreicht 98 % Liefererfüllungsquote bei 2 Tagen Vorlaufzeit. Ein mittelmäßiger liegt bei 91 %. Ein schwacher kommt auf 82 % bei 5 Tagen Vorlaufzeit und benötigt bei 6 % seiner Lieferungen eine Gutschrift. Auf dem zitierten Preisblatt wirken alle drei vergleichbar, aber der 82-%-Lieferant erzwingt Last-Minute-Ersatz, Notbestellungen beim Reservelieferanten und Stunden an Mitarbeiterstunden für die Einholung von Gutschriften.
Deshalb tragen Liefererfüllungsquote und Lieferzuverlässigkeit die zwei höchsten Gewichtungen in der Muster-Scorecard. Um sie ohne Klemmbrett zu erheben, liest man sie direkt aus den Wareneingangsdaten: was in der Bestellung stand, verglichen mit dem, was auf dem Lieferschein abgezeichnet wurde – und wie oft beides abweicht. Die Retouren- und Gutschrifts-Historie eines Lieferanten ist dasselbe Signal von der anderen Seite, weshalb die konsequente Erfassung von Wareneingangsdifferenzen die Liefererfüllungsquote verlässlich statt anekdotisch macht.
Wenn ein günstigerer Listenpreis schleichende Kosten verbirgt
Preis gehört in die Scorecard – aber die entscheidende Zahl ist Preisstabilität, nicht der Listenpreis am Tag der Vertragsunterzeichnung. Eine Filialgruppe stellte fest, dass unbemerkte Preiserhöhungen von Lieferanten wochenlang durch papierbasierte Wareneingangsprozesse geschlüpft waren, weil kein automatischer Abgleich zwischen Bestellung und Rechnung diese Abweichung auffing. Der Lieferant wirkte auf dem ursprünglichen Angebot noch günstig, während er Rechnung für Rechnung still und leise nachjustierte.
Die Rechnung ist bei diesem Volumen gnadenlos. Ein Lieferant mit einem jährlichen Einkaufsvolumen von 600.000 Dollar und einer unbemerkten Preisdrift von 4 %, die niemand meldet, kostet die Gruppe 24.000 Dollar pro Jahr – genug, um jeden Preisnachlass, der ihm den Auftrag eingebracht hat, mehr als aufzuwiegen. Eine Scorecard, die nur den zitierten Preis erfasst, belohnt genau den falschen Lieferanten: den, der niedrig bietet und es per Rechnung zurückholt.
Der Bewertungsinput für Preisstabilität ist die Abweichung zwischen Rechnung und Bestellung: wie oft und in welchem Ausmaß der berechnete Preis vom vereinbarten abweicht. Bei zeilengenauem Wareneingang zeigt ein schleichender Lieferant ein Muster kleiner Überschreitungen statt eines offensichtlichen Ausreißers – genau das ermöglichte die wochenlange Drift. Die vertiefte Methode beschreibt, wie Gruppen Lieferantenpreise standortübergreifend vergleichen, sodass ein Anstieg in einer Filiale sofort gegen denselben Artikel überall sichtbar ist.

Hauptlieferant, Reserve oder Streichen: Bewertungen in Entscheidungen umwandeln
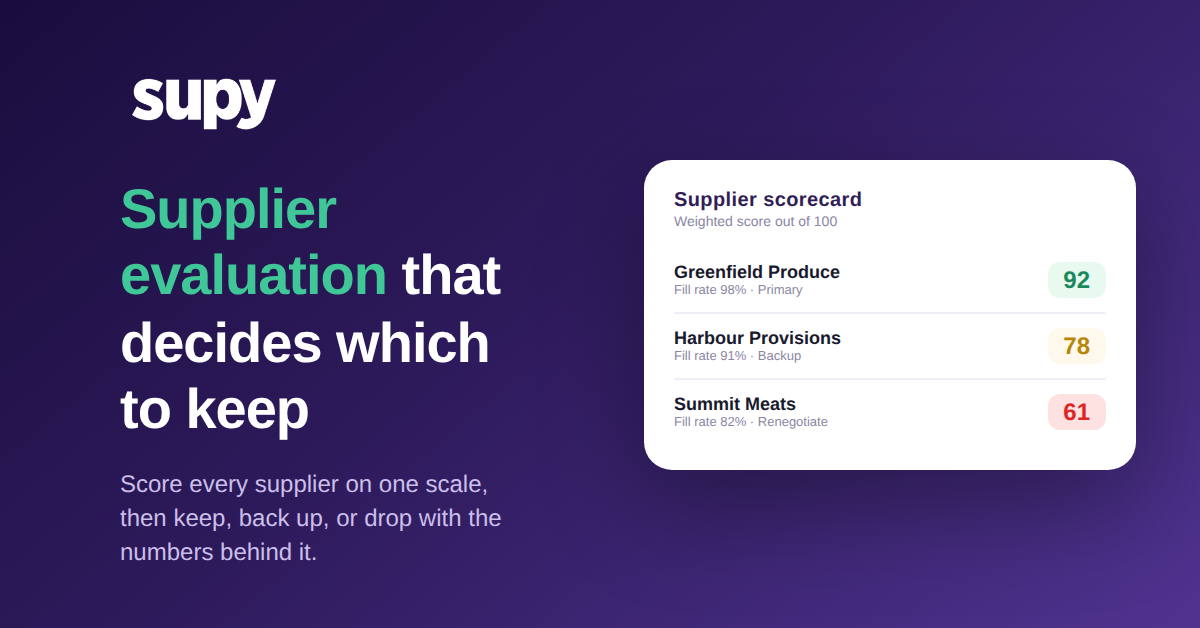
Die Scorecard zahlt sich erst aus, wenn die Gesamtpunktzahl einer Maßnahme entspricht. Eine einfache Regel: 80 oder mehr von 100 Punkten – der Lieferant bleibt Hauptlieferant; 65 bis 79 Punkte – er wird als Reserve geführt, nicht als erste Wahl; unter 65 Punkten nachverhandeln Sie anhand der konkreten Kriterien, die ihn drücken, oder Sie streichen ihn. Im laufenden Beispiel erreicht Greenfield Produce 92 Punkte und bleibt Hauptlieferant, Harbour Provisions kommt auf 78 und wird dokumentierter Reservelieferant, Summit Meats auf 61 – was eine Nachverhandlung zur Liefererfüllungsquote auslöst, bevor alles andere.
Diese Unterscheidung ist nicht kosmetisch. Eine Finanzverantwortliche einer Gruppe stellte fest, dass nicht klassifizierte Reservelieferanten im Produktstamm die Rezeptkosten in die Höhe trieben, weil die Durchschnittskosten-Logik den Preis eines selten genutzten Reservelieferanten in jeden Teller einrechnete. Einen klaren Hauptlieferanten gegenüber einem Reservelieferanten je Zutat auszuweisen hält die Kalkulation präzise und macht das Ergebnis der Scorecard real statt zu einem abgehefteten Dokument. Informelle Anbieter werden nach dem bewertet, was sichtbar ist – Preis und erinnerte Zuverlässigkeit –, als Reserven geführt, wo sie das wirklich verdienen, und schrittweise in dokumentierte Bestellprozesse überführt, damit sie nächstes Quartal ordentlich bewertet werden können.
All das erfordert keine separate Tracking-Tabelle, weil die Bewertungen aus Daten stammen, die der Bestellprozess ohnehin erfasst. Supy führt standortspezifische Lieferpläne und Bestellschlüsse und richtet Bestellungen danach aus, sodass verspätete und planabweichende Lieferungen messbar statt erinnerungsabhängig sind. Der Rechnungseingang markiert Preis- und Mengenabweichungen gegenüber der Bestellung und speist damit die Preisstabilitäts- und Liefererfüllungsquoten direkt; Gutschriften und Retouren werden mit Prüfpfad erfasst, bis zu 5 Freigabestufen liegen über Ausgaben, und 75+ Integrationen binden die Kassen- und Katalogdaten darunter ein. Wie die Teile zusammenpassen, zeigt die Übersicht auf der Supy-Plattform.

Die Entscheidungsregel, klar formuliert: Lieferanten als Hauptlieferanten führen, die rund 80 Punkte in der gewichteten Bewertung erzielen und die Liefererfüllungsquote stabil im oberen 90er-Bereich oder höher halten; als Reserve führen, wenn sie in der Spanne 65 bis 79 landen – nützlich, aber nicht die erste Wahl; unter 65 nachverhandeln oder streichen, indem man zuerst das einzelne Kriterium anspricht, das die Punktzahl nach unten zieht, statt eine vage Beschwerde vorzutragen. Im festen Rhythmus neu bewerten – quartalsweise reicht für die meisten Gruppen –, damit ein Lieferant, der abgeglitten ist, durch die Zahl auffällt, bevor er durch einen Lieferengpass am Freitagabend auffällt.