.jpeg)


تقييم مورّد المطعم: إطار بطاقة الأداء للمجموعات متعددة المواقع
ما تقيسه بطاقة أداء المورّد مما لا تستطيع الحدسية قياسه
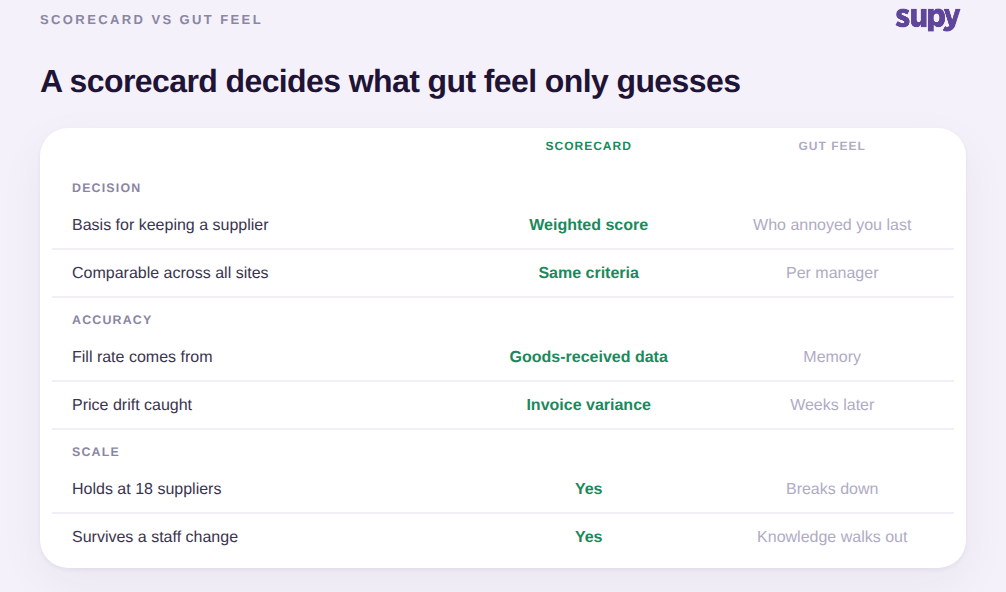
تُقيّم بطاقة تقييم الموردين في المطاعم كل مورّد وفق معايير ثابتة متطابقة، ثم تُحوّل هذه الدرجات إلى قرار واحد: الاحتفاظ به مورّداً رئيسياً، أو الاحتفاظ به احتياطياً، أو الاستغناء عنه. بدلاً من الاعتماد على ذاكرة المدير فيمن أزعج المطبخ الشهر الماضي، يحمل كل مورّد رقماً موحداً قابلاً للمقارنة يستطيع كل موقع الاطلاع عليه ويستطيع كل مشترٍ الدفاع عنه.
في موقع واحد، تظل الحدسية ممكنة. يعرف رئيس الطهاة أي مورّد خضروات يُقلّص الكميات يوم الجمعة فيطلب سراً كمية إضافية. أما في مجموعة تضم 18 مورّداً نشطاً يخدمون 12 موقعاً وما يقارب 2.4 مليون دولار من المشتريات السنوية، فهذه المعرفة لا تتسع. فرع يحتفظ بمورّد كان ينبغي للمجموعة الاستغناء عنه، وآخر يستغني عن مورّد يُحقق أداءً ممتازاً في كل مكان آخر. لا أحد يقارن الأشياء ذاتها، فلا أحد يتخذ قراراً حقيقياً بل يتفاعل فقط.
تُثبّت بطاقة الأداء العملية ستة معايير وتوزن كلاً منها بحسب ما يُكلّف فعلاً. مثال على التوزيع: معدل التسليم ودقة الطلبات بنسبة 25%، وموثوقية التوصيل بنسبة 20%، واستقرار الأسعار بنسبة 20%، والجودة والمردودات بنسبة 15%، ومهل التوريد بنسبة 10%، والتواصل والتوثيق بنسبة 10%. الأوزان الدقيقة تعود إليك، لكن قاعدتين راسختان: السعر لا يكون المعيار الوحيد أبداً، وتبقى المعايير متطابقة لكل مورّد كي تعني الدرجات الشيء ذاته.
الجانب غير المريح هو أن بعض الموردين لا يمكن تقييمهم على الورق أصلاً. فمن الشائع أن ينتقل نصف حجم المشتريات عبر موردين غير رسميين بلا فواتير وطلبات عبر تطبيقات المراسلة، وعلى بطاقة الأداء الاعتراف بهم لا التظاهر بعدم وجودهم. الهدف من الإطار ليس رقماً مثالياً بل رقم متسق، يجعل قرار الاحتفاظ بالمورّد أو الاستغناء عنه يصمد أمام تغيير المدير وموقع جديد وربع عسير. للنظام الأشمل الذي يندرج فيه هذا، انظر كيف يبني مشغلو المواقع المتعددة عملية إدارة المُوردين في المطاعم من البداية إلى النهاية.
حين يبدو المورّد جيداً في السعر لكنه يخفق في معدل التسليم
معدل التسليم هو نسبة ما طلبته فوصل كاملاً في موعد التسليم المحدد. إنه المعيار الذي لا تُظهره قوائم الأسعار أبداً، وهو عادةً الأكثر تكلفةً بصمت. اضطر فريق العمليات الخلفية لإحدى المجموعات متعددة المواقع إلى إصدار إشعار ائتمان لصنف لم يُسلّمه المورّد قط، ولم يتضح النقص إلا بعد أيام حين طابق أحدهم الوثائق، لا عند الباب حين كان طبق القائمة قد نفد أصلاً.
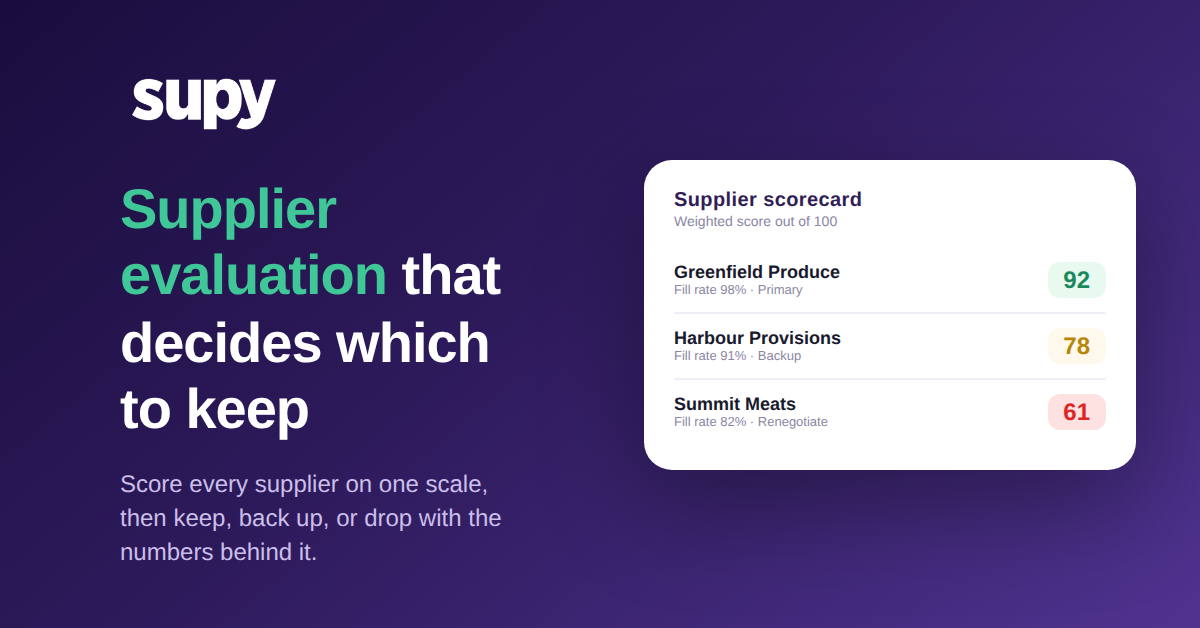
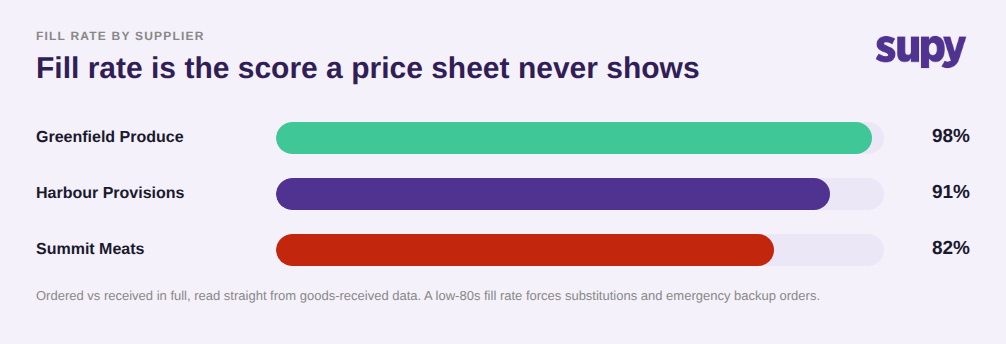
عند قياسها عبر المحفظة، تكون الفوارق صارخة. مورّد رئيسي قوي يُحقق معدل تسليم 98% بمهلة توريد 2 يوم. مورّد متوسط يقف عند 91%. مورّد ضعيف يسجّل 82% بمهلة توريد 5 أيام ويحتاج إلى إشعار ائتمان على 6% من تسليماته. على قائمة الأسعار المعروضة، يبدو الثلاثة متشابهين، لكن مورّد الـ82% يفرض إحلالات اللحظة الأخيرة وطلبات طوارئ من موردٍ بديل وساعات من وقت الموظفين للحاق بإشعارات الائتمان المستحقة.
لهذا السبب يحمل معدل التسليم وموثوقية التوصيل أعلى وزنَين في النموذج النمطي لبطاقة الأداء. لتقييمهما دون حاجة إلى قائمة ورقية، اقرأهما مباشرةً من بيانات استلام البضائع: ما طُلب في طلب الشراء مقارنةً بما وُقّع عليه عند التسليم، وعدد مرات تباين الاثنين. سجل المردودات وإشعارات الائتمان لدى المورّد هو الإشارة ذاتها من الجانب الآخر، ولهذا يجعل تتبع تباينات الاستلام بانتظام درجةَ معدل التسليم موثوقةً لا مجرد قصص متناقلة.
حين يُخفي سعر إعلاني أرخص تسرّباً صامتاً في التكاليف
للسعر مكانه في بطاقة الأداء، لكن الرقم الأهم هو استقرار السعر لا السعر الإعلاني يوم التوقيع. اكتشفت إحدى المجموعات متعددة المواقع أن زيادات أسعار غير ملحوظة كانت تتسلل لأسابيع عبر عمليات استلام بضائع ورقية دون أي تحقق آلي بين طلب الشراء والفاتورة لرصد هذا الانجراف. ظل المورّد يبدو رخيصاً على العرض الأصلي بينما يُعيد كتابته صامتاً فاتورةً بفاتورة.
الحساب قاسٍ عند هذا الحجم. مورّد يُمثّل 600,000 دولار من المشتريات السنوية مع انجراف أسعار بنسبة 4% لا يُشير إليها أحد يُكلّف المجموعة 24,000 دولار سنوياً، يكفي لإلغاء الخصم الذي أهّله للحصول على العقد. بطاقة الأداء التي تسجّل السعر المعروض فحسب تُكافئ المورّد الخاطئ تماماً: من يُقدّم عرضاً منخفضاً ويسترده عبر الفاتورة.
مؤشر استقرار الأسعار هو التباين بين الفاتورة وطلب الشراء: كم مرة وبكم يحيد السعر المُفاتَر عن السعر المتفق عليه. عند قراءته سطراً بسطر على طلب الشراء، يظهر المورّد المنجرف في نمط من التجاوزات الصغيرة لا في قفزة واضحة واحدة، وهو بالضبط ما أتاح للانجراف الاستمرار لأسابيع. للمنهجية الأعمق، انظر كيف تُقارن المجموعات أسعار الموردين بين المواقع ليظهر أي ارتفاع في فرع ما أمام البند ذاته في كل مكان آخر.

رئيسي أم احتياطي أم إسقاط: تحويل الدرجات إلى قرار
لا تُثبت بطاقة الأداء قيمتها إلا حين يرتبط الدرجة الإجمالية بإجراء محدد. قاعدة بسيطة تُجدي: درجة 80 أو أعلى من 100 يبقى المورّد رئيسياً؛ من 65 إلى 79 يُحفظ احتياطياً لا خياراً أول؛ وما دون 65 إما تُعيد التفاوض على المعايير المحددة التي تُخفض درجته أو تستغني عنه. في النموذج التطبيقي، تحصل Greenfield Produce على 92 وتبقى رئيسياً، وHarbour Provisions على 78 وتصبح موردّاً احتياطياً موثقاً، وSummit Meats على 61 مما يستدعي إعادة التفاوض على معدل التسليم أولاً.
هذا التمييز ليس شكلياً. رصد مسؤول مالي في إحدى المجموعات أن ترك الموردين الاحتياطيين دون تصنيف في قاعدة بيانات المنتجات يُضخّم تكاليف الوصفات، إذ تمزج منطق متوسط التكلفة سعر مورّد احتياطي نادر الاستخدام في كل طبق. تحديد مورّد رئيسي واضح مقابل مورّد احتياطي لكل مكوّن هو ما يُبقي التكلفة دقيقة ويجعل مخرج بطاقة الأداء حقيقياً لا مجرد وثيقة مُودَعة. يُقيَّم الموردون غير الرسميين على ما يمكن رؤيته من سعر وموثوقية محفوظة في الذاكرة، ويُحفظون احتياطيين حيث يستحقون ذلك فعلاً، ويُدفعون تدريجياً نحو طلبات موثقة ليُقيَّموا بشكل سليم في الربع التالي.
لا يحتاج أي من هذا إلى جدول بيانات تتبع منفصل، لأن الدرجات تأتي من بيانات تلتقطها عملية الطلب أصلاً. يُدير Supy جداول التوصيل ومواعيد القطع لكل فرع ويُوافق طلبات الشراء وفقاً لذلك، فتصبح التسليمات المتأخرة وخارج الجدول قابلة للقياس لا مجرد ذكريات. يُنبّه استلام الفواتير إلى تعارضات الأسعار والكميات مقارنةً بطلب الشراء مما يُغذّي درجات استقرار الأسعار ومعدل التسليم مباشرةً، وتُتابع إشعارات الائتمان والمردودات بمسار تدقيق، وتُشرف على الإنفاق ما يصل إلى 5 مستويات الموافقة، وتربط التكاملات البالغة 75+ بيانات نقاط البيع والكتالوج من تحت. يمكنك رؤية كيف تتلاءم القطع في نظرة عامة على منصة Supy.

قاعدة القرار موضحة بصراحة: احتفظ بالمورّد رئيسياً حين يتجاوز نحو 80 في الدرجة الموزونة ويحافظ على معدل تسليم في 90 أو أعلى؛ احتفظ به احتياطياً إن وقع بين 65 و79، مفيد لكنه ليس الخيار الأول؛ وأعد التفاوض أو استغنِ عنه دون 65، مبتدئاً بالمعيار الواحد الذي يُخفّض الدرجة لا بشكوى مبهمة. أعد التقييم وفق جدول ثابت، ربع سنوي يكفي لمعظم المجموعات، لتُرصد زلة المورّد بالرقم قبل أن تُرصد في نفاد مخزون ليلة جمعة.