.jpg)


Restaurant Performance Benchmarking Across Locations: What to Compare
Performance Benchmarking Starts With the Right KPIs
Restaurant performance benchmarking across locations means judging each site against the same set of measures, rather than reading one blended group number. The useful comparison is not revenue alone. It is the operating KPIs a site actually controls: food cost percentage, theoretical-versus-actual variance, wastage percentage, prime cost percentage and sales per labour hour.
Pick a short list and hold every site to it. More metrics do not make a benchmark sharper; a handful of controllable ones, measured the same way everywhere, does. The table below is a practical starting set, with what each KPI tells you across sites and the one thing you must normalise before the comparison is fair.
| KPI | What it tells you across sites | How to normalise it |
|---|---|---|
| Food cost % | Which sites turn sales into margin most efficiently | Same stock-count dates; per-location recipe costs |
| Theoretical vs actual variance | Where stock is leaking beyond what recipes predict | Compare on identical count periods |
| Wastage % | Which sites waste most, and by which reason | Log per outlet, never co-mingled |
| Prime cost % | Combined COGS and labour discipline per site | Per-location labour and cost data |
| Sales per labour hour | How productively each site converts labour into sales | Same daypart and shift definitions |
Why a Blended Group Average Hides a Weak Location
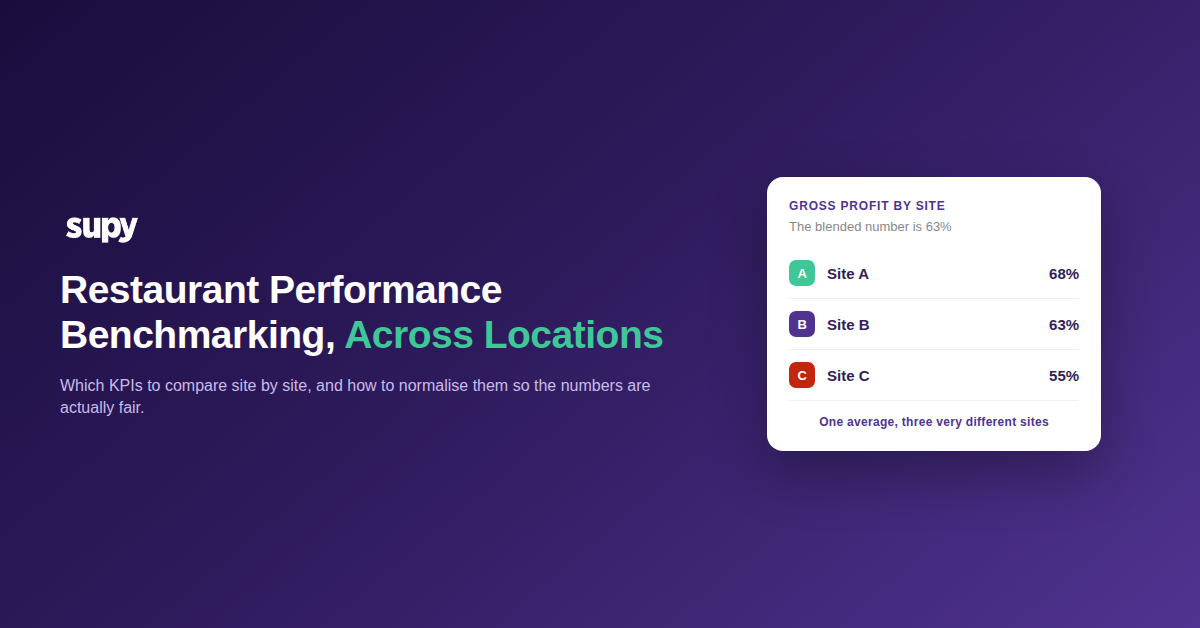
A single group number is comforting and misleading. It averages a strong site and a weak one, so a location running under target disappears into the middle. The larger the group, the more cover the average gives a site that is slipping.
One multi-site group ran a steady 63% gross profit margin for months. A quarterly deep-dive found two sites down at 55 to 57%, held up by stronger locations. The cause was simple: those sites bought at higher prices that the recipe cost model never captured, so their real margin was invisible in the blend. Per-site benchmarking is what surfaces that gap in week one instead of quarter three.

Normalise Each KPI Before You Compare Locations
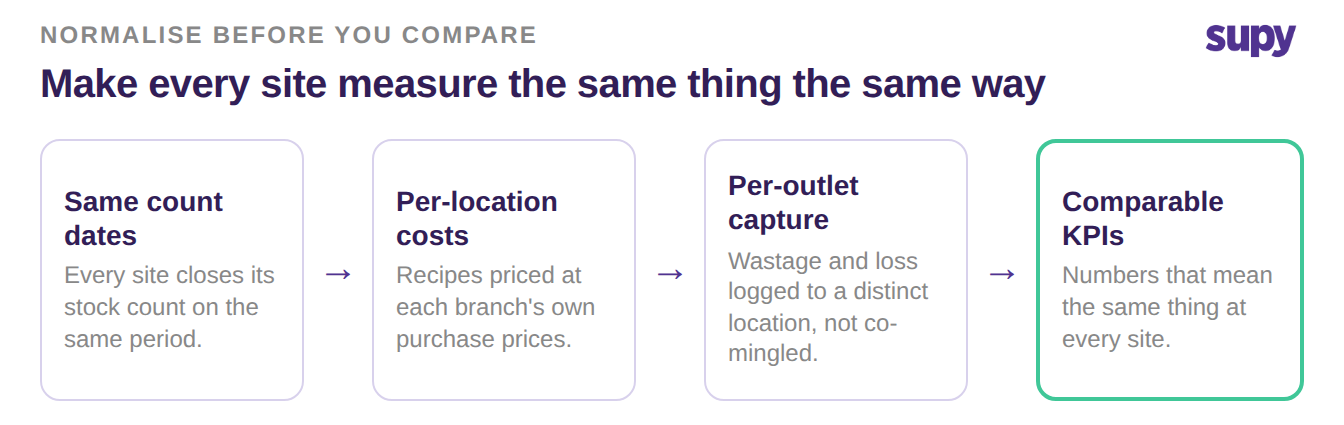
Two sites can report the same KPI and still not be comparable. If one counted stock at month-end and the other mid-month, the numbers cover different windows. If one prices recipes at group-average cost while the other uses its own supplier prices, they measure different things. Normalising is the step most benchmarking skips, and it is what makes a comparison trustworthy rather than just tidy.
Three things have to line up. Every site closes its stock count on the same period, so food cost and variance cover the same window. Recipes are priced at each branch's own purchase prices, so a site is not flattered or punished by a group average. And wastage and loss are logged to a distinct outlet, not co-mingled, so you can attribute a shortage to the site it came from.
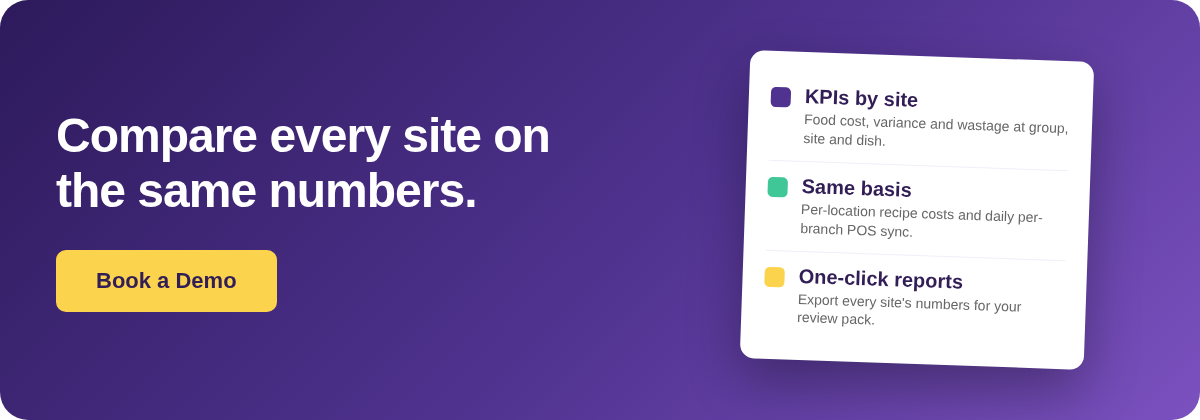
Getting these inputs right per site is where a platform earns its place. Supy's analytics dashboards show food cost percentage, theoretical-versus-actual variance and wastage at group, site and menu-category level. Its per-branch recipe costing and daily per-site POS sync keep each location on the same, current basis. One-click reports then export every site's figures so a review pack compares like with like. Supy supplies the per-site data and the comparison; you decide which KPIs to benchmark and what good looks like.
For the reporting side of this, see how groups structure restaurant group COGS reporting, and for the variance KPI specifically, theoretical versus actual food cost variance covers where the gap hides.
Reading One Location Against the Group Standard
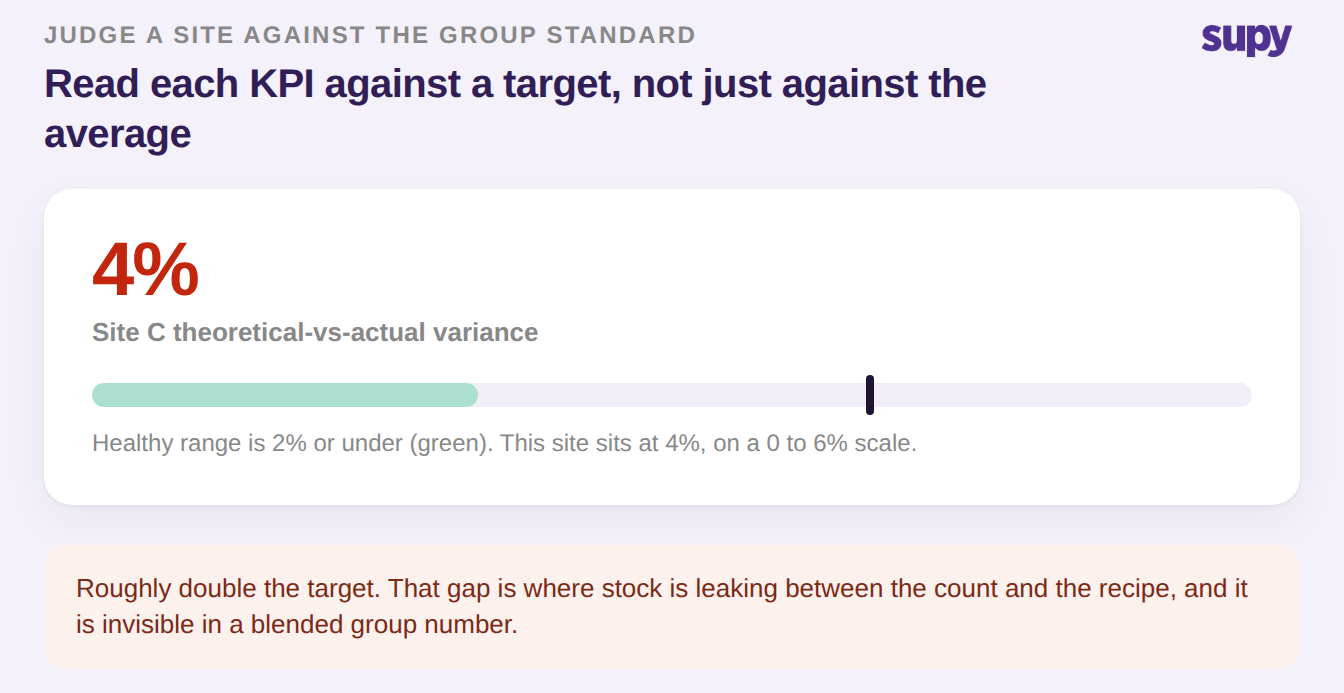
Once the inputs line up, benchmark each KPI against a target, not just against the group average. The average tells you the middle; the target tells you whether a site is actually healthy. A location can sit near the group mean and still be off the standard you want to run.
Take variance as an example. A healthy theoretical-versus-actual variance is around 2% or under. A site at 4% is roughly double that, and the gap is where stock is leaking between the count and the recipe. Read against the average alone, it might look unremarkable; read against the 2% target, it is the first place to send a manager this week.
So keep the benchmark small and honest. Choose three or four controllable KPIs. Normalise them so every site measures the same thing on the same dates, then read each one against a target rather than the group average. Start with the KPI where your sites diverge most, and send the outlier its one action for the week. Let the comparison, not the blend, tell you where to look next.