.jpeg)


Unrentable Menüpunkte finden: Warum ein gesunder Wareneinsatz-Durchschnitt verlustbringende Gerichte verbirgt
Warum ein gesunder kombinierter Wareneinsatz verlustbringende Gerichte verbirgt
Ein unrentabler Menüpunkt ist jedes Gericht, dessen tatsächliche Tellerkosten als Anteil am Menüpreis deutlich über Ihrer Ziel-Wareneinsatzquote liegen – es bringt damit kaum oder gar keine Marge ein, selbst wenn es sich gut verkauft. Ein Gesamtdurchschnitt über die gesamte Speisekarte verbirgt diese Gerichte, weil günstige Posten wie Getränke und Beilagen die teuren mathematisch ausgleichen, die Gesamtzahl gesund halten und gleichzeitig einzelne Gerichte Verluste einfahren.
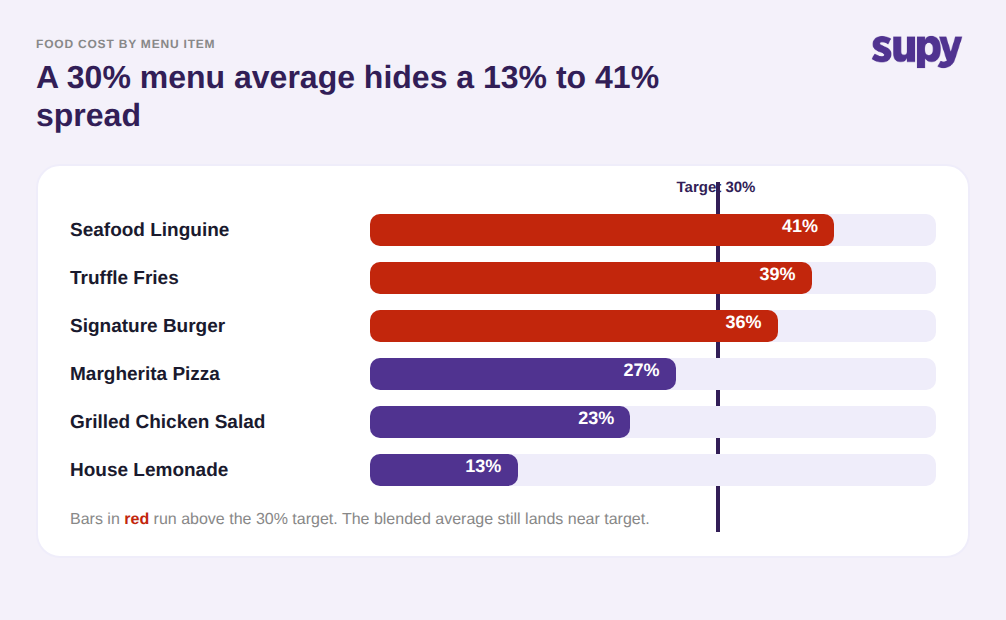
Das ist kein hypothetisches Szenario. Das Finanzteam eines Casual-Dining-Betreibers mit mehreren Standorten meldete eine konstante Bruttogewinnmarge von rund 63 % an allen Standorten. Eine vierteljährliche Tiefenanalyse stellte fest, dass zwei Standorte tatsächlich bei 55 bis 57 % lagen. Die kombinierte Zahl hatte ihre Underperformance drei Monate lang überdeckt. Dieselbe statistische Falle wirkt eine Ebene tiefer – auf Gerichtsebene. Eine Speisekarte mit durchschnittlich 30 % Wareneinsatz kann ohne Weiteres drei oder vier Gerichte mit 40 % oder höher enthalten, und die schlimmsten Ausreißer sind selten die Gerichte, die jemand beobachtet. Der Signature-Burger, den alle für einen Margensieger halten, kann das Gericht sein, das Sie still am meisten kostet – weil sein Volumen einen kleinen Verlust pro Teller in einen großen monatlichen Schaden verwandelt.
Die Lösung beginnt mit einem Perspektivwechsel: Hören Sie auf zu fragen „Liegt mein Wareneinsatz im Zielbereich?" – und fragen Sie stattdessen: „Welche spezifischen Gerichte liegen über dem Zielwert, und wie oft werden sie verkauft?" Das ist die eigentliche Aufgabe.
Wo Ihre Rezeptkosten unbemerkt von der Realität abrücken
Selbst Betreiber, die glauben, ihre Rezeptkalkulation sei korrekt, arbeiten in der Regel mit Zahlen, die sich verschoben haben. Es gibt zwei Wege, wie das passiert – und beide bleiben unsichtbar, bis Sie es überprüfen.
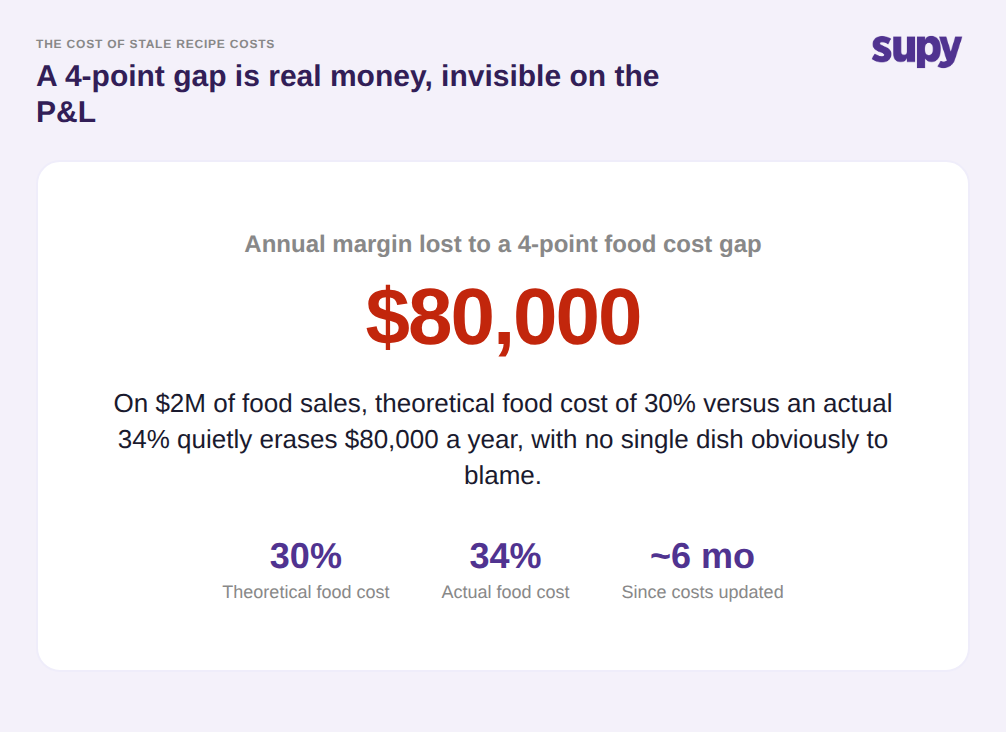
Der erste ist veraltete Rezeptkosten. Ein Operations-Leiter einer Multi-Standort-Fast-Casual-Kette sah, wie der theoretische Bruttogewinn Monat für Monat 4 bis 5 Prozentpunkte über dem tatsächlichen Wert in der Gewinn-und-Verlustrechnung lag. Der Grund waren Rezeptkosten, die seit rund sechs Monaten nicht aktualisiert worden waren. Bei 2 Millionen Dollar Jahresumsatz mit Lebensmitteln entspricht eine 4-Punkte-Lücke zwischen dem, was die Rezepte an Ausgaben vorsehen, und dem, was tatsächlich ausgegeben wird, 80.000 Dollar verlorener Marge – ohne dass ein einzelnes Gericht offensichtlich dafür verantwortlich wäre. Die theoretische Zahl sieht stimmig aus, gerade weil sie auf Preisen basiert, die nicht mehr existieren.
Der zweite sind volatile Zutatenpreise. Ein Beschaffungsleiter beschrieb den tatsächlichen Rhythmus unverblümt: Rezeptkosten werden manuell „bestenfalls vierteljährlich" aktualisiert. Frische Produkte, Proteine und andere volatile Posten verändern sich kontinuierlich – ein Rezept, das im Januar kalkuliert wurde, läuft im April auf drei Monate alte Preise. Ein Gericht, das beim letzten Kosten noch profitabel war, kann ins Minus geraten, ohne dass sich eine einzige Zeile auf der Speisekarte geändert hat. Wer wissen möchte, wie man unrentable Menüpunkte findet und dauerhaft im Blick behält, muss sicherstellen, dass die Kalkulation hinter der Prozentzahl aktuell ist – kein jährliches Vorhaben. Unser Leitfaden zur Abweichung zwischen theoretischem und tatsächlichem Wareneinsatz erläutert diese Lücke im Detail.
Wie Sie jeden Menüpunkt so kalkulieren, dass die Prozentzahl wirklich aussagekräftig ist
Sie können Gerichte nicht nach Marge priorisieren, bis die Kosten jedes Gerichts wirklich korrekt sind. Das erfordert eine konsistente Kalkulation jedes Rezepts und den Vergleich mit einem Zielwert.
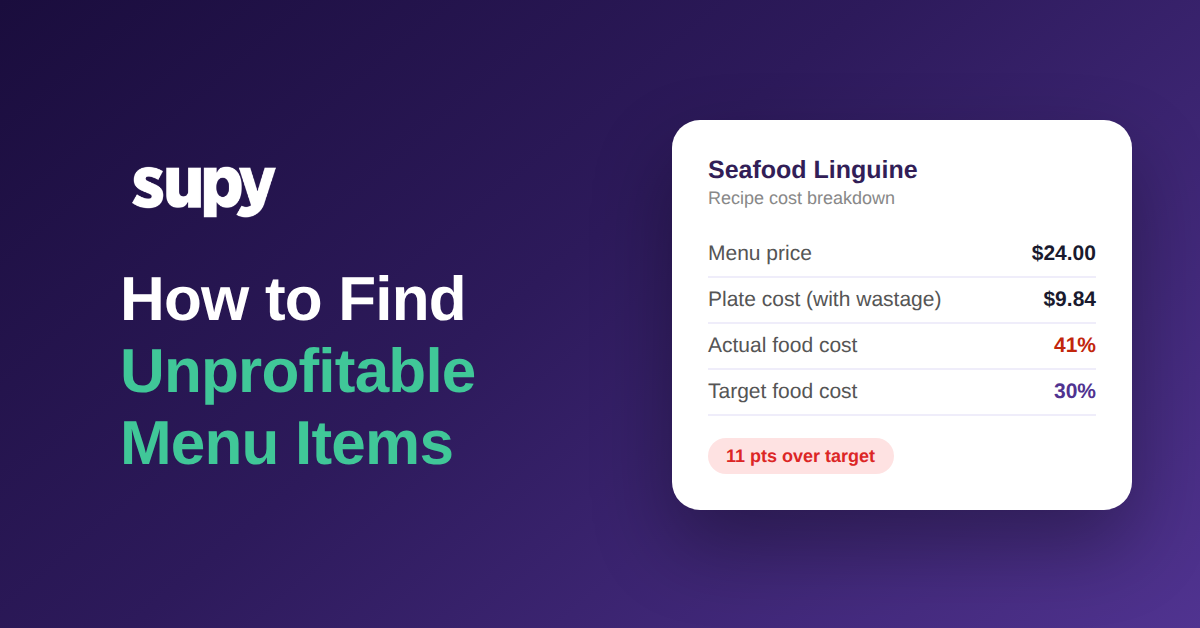
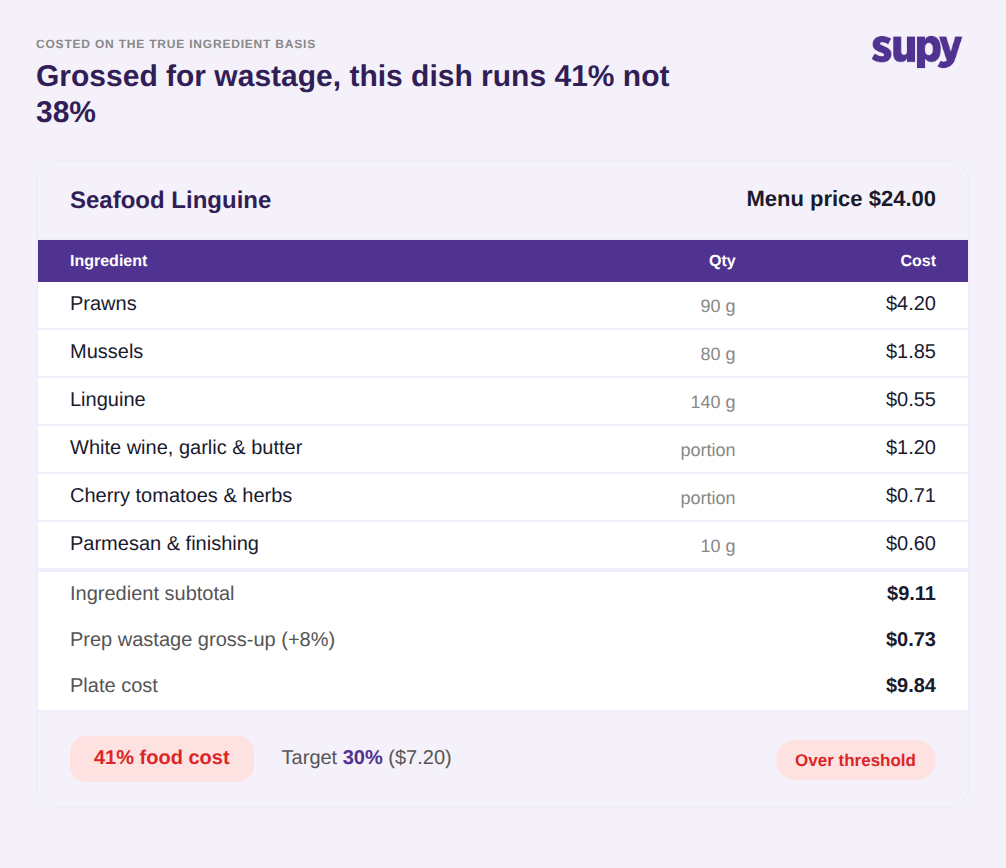
Kalkulieren Sie auf Basis der tatsächlichen Zutaten. Die Tellerkosten sollten auf Netto-Zutatenkosten (ohne MwSt.) basieren und um Verarbeitungsabfall und Ertragsverluste aufgestockt werden, damit die Zahl das tatsächlich in der Küche Verbrauchte widerspiegelt – nicht das Rohkaufgewicht. Nehmen Sie eine Meeresfrüchte-Linguine zum Preis von 24,00 Dollar. Ihre Zutaten belaufen sich auf 9,11 Dollar, aber nach Aufstockung für rund 8 % Verarbeitungsabfall betragen die tatsächlichen Tellerkosten 9,84 Dollar. Das entspricht einem Wareneinsatz von 41 % gegenüber einem Zielwert von 30 % – das Gericht müsste rund 7,20 Dollar kosten, um den Zielwert zu erreichen, und überschreitet ihn bei jedem einzelnen Teller um fast 2,65 Dollar. Nur auf Basis des Rohgewichts kalkuliert hätte dasselbe Gericht bei rund 38 % gelegen – und die entscheidende Lücke wäre verborgen geblieben.
Setzen Sie für jedes Rezept einen Zielwert. Supys Rezeptkalkulation ermöglicht es, für jedes Gericht eine Ziel-Wareneinsatzquote festzulegen, und benachrichtigt Sie genau dann, wenn die tatsächlichen Kosten diesen Schwellenwert überschreiten – sodass ein Gericht, das von 30 % auf 41 % driftet, von selbst auffällt, statt auf eine vierteljährliche Überprüfung warten zu müssen. Rezepte sind mit Ihren POS-Menüpunkten verknüpft – einschließlich Modifikationen –, sodass Verkäufe die richtigen Zutaten verbrauchen und die Aufschlüsselung nach Kostenstellen genau zeigt, welche Zutat ein Gericht in die Höhe treibt. Da Zutatenpreise automatisch in die Tellerkosten einfließen, bleibt die Quote aktuell, wenn sich Lieferantenpreise verschieben. Das ist der Unterschied zwischen einer Zahl, auf die Sie reagieren können, und einer, der Sie misstrauen müssen.
Gerichte nach Marge und Beliebtheit priorisieren – nicht nur nach Wareneinsatz
Eine hohe Wareneinsatzquote ist nicht automatisch ein Problem, und eine niedrige kein automatischer Erfolg. Ein Gericht mit 40 % Wareneinsatz, das 400 Couverts pro Woche verkauft, kann mehr absolute Marge generieren als ein 20-%-Artikel, der nur 20-mal verkauft wird. Deshalb ist der letzte Schritt beim Finden unrentabler Menüpunkte, jedes Gericht gleichzeitig auf zwei Achsen zu bewerten: Marge und Beliebtheit.
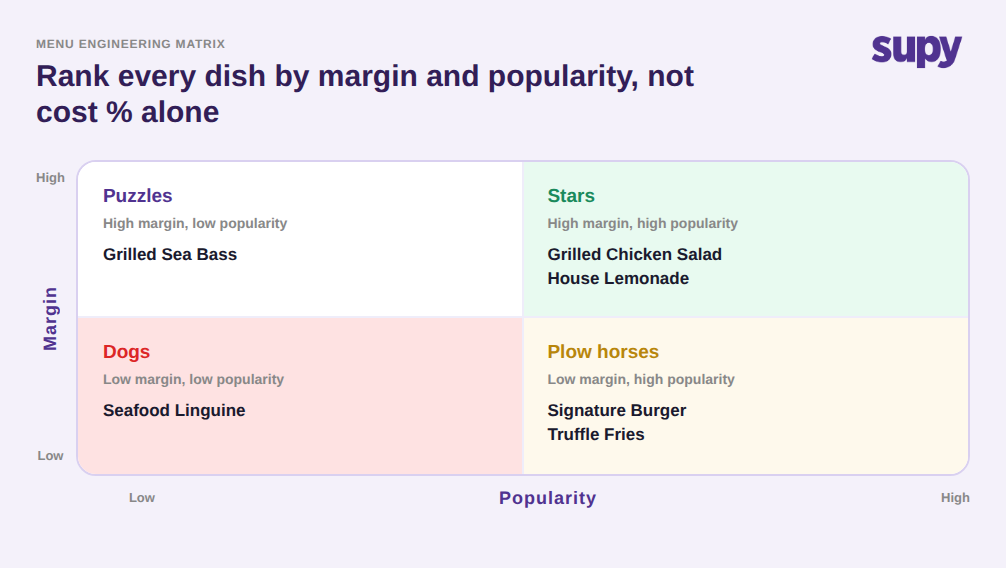
Menu-Engineering tut genau das: Es sortiert jedes Gericht in eine von vier Kategorien. Stars sind Gerichte mit hoher Marge und hoher Beliebtheit – die Gerichte, die es zu schützen und zu fördern gilt. Plow Horses (Arbeitstiere) sind beliebt, aber margeschwach – von Gästen geliebt, obwohl sie still Kosten verursachen, und in der Regel der wertvollste Ansatzpunkt, weil ihr Volumen jeden Prozentpunkt der Überkosten verstärkt. Puzzles haben eine hohe Marge, sind aber wenig beliebt – es lohnt sich, ihre Menüpositionierung oder Beschreibung zu überarbeiten. Dogs haben niedrige Marge und geringe Beliebtheit – Kandidaten für Neubepreisung, Überarbeitung oder Streichung. Die Meeresfrüchte-Linguine mit 41 % Wareneinsatz, die selten bestellt wird, ist ein Dog, den Sie mit geringem Aufwand streichen können; eine 39-%-Trüffel-Pommes-Beilage, die auf der Hälfte aller Kassenbons erscheint, ist ein Plow Horse, den es sich lohnt neu zu konzipieren, statt ihn zu entfernen.
Dafür brauchen Sie Verkaufsvolumen kombiniert mit korrekten Kosten. Mit täglicher POS-Synchronisierung für umsatzseitige Daten auf Gerichtsebene und einer Menu-Engineering-Matrix, die Marge und Beliebtheit gegenüberstellt, landet jedes Gericht automatisch in seinem Quadranten – und Sie beginnen mit den Plow Horses, die die meiste Marge aufzehren, statt der erschreckendsten Prozentzahl nachzujagen.
Wo Sie diese Woche anfangen
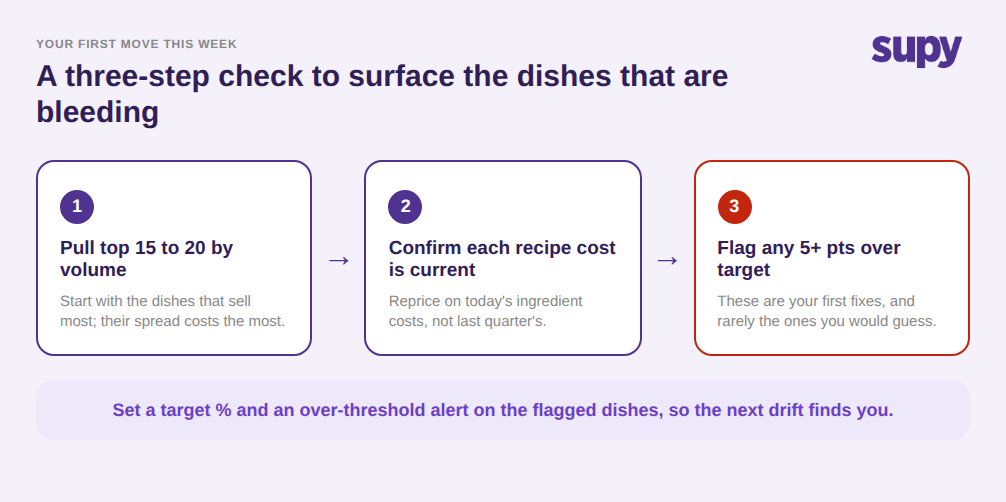
Wenn Ihr kombinierter Wareneinsatz gut aussieht, Sie Gerichte aber noch nie einzeln bewertet haben, gehen Sie davon aus, dass der Streubereich existiert – denn das ist fast immer der Fall. Hier ist die schnelle Selbstprüfung: Ermitteln Sie Ihre 15 bis 20 meistverkauften Gerichte, überprüfen Sie, ob die jeweiligen Rezeptkosten aktuell statt monatelang alt sind, und berechnen Sie für jedes Gericht den tatsächlichen Wareneinsatz im Vergleich zum Zielwert. Jedes Gericht, das den Zielwert um mehr als 5 Punkte überschreitet und sich zudem gut verkauft, ist Ihr erster Ansatzpunkt – und es ist in der Regel nicht das Gericht, das Sie erwartet hätten. Setzen Sie einen Zielwert und eine Überschreitungswarnung für diese Gerichte, damit der nächste Drift Sie findet – statt dass Sie ihn ein Quartal zu spät entdecken.
Der Durchschnitt wird Ihnen weiterhin erzählen, dass die Speisekarte in Ordnung ist. Die einzelnen Gerichte werden Ihnen die Wahrheit sagen. Die Betreiber, die ihre Marge schützen, sind diejenigen, die aufgehört haben, der kombinierten Zahl zu vertrauen, und stattdessen begonnen haben, den Streubereich darunter zu lesen.