.jpg)


Perpetual vs Periodic Inventory for Restaurants: When to Count

What Perpetual and Periodic Inventory Mean in a Restaurant
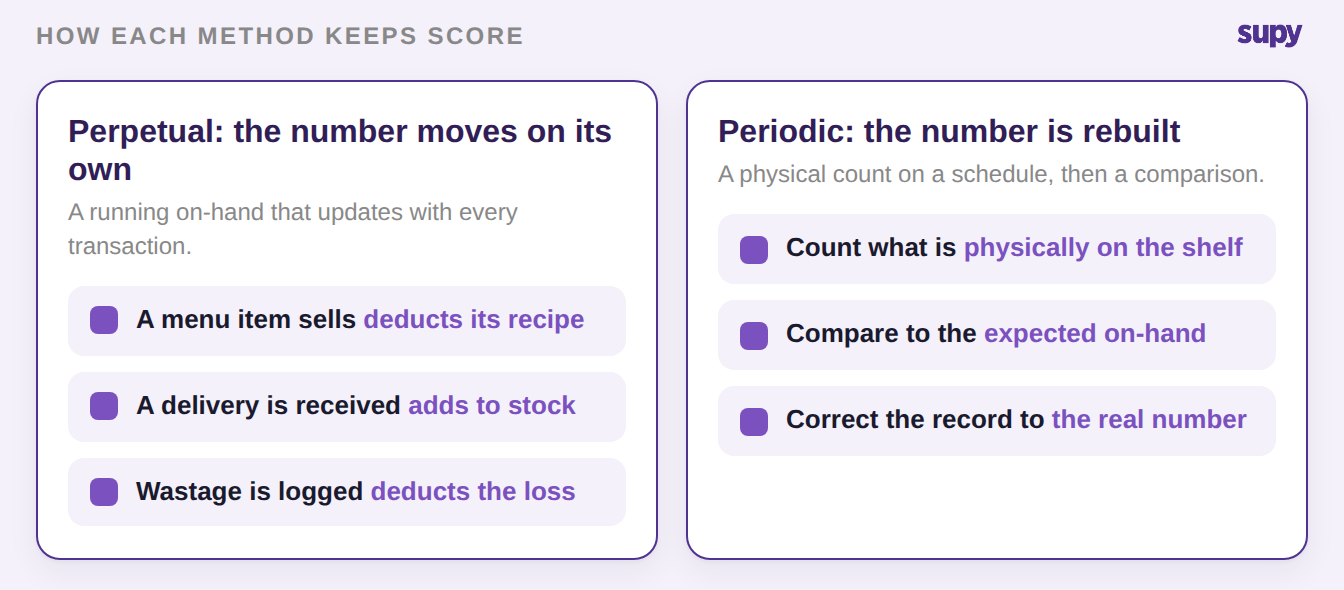
Perpetual and periodic are the two inventory methods a restaurant runs. Perpetual keeps a running stock figure that updates as you sell, receive and waste. Periodic rebuilds the number from a physical count on a schedule, and most restaurant systems use it to correct a perpetual, theoretical on-hand from recipe depletion.
In practice the two describe different jobs, not rival products. The perpetual figure is the number on your screen between counts. It moves down as menu items sell and recipes deplete their ingredients. It moves up as deliveries are received, and it drops again as wastage is logged. It is theoretical because it trusts that every sale, delivery and spill was recorded.
The periodic count is the ground truth. A team physically counts what is on the shelf, and the restaurant inventory system compares that to what it expected. A single-site operator counting weekly can lean almost entirely on the count. A multi-site group cannot count every item every day, so the perpetual figure is what managers act on between counts, and the count is what keeps it honest.
Real-Time Visibility vs Ground Truth: A Side by Side
The two methods trade off the same way in every kitchen. Perpetual gives you a number now. Periodic gives you a number you can trust. Read the comparison by the job each one does, not by which is better.
| Criterion | Perpetual (continuous tracking) | Periodic (scheduled count) |
|---|---|---|
| When the number updates | Continuously, as you sell, receive and waste | Only when a physical count is submitted |
| What it is good for | Daily ordering, live value, low-stock and over-par flags | Proving the real number and exposing variance |
| Main weakness | Drifts when a sale, delivery or spill goes unrecorded | Out of date the moment the next transaction happens |
| Staff effort between counts | Low; the system maintains it | High; someone has to count |
| Best use in a group | The number managers act on day to day | The scheduled true-up that corrects drift |
Why Multi-Site Groups Run Both
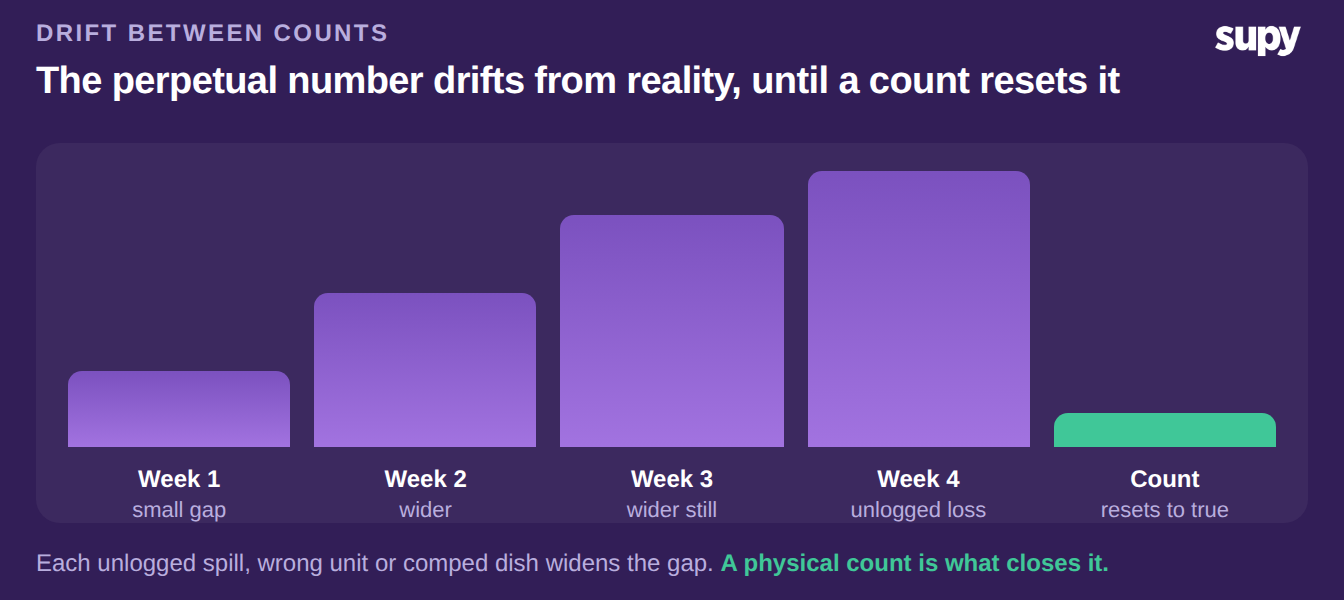
A perpetual figure is only as accurate as the data feeding it. Every unlogged spill, every delivery received in the wrong unit, every comped dish widens the gap between what the system expects and what is on the shelf. That gap is variance, and you cannot see it without a physical count.
This is why the two methods are partners, not alternatives. A scheduled physical count produces a variance report: item by item, the difference between the count and the expected on-hand at the moment of counting. A small, steady variance means your recipes and receiving are clean. A large or growing one points to a specific break, such as a unit-of-measure error on a goods received note or a recipe that no longer matches the plate.
Between counts, the perpetual number does the daily work. It lets a manager reorder against par and read stock value on any given morning without stopping to count. Run perpetual alone and the drift compounds silently until a month-end number surprises you. Count with nothing in between and you are blind to stock every day except count day.
If you'd rather not work par out by hand, the free par level calculator does it for every item on your sheet from your usage, delivery days and supplier lead times.
How Often to Count, and Which Method to Lean On
Once a system maintains a perpetual figure, count frequency stops being as often as possible. It becomes a question of risk. Count the items that move fast, spoil, or carry the most cost more often than the stable, low-value ones. That is cycle counting: instead of one exhausting full count, you count a section at a time on a rota. Every high-risk category is checked often, and nothing waits a whole month.
A workable pattern for a group is a weekly cycle count of the high-risk categories, fresh produce, proteins and open beverages, where variance shows up fastest. Then a full count at period end resets every item for reporting. Reusable per-location count templates and letting several staff count different sections in parallel are what make this manageable across sites. Set the cadence to your variance tolerance: if a category swings, count it more often and fix the source, rather than counting everything more often.
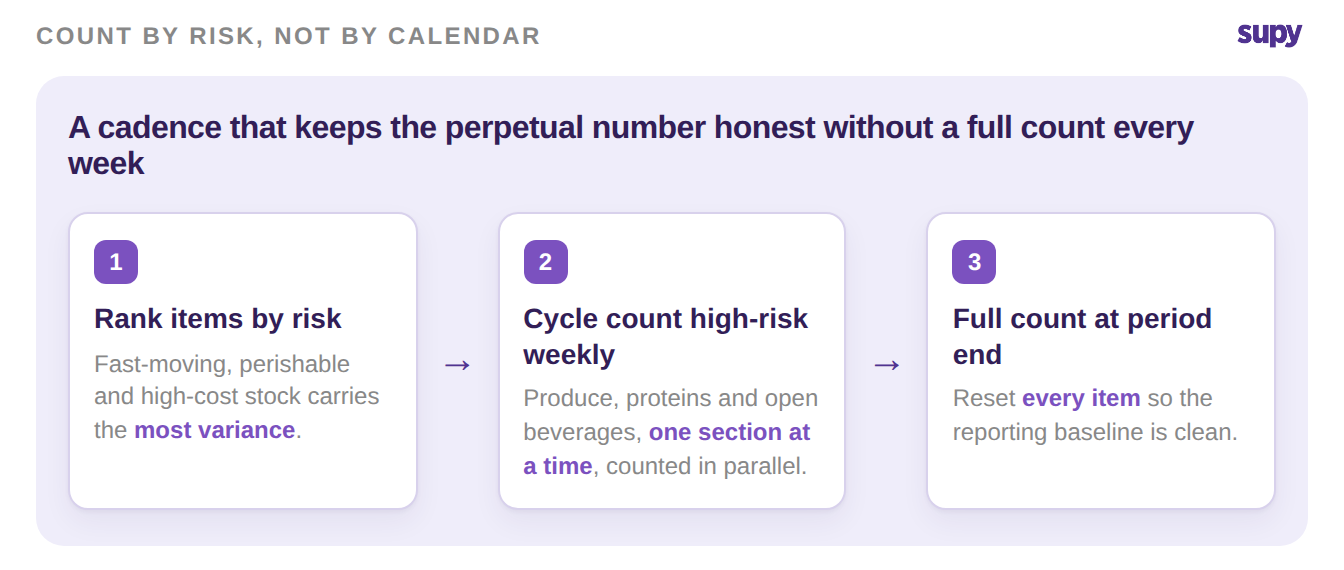
So which method fits your group? Lean on the perpetual figure for daily ordering and live value, because it is always there and needs no one to maintain it. Rely on periodic counts for the truth, and schedule them by risk: cycle-count high-value and fast-moving categories weekly, and full-count at period end. If you count everything once a month and fly blind in between, add a perpetual figure first. If you have one but never count, start with a weekly cycle count of your three highest-variance categories. The move this week is to name those three categories and put the first cycle count on the rota.