.jpg)


Restaurant Inventory Variance: Trace It Across Multiple Locations
Start Every Variance Investigation by Ruling Out Data Errors
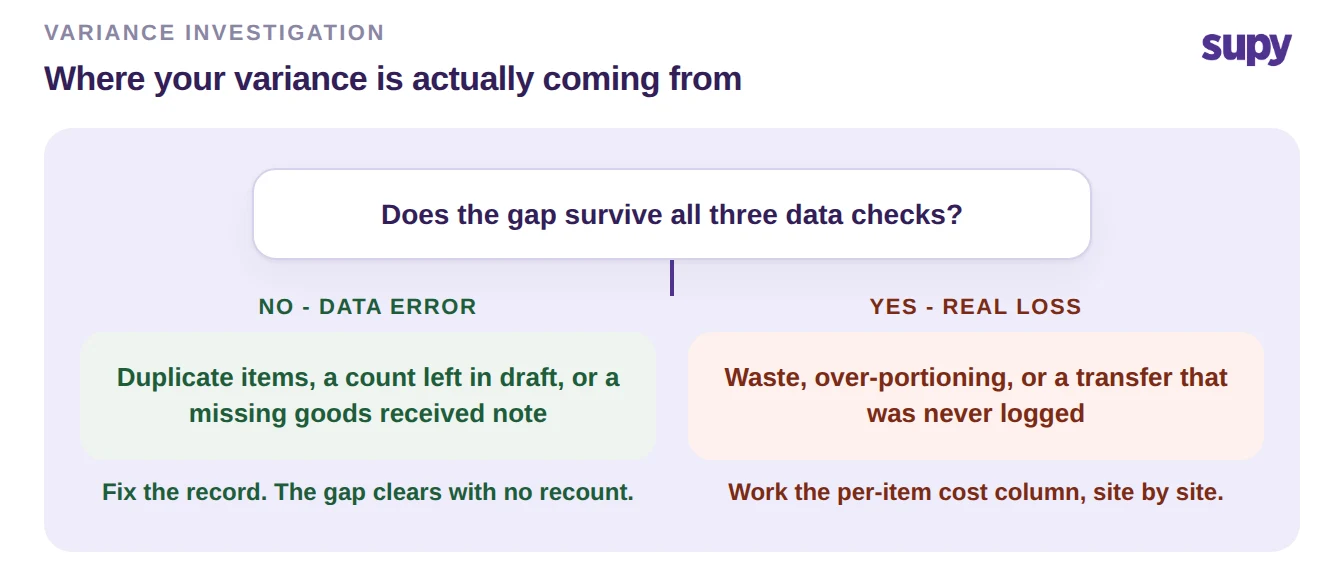
A restaurant inventory variance investigation across multiple locations starts by separating data errors from real loss. Most of the gap between the stock the system expected and the stock a count found comes from duplicate items, counts left in draft, or deliveries that never reached the system. Theft and waste are usually the smallest part.
That order matters because the fixes are different, and three of the four causes cost nothing to put right. Chase shrink first and you tighten portioning and lock the store while the real gap sits in a data field nobody checked. Work the causes in sequence instead, from cheapest to rule out to hardest.
Each cause leaves a different fingerprint. A variance that disappears the moment you merge two item records was never loss. A variance that shows up only at the sites whose teams count late points at process, not pilferage. Supy's live stock visibility holds the theoretical figure against the actual for every item at every site, so you can read which branch each discrepancy belongs to before you act on it.
Across a group of six sites, the same four branches explain almost every line. Walk them in this order.
When One Ingredient Is Three Items
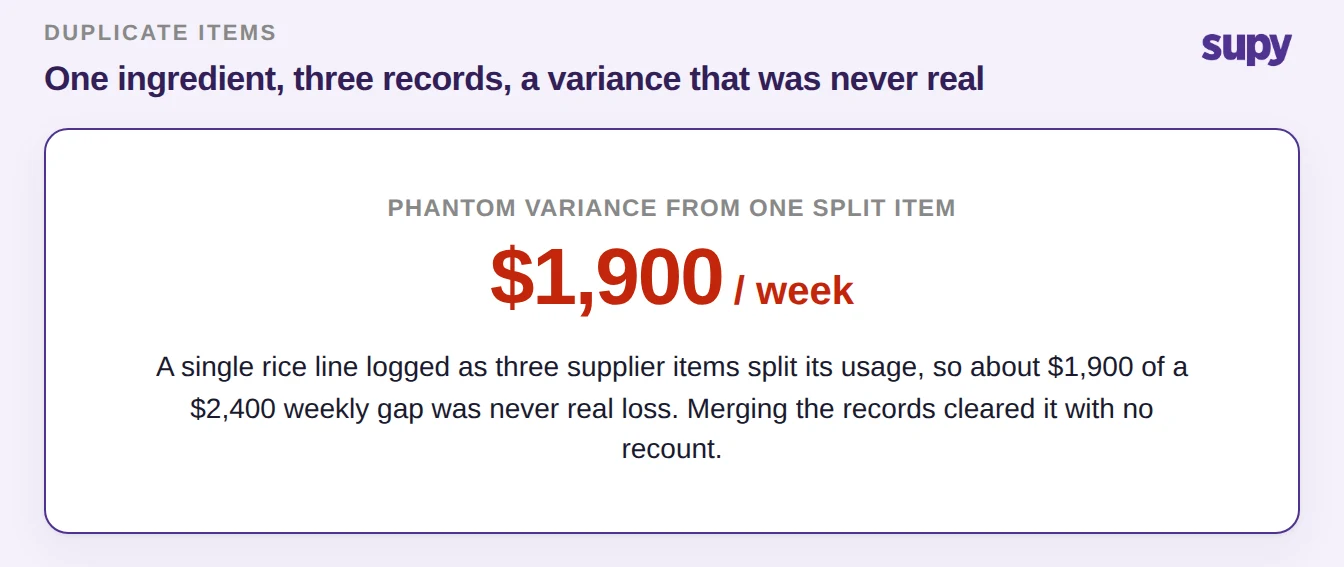
Duplicate items are the first thing to rule out because they invent variance that was never there. One pasta, one cooking oil, or one cut of chicken bought from three suppliers often ends up as three separate item records. Each record carries part of the usage and part of the stock, so the counted figure and the theoretical figure never line up, even when the shelf is correct.
Say one rice line is logged as three supplier items across a six-site group. The weekly report shows a $2,400 gap on that ingredient. Merge the three records into one base item and about $1,900 of that gap disappears, because the usage that was split three ways finally meets the stock in one place. Only $500 was ever real.
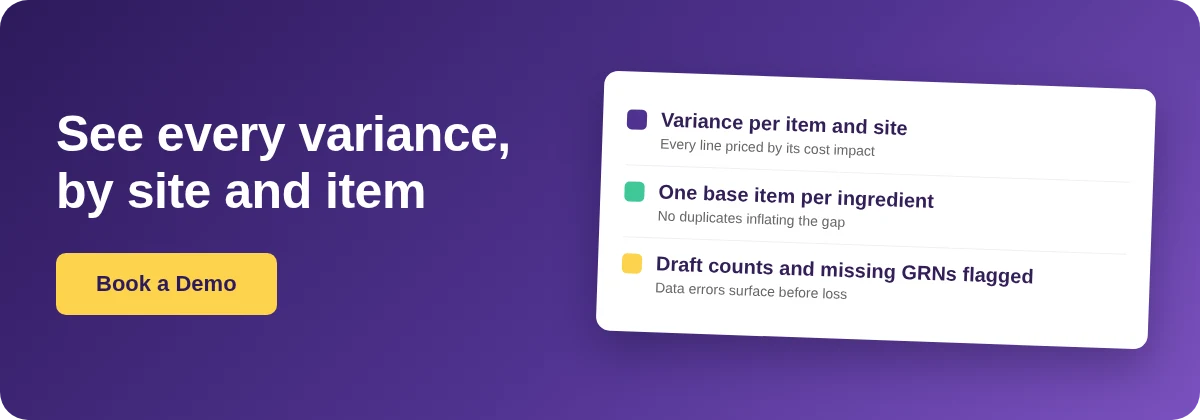
The fix is to hold one base item per ingredient with every supplier SKU linked underneath it. Supy keeps that structure and recomputes variance against true usage the moment you merge, so the phantom gap clears without a recount. The related walkthrough on duplicate ingredient items covers the merge step by step.
When the Count Never Closed
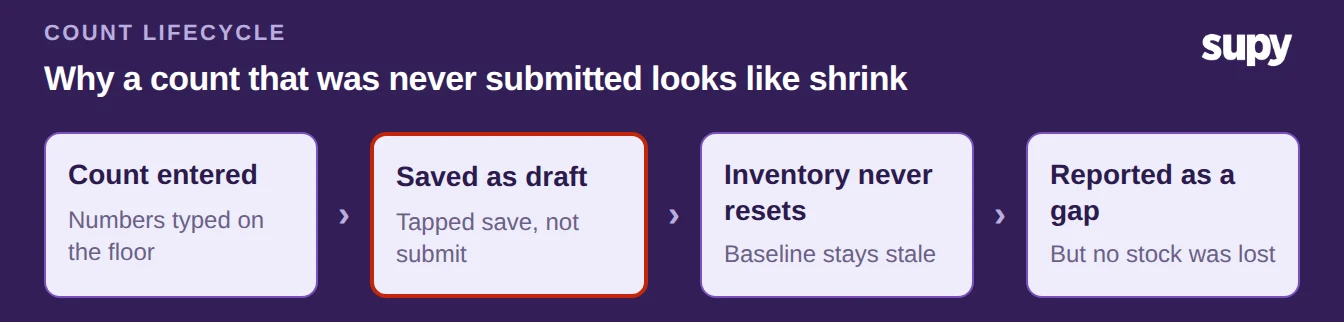
Two data errors share one symptom: the count never finalised, so the system's picture was incomplete before the maths ran. Both produce a variance that looks like shrink and is not.
- Counts left in draft. A counter enters the numbers but taps save instead of submit, so the inventory never resets. The next period measures usage against a stale baseline, and the gap it reports is the unsubmitted count, not lost stock. This is the most common cause at sites where the team is new to the app.
- Deliveries never received. Stock arrives but no goods received note (GRN) is raised, so the system holds less than the shelf. The count then reads higher than theoretical, or a later issue drives the balance negative. Received stock has to be in the system before the count, or the count is measuring against the wrong number.
Both clear once the process closes properly. Confirm every site has submitted its count, not saved a draft, and that every delivery is received against a GRN before the count begins. Supy flags a pending unreceived order and shows which sites still hold a count in draft, so you can close the gap before you read a single variance line as loss.
When the Variance Is Real: Find the Site and Item
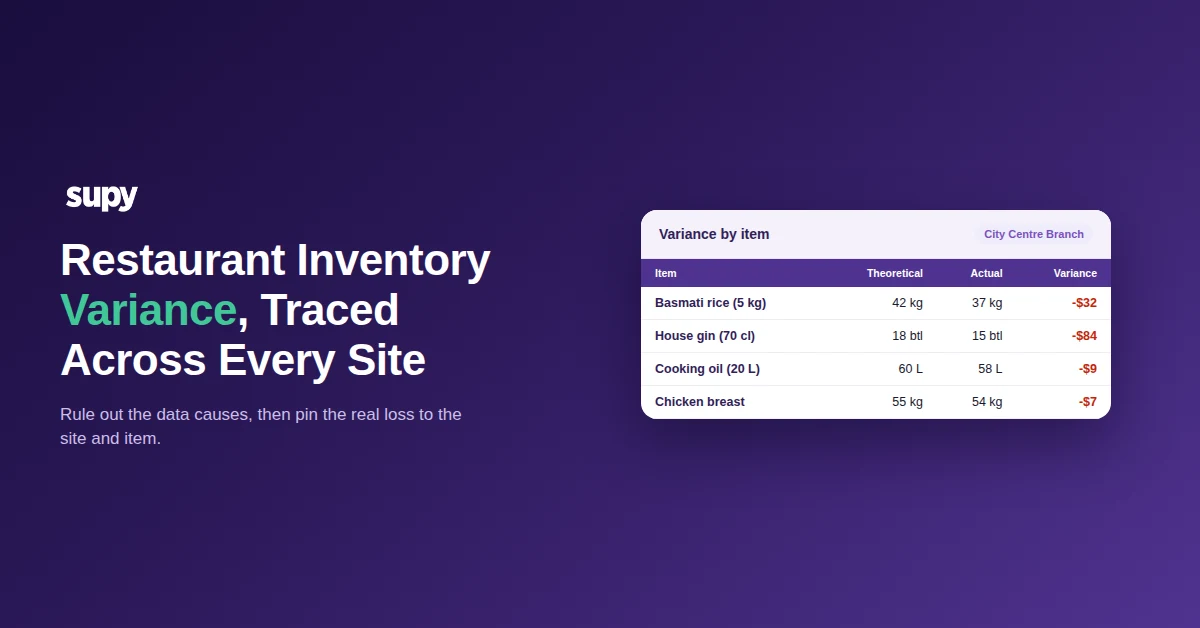
Once duplicates, draft counts, and missing GRNs are ruled out, the variance that remains is real: waste, over-portioning, or transfers that never got logged. This is where the per-item report earns its place. It lists every item whose counted figure differs from theoretical, per location, with the cost impact beside it, so a small unit gap on a high-cost item ranks above a large gap on a cheap one.
A worked example across one site:
| Item | Theoretical | Actual | Variance |
|---|---|---|---|
| Basmati rice (5 kg bag) | 42 kg | 37 kg | -5 kg / -$32 |
| House gin (70 cl) | 18 btl | 15 btl | -3 btl / -$84 |
| Cooking oil (20 L) | 60 L | 58 L | -2 L / -$9 |
| Chicken breast | 55 kg | 54 kg | -1 kg / -$7 |
Read the cost column, not the unit column. The gin costs more per unit than the rice, so its $84 gap is the first line to work even though the rice moved more units. Supy also compares each count against the previous one at that location. A discrepancy that returns every period surfaces as a pattern, not a one-off, which tells you a single site and item is losing stock, not the whole group.
Start With the Branch You Are In
Name the branch before you act. If the gap vanishes when you merge two records, it was duplicate items. If it sits at the sites that count late, it was draft counts or missing GRNs. If it survives all three checks and repeats at one location, it is real loss, and the per-item cost column tells you which item to work first. Run the four checks in that order at each site and you spend your time on the variance that is actually costing money, not on the three that only looked like it.