
From big picture to the smallest detail in seconds.
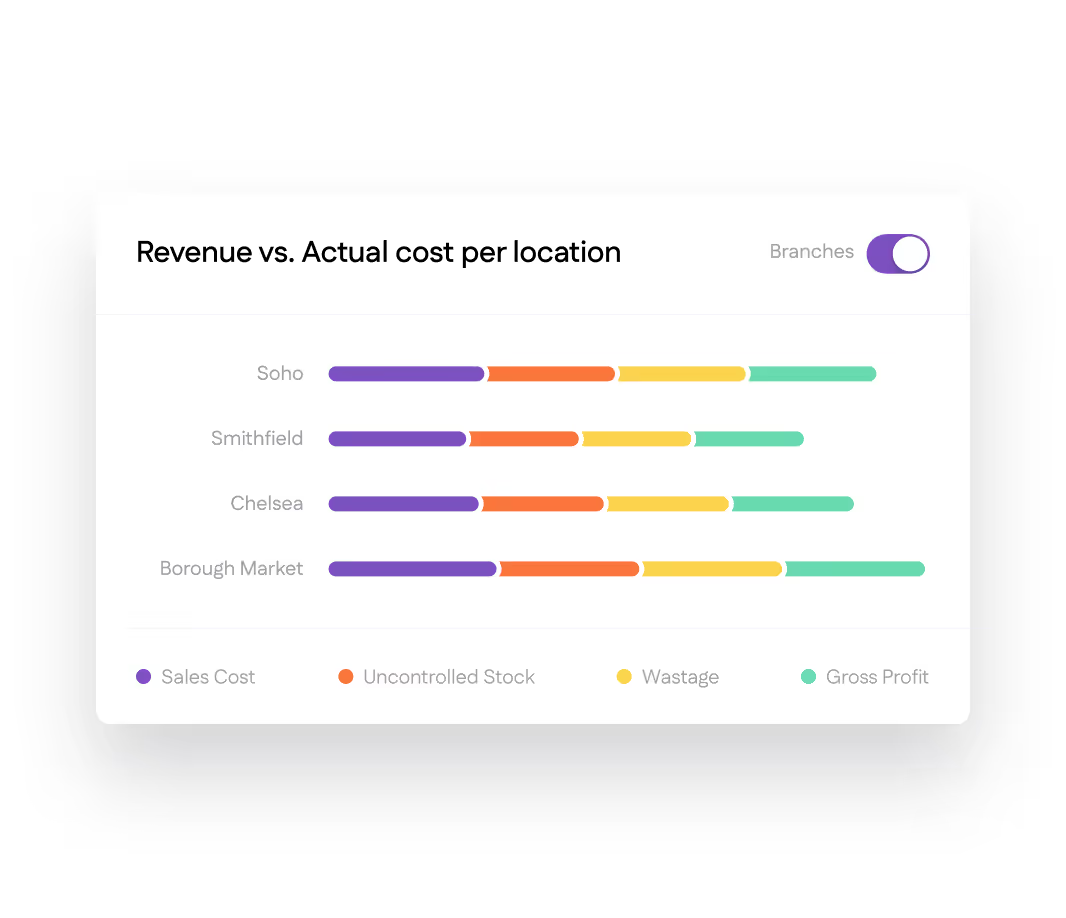
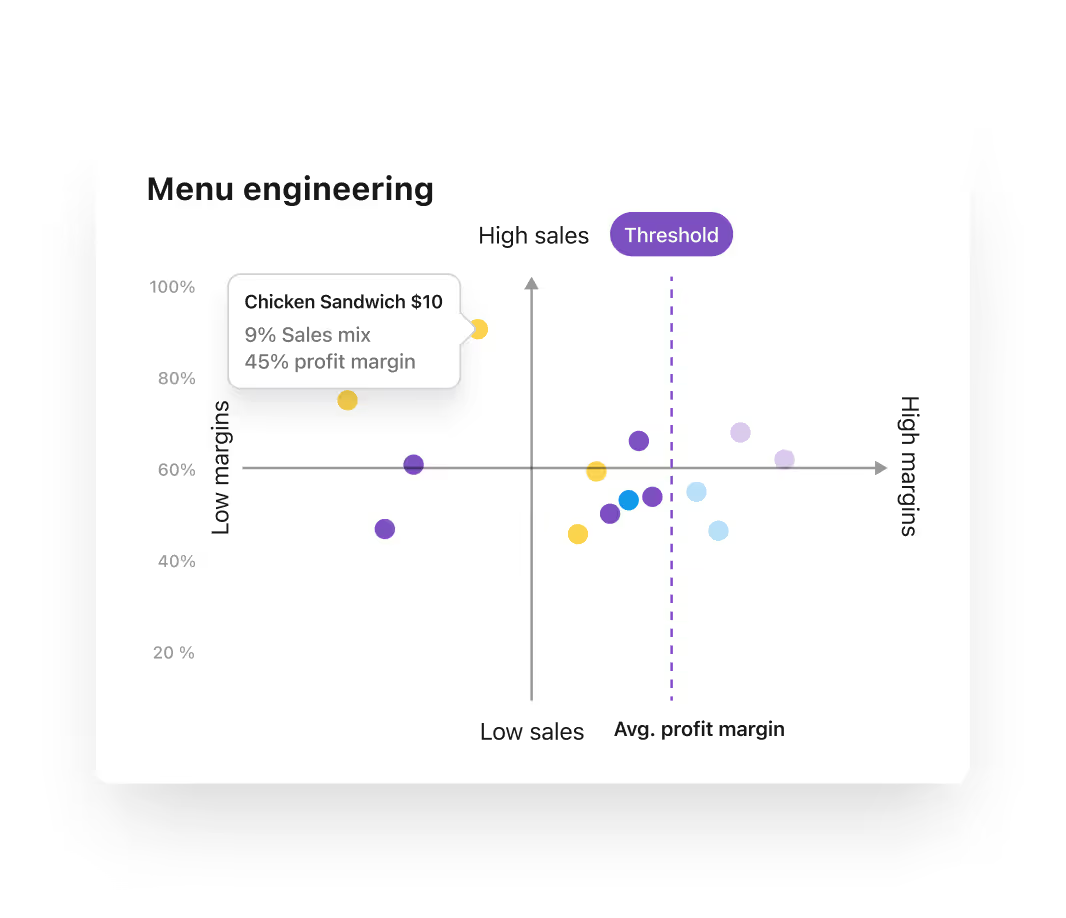
Supy’s dashboards turn your operational data into clear insights. Start with a high-level overview, then drill down to site, category, or item level - all in the same screen. Beautifully designed for clarity and speed to help teams not only report on performance but act on it.
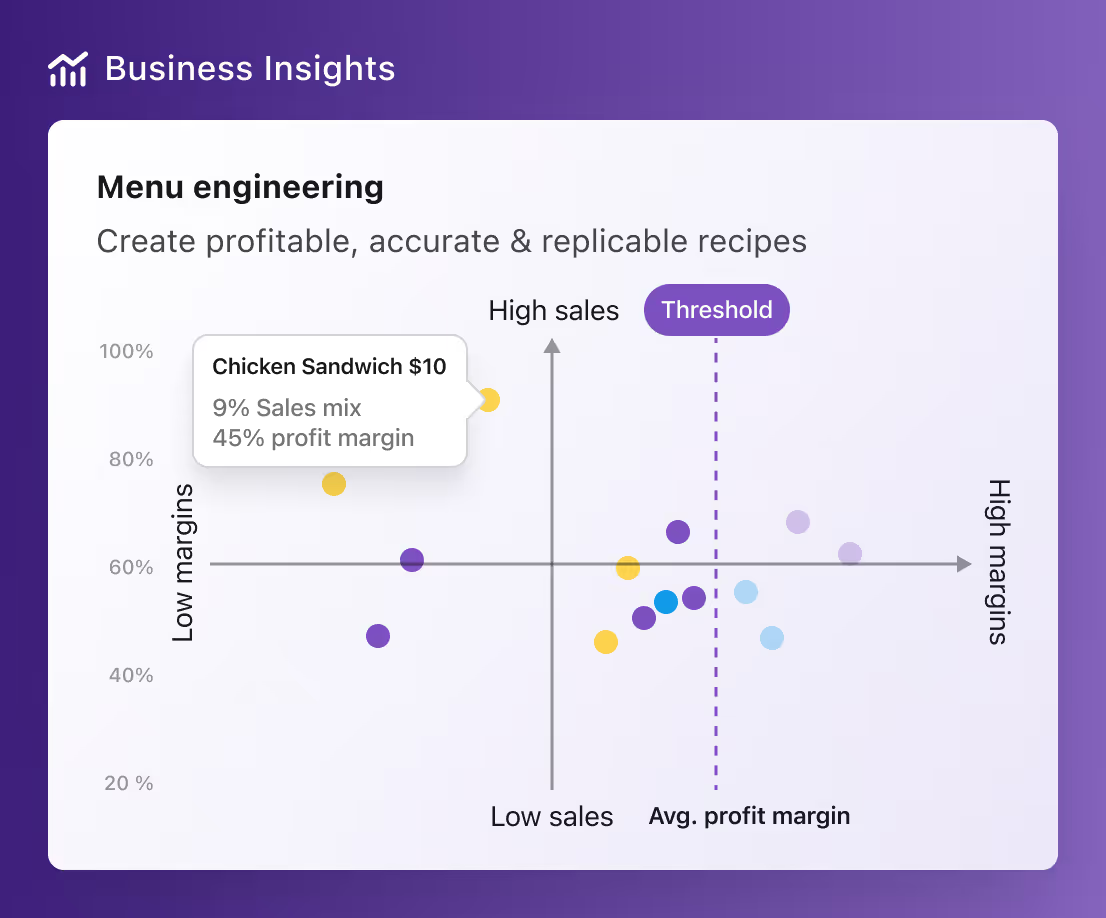
Real-time performance
Track costs, margins, and wastage without waiting for month-end.
Location comparisons
Identify your best and worst performers instantly.
Root cause analysis
Drill into categories, dishes, and ingredients to see what’s driving results.
COGS & food cost dashboards
- Live visibility of cost of goods sold (COGS) and food cost percentage.
- Track in real time at group, site, or menu category level.
- Identify sudden cost spikes and act before they impact margins.
Variance & wastage insights
- See variances between theoretical and actual stock usage.
- Breakdown of wastage by type, site, and item, all visualised for quick understanding.
- Pinpoint high-cost waste and target operational fixes.
Usage & stock movement analytics
- Get a clear view of stock movement and usage across all locations.
- Identify slow-moving items by site or menu category.
- Spot trends over time to improve forecasting and menu planning.
Profitability by site & category
- Compare site-by-site profitability at a glance.
- Drill down into menu category and dish-level margins.
- Use filters to see performance for specific time periods, brands, or regions.
Drill-down navigation & data export
- Start from a high-level KPI view, then click down to branch, category, or dish details.
- Export filtered views directly to spreadsheets for further analysis or sharing.
- Perfect for management meetings or quick decision-making.
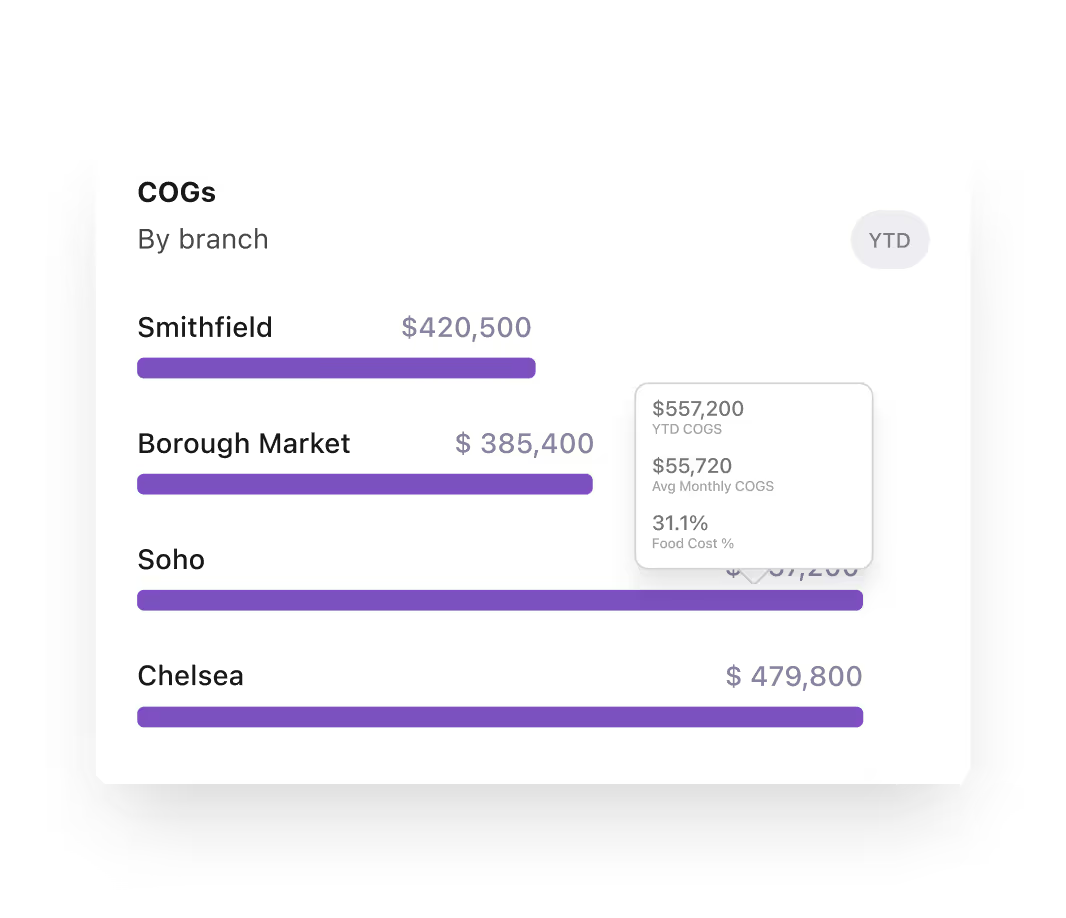
COGS & food cost dashboards
- Live visibility of cost of goods sold (COGS) and food cost percentage.
- Track in real time at group, site, or menu category level.
- Identify sudden cost spikes and act before they impact margins.
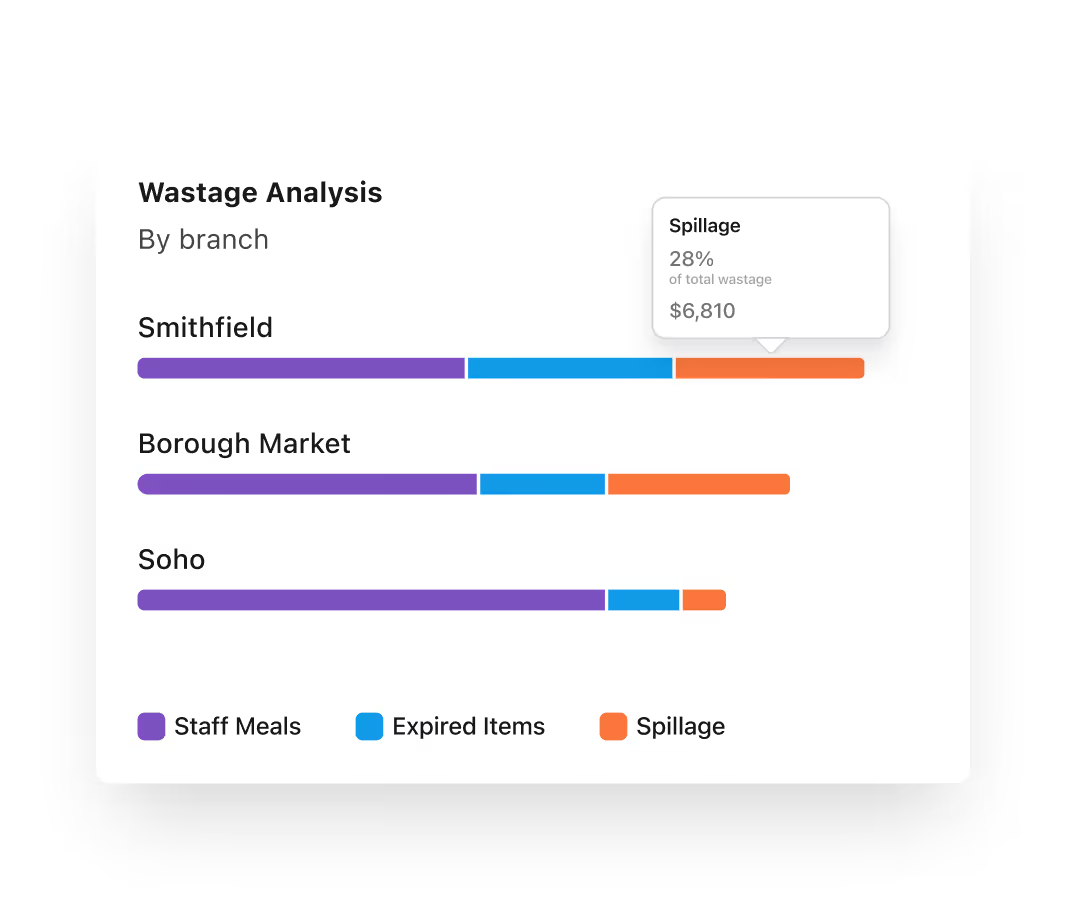
Variance & wastage insights
- See variances between theoretical and actual stock usage.
- Breakdown of wastage by type, site, and item, all visualised for quick understanding.
- Pinpoint high-cost waste and target operational fixes.
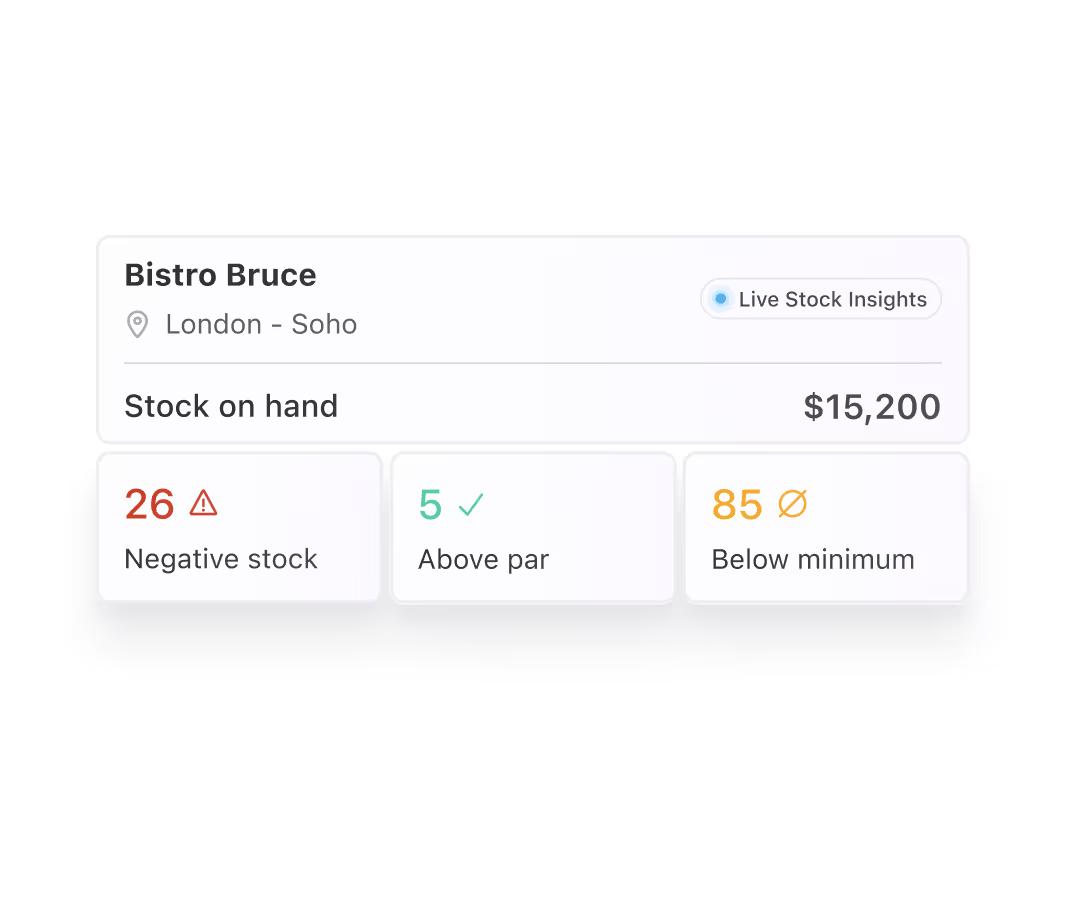
Usage & stock movement analytics
- Get a clear view of stock movement and usage across all locations.
- Identify slow-moving items by site or menu category.
- Spot trends over time to improve forecasting and menu planning.
Profitability by site & category
- Compare site-by-site profitability at a glance.
- Drill down into menu category and dish-level margins.
- Use filters to see performance for specific time periods, brands, or regions.
Drill-down navigation & data export
- Start from a high-level KPI view, then click down to branch, category, or dish details.
- Export filtered views directly to spreadsheets for further analysis or sharing.
- Perfect for management meetings or quick decision-making.

Over 75 integrations and counting
Connect Supy with all your favourite tools

Why our customers love us
Why our customers love us








.jpg)





Our operational insights
Our operational insights
準備好轉變您的營運了嗎?
加入3500多家餐廳營運商的行列,透過Supy削減成本、簡化營運並做出更明智的決策。
Your questions answered
Everything you need to know about Supy — from setup to integrations, pricing, and daily use. If it’s not covered here, just ask.
Yes, supy tracks ingredient costs and registers food waste. Not only that, Supy showcases the price fluctuations per ingredient and per
Yes, Supy has a mobile for both iPhone and Android.
Procurement is just the start
Supy is a full back-of-house platform — built to give multi-branch restaurants control over stock, data, and connected systems.
將 Supy 與您現有的工具和工作流程無縫連接。
透過即時庫存追蹤和即時食譜成本可視性,減少浪費,阻止差異並控制每個站點的食品成本。
提交採購申請、管理審批、發送採購單、向中央廚房訂貨及監察價格偏差 — 透過手機 App 或網頁版即可完成