The SpreadWhat restaurants pay & where their margins goSix blind spots revealed by 93 million data points
27M invoice lines66M price records296,092 stock counts44 countries
We analysed 93 million data points from real restaurants to find what they are actually spending, where their profit is leaking, and which habits protect a margin. This report sets out the key findings and the blind spots behind them, so that what a restaurant cannot currently see becomes something it can act on.
Use any of the data and charts in your own work. All we ask is that you credit supy.io/the-spread.
What the data found
Nearly 1 in 4 invoices charges a different price than the restaurant expected. And the actual price is higher than the agreed one far more often than it is lower, so any errors tend to cost the buyer, not the supplier.
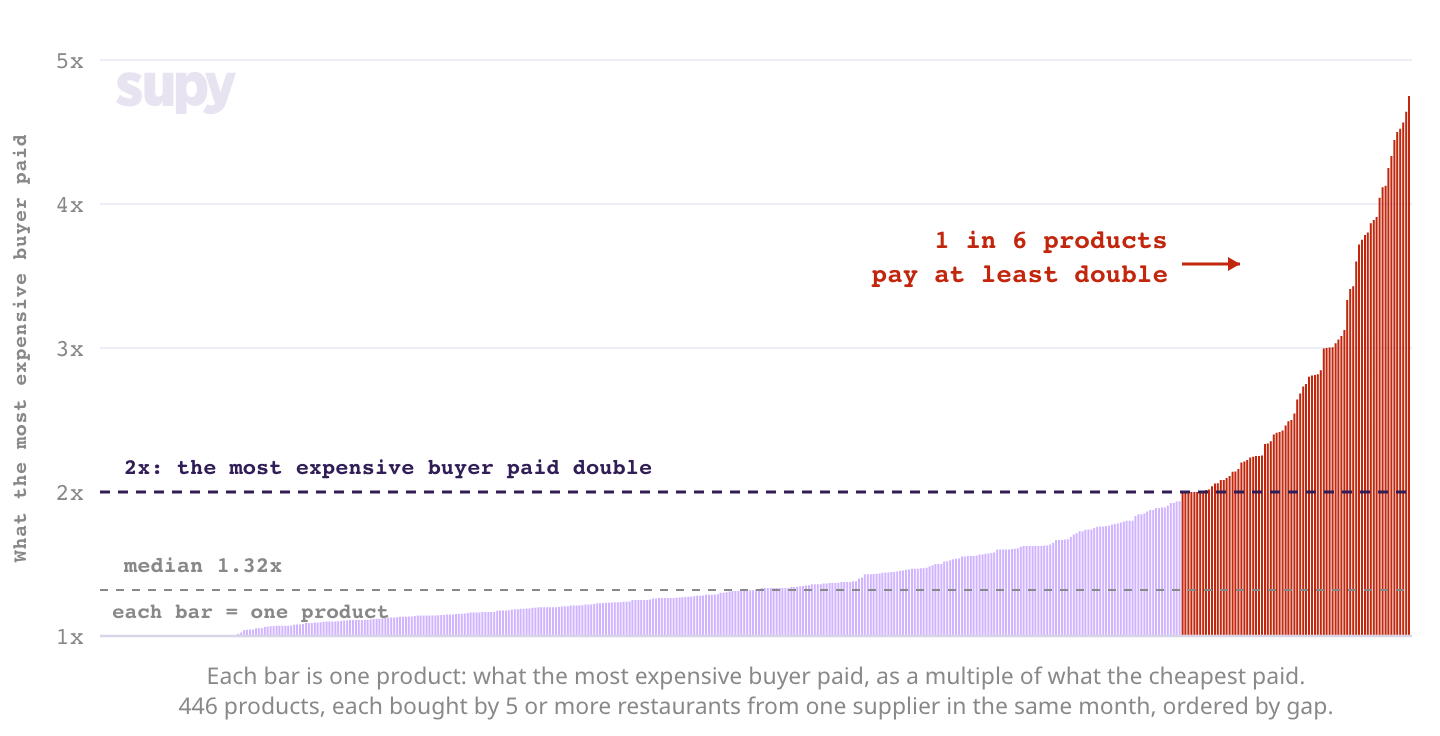
The same product, from the same supplier, in the same month, typically costs one restaurant 32% more than another. On 1 in 6 products, someone is paying at least double.
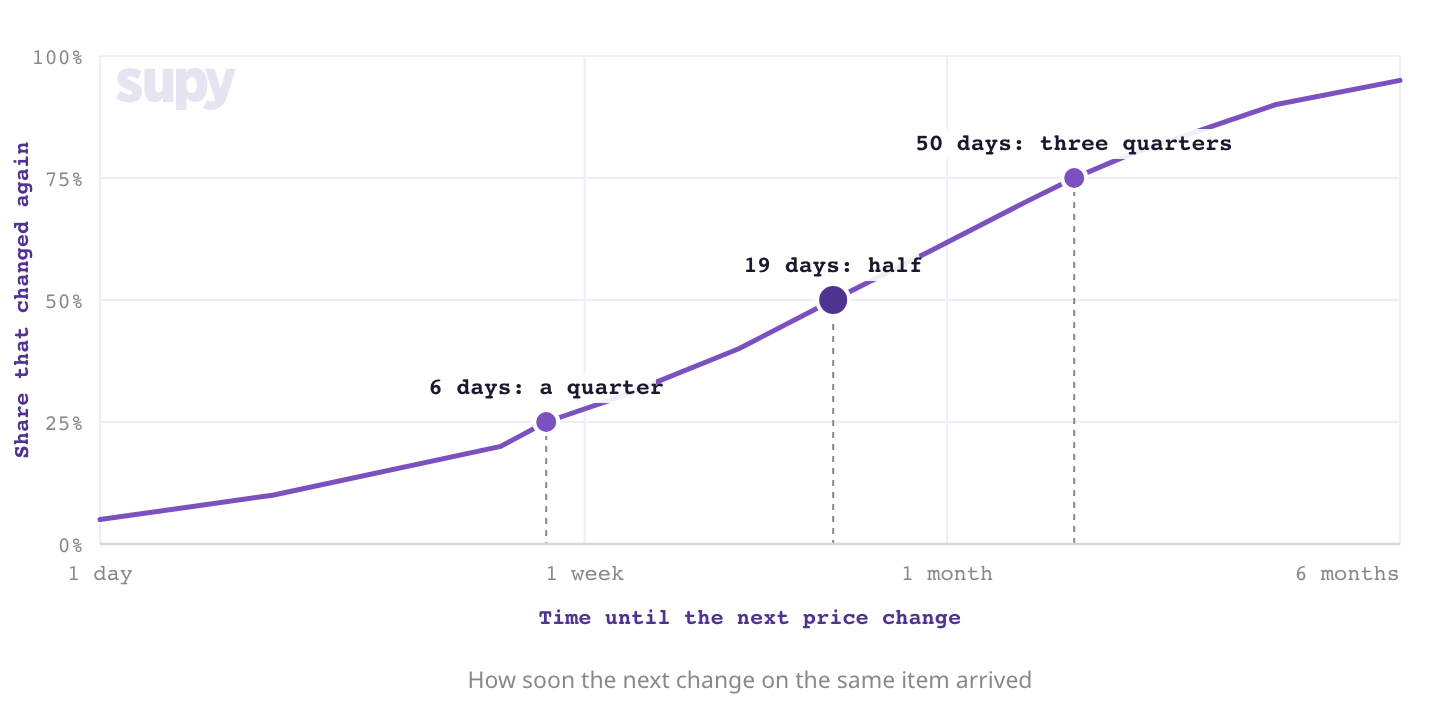
A supplier price lasts about 19 days before it changes. Half the time it changes again within three weeks, so last month’s cost sheet is already out of date.
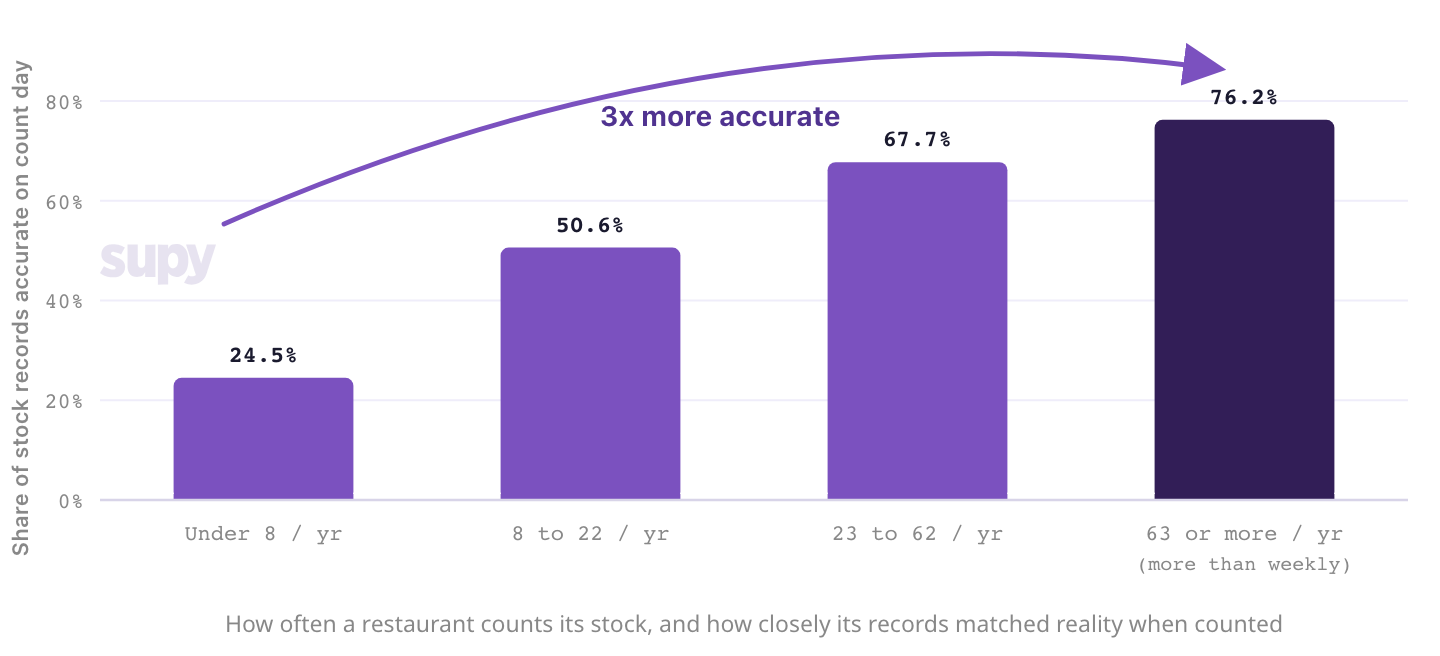
Restaurants that count stock weekly have 3x more accurate cost data than those that count just a few times a year.
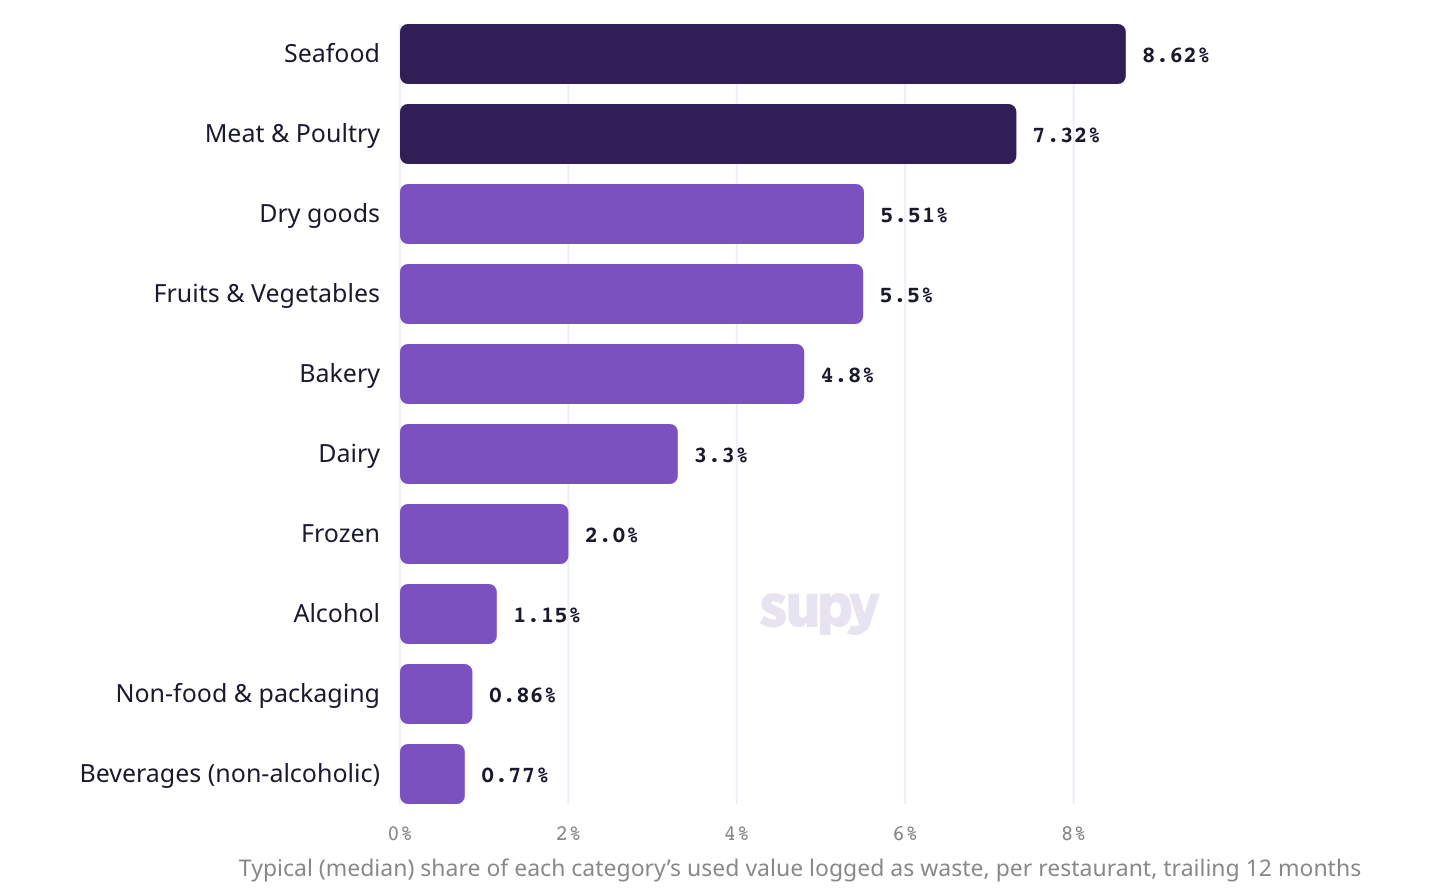
The more expensive the ingredient, the more of it goes to waste. 8.6% of seafood and 7.3% of meat is thrown out.
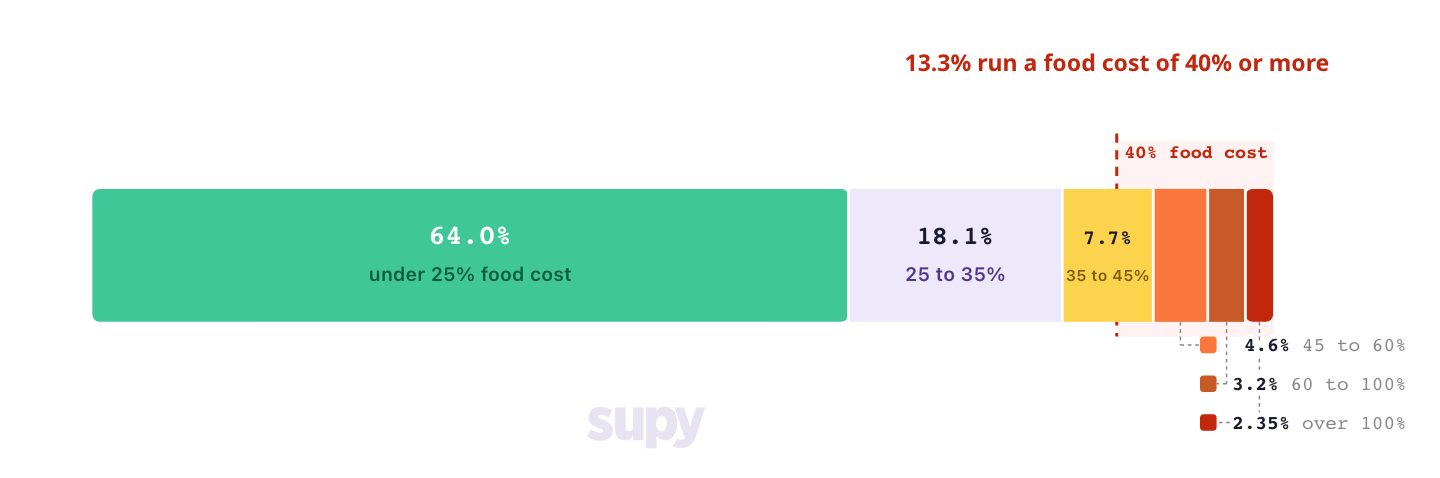
1 in 7 dishes is sold at a food cost above 40%. And 1 in 40 is sold at a loss on its ingredients alone.
Built from 27 million invoice lines, 66 million supplier price records and 296,092 stock counts, across 44 countries.
First blind spot: you cannot see what other restaurants pay suppliers
32%
is the typical gap between the cheapest and the most expensive buyer of the same product, from the same supplier, in the same month. On one product in six, someone pays at least double.
Across 446 products bought by at least five restaurants from the same supplier in the same month, the typical gap between the cheapest and most expensive buyer was 32%. On one product in six, someone was paying at least double the lowest price for the exact same item.
On one product in six, someone pays at least double for the very same item
Embed this chart
Free to use with attribution. Paste this into your page.
Surprisingly, this was not explained by purchasing volume: buying more did not reliably win a better price, and the bigger buyer paid less only about half the time. The largest gaps were on ambient goods with many suppliers, making those categories the biggest negotiation opportunity. So if you only ever check a handful of items, start where the gap is biggest: that is where the savings are hiding.
Widest price spreads: check these first
1. Bakery
2. Dry goods & staples flour, rice, oil, sauces
3. Beverages
Tightest: the market rate is the rate
1. Frozen
2. Chicken
3. Fruit & vegetables
Second blind spot: the price you paid yesterday is already old
19 days
is the median time between one supplier price change and the next. A quarter change again within 6 days, so last month’s cost sheet is already out of date.
Ingredient prices do not just change between contracts, they often change within the same month. Once a supplier price changes, half the time it changes again within 19 days, so menus and supplier agreements can quietly go out of date and operators end up deciding on old pricing. Nor does every market change together: over the year to July 2026, the same basket of twenty-two everyday ingredients cost 11.7% more in the UAE and 0.4% more in the UK.
Once a supplier price changes, half the time it changes again within 19 days
Embed this chart
Free to use with attribution. Paste this into your page.
For multi-site restaurant groups, the challenge is not tracking every product, it is knowing where prices are changing so procurement effort is focused where it matters most. That is exactly what the Restaurant Ingredient Weather Report is designed to do: each month it highlights which markets and product categories are changing most, helping operators prioritise negotiations and re-pricing before those changes show up in their P&L.
Third blind spot: invoice mismatches hide in plain sight
22.7%
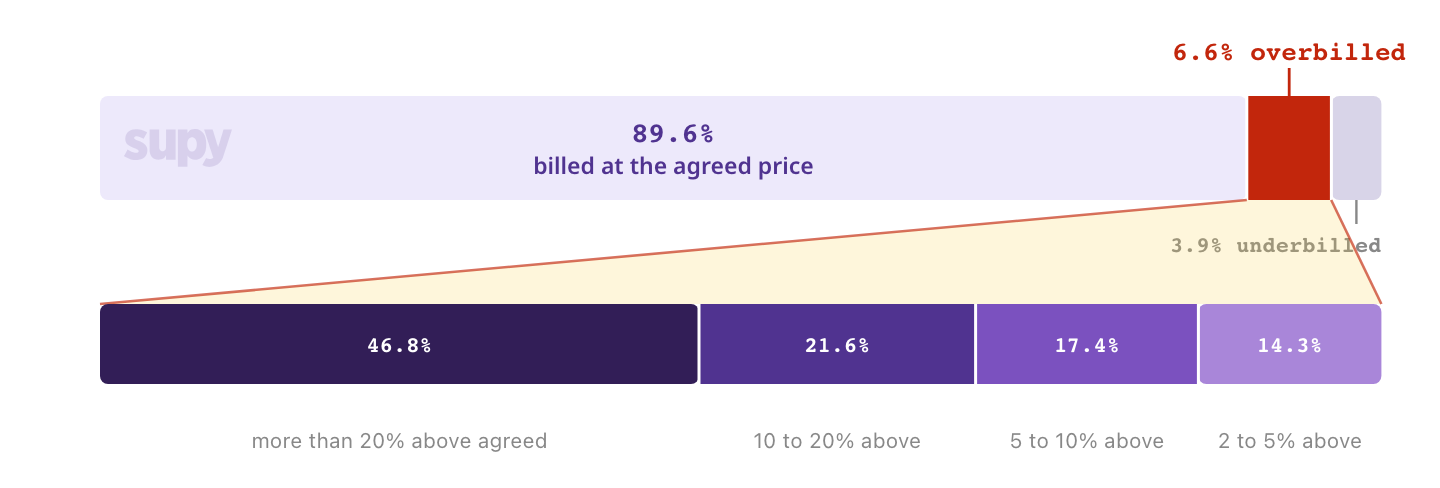
of invoices carry at least one line billed at a price the restaurant never agreed. Across 6.43 million lines, 6.6% were overbilled against 3.9% underbilled.
Nearly one in four invoices (22.7%) contains at least one line billed at a price the restaurant never agreed. While most invoice lines are correct, that is exactly why the incorrect ones are so easy to miss. Across 6.43 million invoice lines, 6.6% were overbilled against 3.9% underbilled, and almost half of the overbilled lines were more than 20% above the agreed price.
Nearly half of overbilled invoice lines are 20%+ over the agreed price
Embed this chart
Free to use with attribution. Paste this into your page.
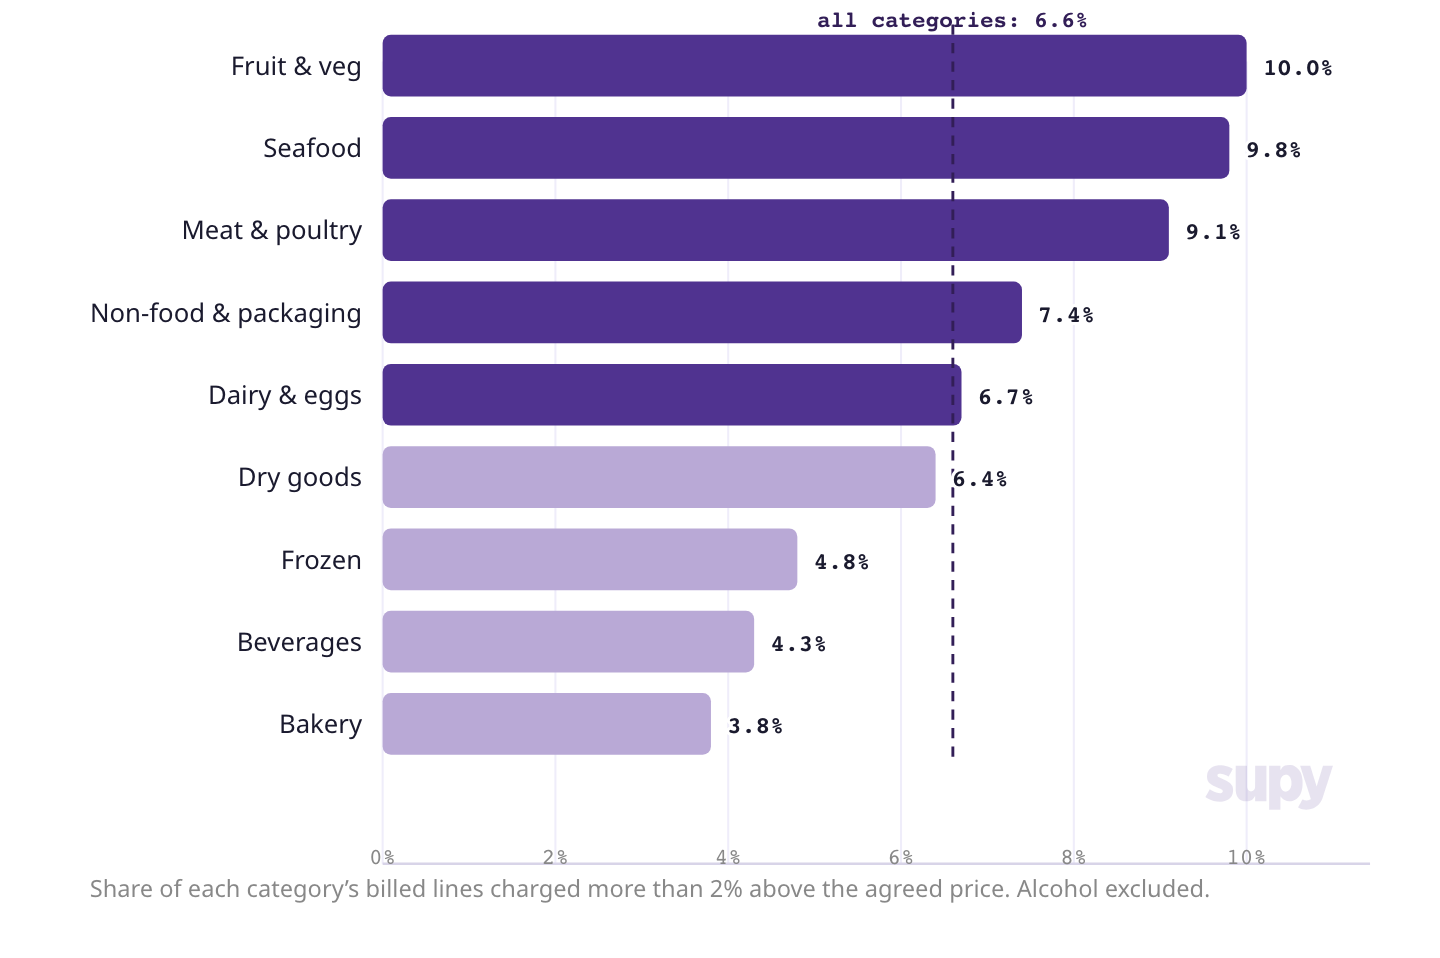
Overbilling is not evenly spread across the invoice. It is far more common on fresh ingredients, where supplier prices change most frequently. Fruit and vegetables, seafood, and meat and poultry all exceed the average overbilling rate, making them the first lines to check on an invoice. Fresh produce is the sharpest example. It is the most overbilled category of all, and it is also one of the categories where the first blind spot found the least room to negotiate, because on fresh produce the market rate really is the market rate. So it is where a restaurant has least to win by haggling and most to win by checking the bill: an agreed price on an item that changes daily is out of date almost as soon as it is set.
Fresh ingredients are overbilled the most
Share of each product category’s lines billed above the agreed price, against the 6.6% average across all categories.
Embed this chart
Free to use with attribution. Paste this into your page.
The challenge is that manual checking does not scale. A typical invoice can contain hundreds of lines, with only a small percentage needing attention. Rather than reviewing every line, operators should automatically compare billed prices against agreed supplier prices and only investigate the exceptions. That allows teams to recover margin at the point of payment, while spending their time where it creates the greatest value.
more accurate stock records for restaurants counting more than weekly than for those counting fewer than eight times a year: records matched reality 76.2% of the time against 24.5%.
Your food cost is only as accurate as the stock records it is based on, and those records drift further from reality the longer they go unchecked. Restaurants counting stock fewer than eight times a year had inventory records that matched reality just 24.5% of the time, compared with 76.2% for those counting weekly.
Count weekly and your records get 3x more accurate
Share of items where the stock record matched what was actually on the shelf, grouped by how often a restaurant counts.
Embed this chart
Free to use with attribution. Paste this into your page.
More frequent counts do more than improve accuracy: they make variance visible, the gap between what you should have used and what you actually did, so the waste, over-portioning and process issues behind it can finally be seen and worked on. That does not mean counting every item every week. The smart approach is to count high-value and high-risk ingredients most often, and check lower-risk items less frequently. The closer your actual stock matches your records, the closer your actual food cost stays to your theoretical food cost, so you can spot operational problems and protect your target margins.
Fifth blind spot: the money leaks where you can least afford it
8.6%
of the seafood a typical restaurant buys is thrown away, the highest wastage of any category. Meat and poultry follow at 7.3%, soft drinks at under 1%.
Waste is not spread evenly across the kitchen, it is concentrated in the ingredients that cost the most. Seafood had the highest recorded waste at 8.6% of value used, followed by meat and poultry at 7.3%, while lower-value categories such as soft drinks recorded less than 1%.
The most expensive ingredients are wasted the most
Recorded waste as a share of each category’s used value, for the typical restaurant.
Embed this chart
Free to use with attribution. Paste this into your page.
This means the biggest waste-control opportunities come from focusing operational controls on high-value ingredients, through better portioning, stock counting, production planning and waste logging, rather than trying to optimise every category equally. And because this analysis only includes waste that was actually recorded, the true cost of waste, and the opportunity to recover margin, is almost certainly even higher.
“The typical restaurant loses 8.6% of its seafood to the bin. One site in four loses 14% or more of its meat and produce.”
Sixth blind spot: profitable dishes do not stay profitable forever
1 in 7
dishes is sold at a theoretical food cost of 40% or more, and 1 in 40 loses money on its ingredients alone.
One in seven dishes (13.3%) is being sold at a theoretical food cost above 40%, while one in forty (2.35%) is sold at a theoretical loss on ingredients alone. As ingredient prices change over time, recipes become more expensive to produce, but menu prices often stay the same. The result is that dishes which were once comfortably profitable can gradually drift beyond their target food cost without anyone noticing. Regular recipe costing helps operators spot these changes early, giving them the opportunity to adjust menu prices, refine recipes, negotiate better supplier pricing or optimise the menu mix before margins are affected.
1 dish in 7 runs a food cost of 40% or more, and 1 in 40 loses money
Embed this chart
Free to use with attribution. Paste this into your page.
These figures are a best-case scenario because they only measure theoretical food cost, the cost of the recipe on paper. They do not include additional margin leakage from waste, over-portioning or stock variance covered in the previous blind spots. In practice, the true cost of serving many dishes will be higher. The value is not simply knowing which dishes have drifted beyond target, it is having time to take action before those margin losses become permanent.
Seven practical actions to reduce margin blindness
The six blind spots in this report all point to the same conclusion: margins do not disappear because of one big mistake, they erode through small gaps that go unnoticed. The good news is that most of them can be reduced without changing suppliers, increasing spend or introducing new processes. The biggest gains come from measuring the numbers that matter, then acting on them consistently. Here are seven practical places to start.
1
Benchmark your 20 highest-spend products. Pull the 20 products you spend the most on and obtain at least one alternative quote for each. Buying more does not win you a better price, which is exactly why your biggest lines are worth checking. The typical gap between buyers of the same product is 32% within a single month, and that gap costs you most where you buy most. Start with the ambient goods on the list, because that is where the gaps run widest.
2
Keep recipe costs current and review prices when margins drift. Update recipe costs whenever supplier prices change. Rather than changing menu prices constantly, set a target food cost or margin threshold that triggers a review. If a dish moves outside that range, decide whether to adjust the price, refine the recipe, negotiate supplier costs or accept the lower margin.
3
Count your highest-risk inventory more often. The more frequently you count, the more accurate your inventory records become. Focus first on high-value and high-variance ingredients such as proteins, where accurate stock records have the biggest impact on food cost and margin.
4
Focus your effort where prices are actually changing. Use the Restaurant Ingredient Weather Report to identify which markets and product categories are changing most. Concentrate negotiations and repricing efforts where prices have changed, rather than reviewing everything equally.
5
Prioritise controls on high-value ingredients. Seafood and meat generate the highest waste costs, so that is where operational controls deliver the greatest return. Tighten portion control, improve production planning, monitor waste consistently and investigate unusual losses.
6
Verify invoice prices against agreed supplier prices. Before approving invoices, compare billed prices against the prices you have agreed with suppliers, particularly on fresh produce, seafood and meat, where discrepancies occur most often. Where possible, automate this process and only investigate exceptions.
7
Regularly review the profitability of your best-selling dishes. Recost your most popular menu items using today’s ingredient prices. Identifying dishes that have drifted beyond their target food cost gives you the opportunity to adjust pricing, recipes or sourcing before margins are affected.
None of these actions requires major operational change. They simply replace assumptions with measurement, helping operators spot margin leakage earlier and focus their effort where it will have the greatest impact.
Questions
The findings, question by question
How often are restaurant invoices billed at the wrong price?
Nearly one in four restaurant invoices (22.7%) contains at least one line billed at a price the restaurant never agreed, according to Supy’s analysis of 1,265,531 invoices and 6,426,500 invoice lines in 2026. At line level, 6.6% of lines were billed above the agreed price and 3.9% below it.
How much can two restaurants pay for the same product?
Restaurants buying the same product from the same supplier in the same month pay prices that differ by 32% between the cheapest and the most expensive buyer, according to Supy’s analysis of 446 matched products in the 12 months to July 2026. On one product in six (17.5%), someone pays at least double the lowest price.
Does buying in higher volume win a restaurant a better price?
Not reliably. Across 880 products matched by supplier and country, Supy found the highest-volume buyer paid less than the lowest-volume buyer on 49.7% of products, paid more on 31.2%, and paid the same on 19.1%. Volume discounts settled off-invoice are invisible to this comparison.
How often do restaurant supplier prices change?
Half of supplier list-price changes are followed by another change within 19 days, and a quarter within 6 days, according to Supy’s analysis of 66 million supplier price records from July 2024 to July 2026. These are supplier list prices, not necessarily what a contracted customer pays.
How accurate are restaurant stock records?
Restaurants counting stock fewer than 8 times a year had records that matched the shelf 24.5% of the time on count day, against 76.2% for those counting more than weekly, according to Supy’s analysis of 610 restaurant businesses. That is roughly three times more accurate. It is an association, not a controlled experiment.
Which restaurant ingredients are wasted the most?
Seafood records the highest waste of any category at 8.6% of the value used by the typical restaurant, followed by meat and poultry at 7.3%, according to Supy’s analysis of recorded waste across 44 countries. Beverages record under 1%. Waste that is never logged never appears, so these rates are floors.
What share of restaurant dishes are sold at a high food cost?
One dish in seven (13.3%) is sold at a theoretical food cost of 40% or more, and one in forty (2.35%) is sold at a loss on its ingredients alone, according to Supy’s analysis of 118,913 dishes sold across 345 restaurant businesses on 15 June 2026. Theoretical food cost is a floor; the actual plate cost is higher.
Which ingredients are most often billed above the agreed price?
Fresh ingredients. Fruit and vegetables are billed above the agreed price on 10.0% of lines, seafood on 9.8% and meat and poultry on 9.1%, against a 6.6% rate across all categories, according to Supy’s analysis of 6,426,500 invoice lines in 2026. Ambient goods run at 4 to 5%.
What is margin blindness?
Margin blindness is the gap between the numbers a restaurant runs on and the numbers that are actually true. The term was coined by Supy in The Spread (2026), which sets out six blind spots: the price gap, the reprice clock, stock count drift, waste concentration, invoice mismatches and menu drift.
Appendix
The data tables behind every claim
Every number in this report comes from real, aggregated activity on the Supy platform, across the UK, Australia, the UAE, Saudi Arabia and the wider Gulf: 66 million supplier price records, 27 million invoice and goods-received lines, and hundreds of thousands of stock counts. Figures are medians, not averages, with obvious data errors removed first, and no individual business, supplier or price is published.
How big the price gap is, across all 880 matched products (Table A)
Gap between cheapest and most expensive buyer
Products
Share
0 to 10%
90
10.2%
10 to 20%
99
11.2%
20 to 35%
157
17.8%
35 to 50%
93
10.6%
50 to 100%
194
22.0%
100% or more
247
28.1%
880 products, 5 or more businesses each, same supplier and country, 12 months to July 2026. Compares actual paid prices; cannot see contract terms or off-invoice rebates.
The same-month price gap behind the 32% headline, across 446 contemporaneous matches (Table A2)
Gap between cheapest and most expensive buyer
Products
Share
0 to 10%
77
17.3%
10 to 20%
72
16.1%
20 to 35%
91
20.4%
35 to 50%
44
9.9%
50 to 100%
84
18.8%
100% or more
78
17.5%
446 products, 5 or more businesses each, same supplier, country and calendar month, 12 months to July 2026. Median gap 31.9%, shown as 32%. Same construction and exclusions as Table A.
Does buying more get you a better price? Biggest vs smallest buyer of each product (Table B)
Outcome
Share of products
Biggest buyer paid less than the smallest
49.7%
Biggest buyer paid more than the smallest
31.2%
Paid the same
19.1%
Highest-volume versus lowest-volume buyer of each matched product, on median paid price. Volume discounts negotiated off-invoice are invisible to this comparison.
Which ingredient families have the widest price spread, and which the tightest (Table C)
Rank
Ingredient family
Median spread across its matched products
Matched products
1
Bakery
138.1%
5
2
Dry goods & staples
71.4%
98
3
Beverages
61.6%
13
4
Packaging & disposables
60.4%
16
5
Dairy & eggs
60.0%
98
6
Fruit & vegetables
54.3%
184
7
Chicken
40.5%
5
8
Frozen
36.2%
6
Median of per-product spreads within each family, like-for-like by construction. Small-base families (Bakery, Chicken, Frozen) are indicative. Absolute prices are not published.
How quickly a changed list price changed again (Table D)
Share of price changes
Next change came within
25%
6 days
50%
19 days
75%
50 days
90%
112 days
95%
185 days
Genuine list-price changes, July 2024 to July 2026. Supplier list prices, not necessarily what a contracted customer pays. Describes the tempo of the items that change, not every item.
How closely stock records match reality, by counting habit (Table E)
Stock counts per year
Records right on count day (average)
Restaurant businesses
Under 8
24.5%
144
8 to 22
50.6%
157
23 to 62
67.7%
155
63 or more (more than weekly)
76.2%
154
Accuracy measured on count days only, bounded 0 to 100%, taken as each business's median then averaged per tier. 610 of the 762 businesses recording counts had enough recent count history and measurable accuracy data to include; the platform total is 2,986 businesses. An association, not a controlled experiment: part of the pattern is mechanical, because records drift further the longer they go unchecked.
The waste league: recorded waste by category, after cleanup (Table F)
Category (merged)
Typical business (median)
One business in four (75th percentile)
Businesses
Seafood
8.62%
12.61%
31
Meat & Poultry
7.32%
14.25%
75
Dry goods
5.51%
13.12%
118
Fruits & Vegetables
5.5%
14.07%
86
Bakery
4.8%
13.06%
59
Dairy
3.3%
10.04%
112
Frozen
2.0%
4.71%
43
Alcohol
1.15%
2.92%
67
Non-food & packaging
0.86%
3.03%
78
Beverages (non-alcoholic)
0.77%
3.27%
299
Recorded waste as a share of each category's used value (waste + sales at theoretical cost), per business, trailing 12 months. Category names merged across accounts into ten standard groups (for example, five spellings of Fruits & Vegetables). Median across businesses, minimum 30 businesses per category. Waste that is never logged never appears here, so low categories, frozen especially, are floors rather than truths. Generic catch-all categories (for example "Food", "General") could not be assigned and are excluded.
How often the billed price matches the agreed price (Table G)
Measure
Value
Basis
Invoices with at least one mismatched line
22.7%
1,265,531 invoices; overbill 16.2%
Invoice lines checked
6,426,500
invoice + consolidated-invoice, diff bounded −95% to +500%
Billed within ±2% of agreed price
89.6%
line level
Billed exactly at agreed price
83.0%
line level
Overbilled (more than 2% above agreed)
6.6%
line level
Underbilled (more than 2% below agreed)
3.9%
line level
Total mismatch (over + under)
10.4%
line level
Median line-level difference
0.0%
line level
Overbilled lines more than 20% above agreed
46.8% of overbilled lines
197,574 of 422,496
Typical site: mismatch rate
12.1% median, 21.4% p75
per-retailer, 548 retailers
Typical site: overbill rate
6.8% median (3.3% p25, 12.8% p75)
per-retailer, 548 retailers
Typical site: median overcharge when overbilled
18.6%
per-retailer, overbilled lines only
6,426,500 invoice lines; per-retailer figures from 548 retailers, 2026 year to date. Restaurant-level figures are per-retailer medians, describing the typical site. "Agreed price" is the expected catalogue or agreed rate, not a contract price; a mismatch is a divergence, not proof of error or intent.
How much of a menu is sold at a high food cost (Table H)
Measure
Value
Basis
Dishes sold at 40% or more theoretical food cost
13.3%
n=118,913 dish-day rows, 15 Jun 2026 (13.5% on 20 May 2026, n=119,786)
Dishes sold at over 100% food cost (loss on ingredients)
2.35%
2,797 of 118,913 rows
Median food cost, all sold dishes
20.2%
15 Jun 2026 read
Median food cost, low-margin band
67.8%
8,754 dishes in the low-margin band
Median food cost, high-margin band
16.5%
88,891 dishes in the high-margin band
Typical site: share of its sold dishes at 40% or more
11.7% median, 19.6% p75
per-retailer, 345 retailers
Dishes sold on a single trading day, 345 retailers, cross-checked on a second day. Theoretical food cost (recipe cost against menu price) is a floor; actual plate cost, with waste and over-portioning, is higher.
Where the overbilling concentrates, by product family (Table I)
Product family
Overbill (above agreed)
Underbill (below agreed)
Lines (n)
Fruit & veg
10.0%
3.9%
820,000
Seafood
9.8%
3.6%
44,000
Meat & poultry
9.1%
3.3%
95,000
Non-food & packaging
7.4%
5.6%
289,000
Dairy & eggs
6.7%
3.6%
149,000
Dry goods
6.4%
3.7%
341,000
Frozen
4.8%
3.1%
36,000
Beverages
4.3%
3.3%
634,000
Bakery
3.8%
1.7%
72,000
All categories (reference)
6.6%
3.9%
6,426,500
Same base as Table G; families with at least 20,000 lines shown. Rates are the frequency of overbilling, not its size. Alcohol is deliberately excluded as small and jurisdiction-sensitive.
What this report is built on (Table J)
Measure
Value
Supplier price records
66 million
Invoice and delivery lines
27 million
Markets
UAE, Saudi Arabia, UK, Australia, Qatar, Kuwait, Bahrain, Oman
.jpeg) "30 oder 300 Filialen – wir bleiben bei Supy. Wir wissen, dass es präzise ist, wir wissen, dass es funktioniert. So etwas gibt man nicht auf."
"30 oder 300 Filialen – wir bleiben bei Supy. Wir wissen, dass es präzise ist, wir wissen, dass es funktioniert. So etwas gibt man nicht auf." Restaurant-Marketing-Strategie: Was Multi-Standort-Betreiber tun, um Tische zu füllen – ohne Rabatte