.jpeg)


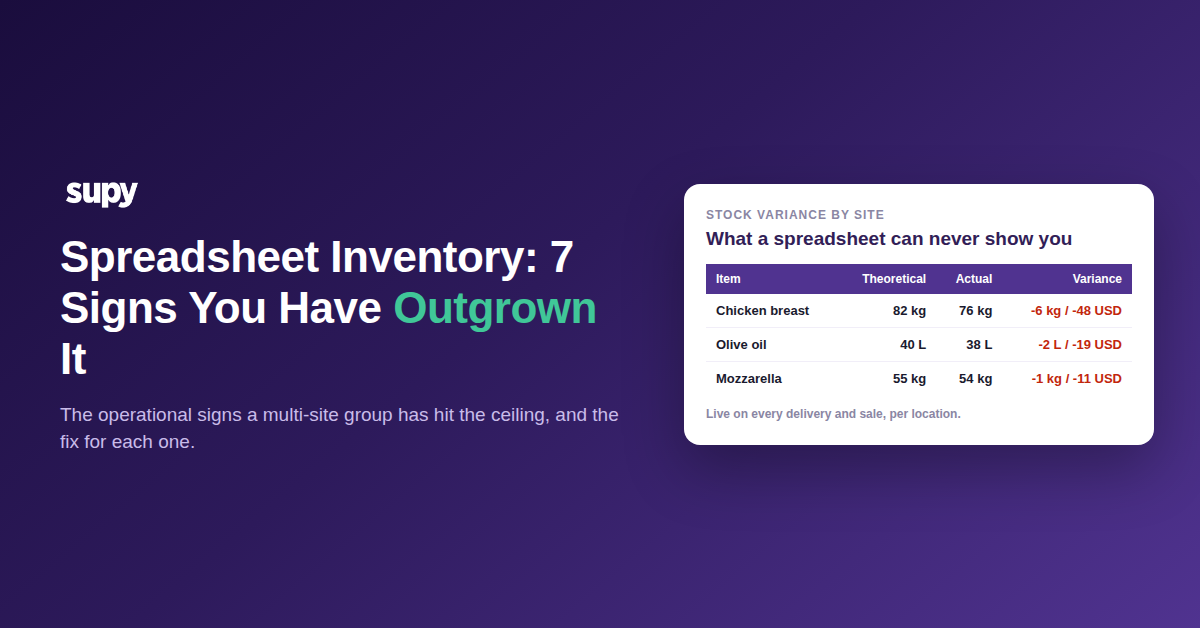
جداول البيانات والمخزون: 7 علامات تدل على أن مجموعة مطاعمك تجاوزتها
السبع علامات التي تدل على أن مجموعة مطاعمك تجاوزت جداول البيانات
تجتاز مجموعة المطاعم مرحلة إدارة المخزون عبر جداول البيانات حين تتوقف هذه الجداول عن وصف ما يوجد فعلياً في المنشأة: تتقادم بيانات الجردة، وتتأخر التكاليف أسابيع، ولا يتبع أي فرعين الأسلوب ذاته في تتبع المخزون. العلامات الواردة أدناه عملياتية لا شكلية، ولكل منها حل عملي لا مجرد تحذير.
اقرأها كقائمة تحقق. تتعرف معظم مجموعات الفروع المتعددة على خمسة من السبعة، وأي اثنتين منهما معاً كافيتان عادةً للقول إن جدول البيانات أصبح العائق الأول أمام تطور العمليات.
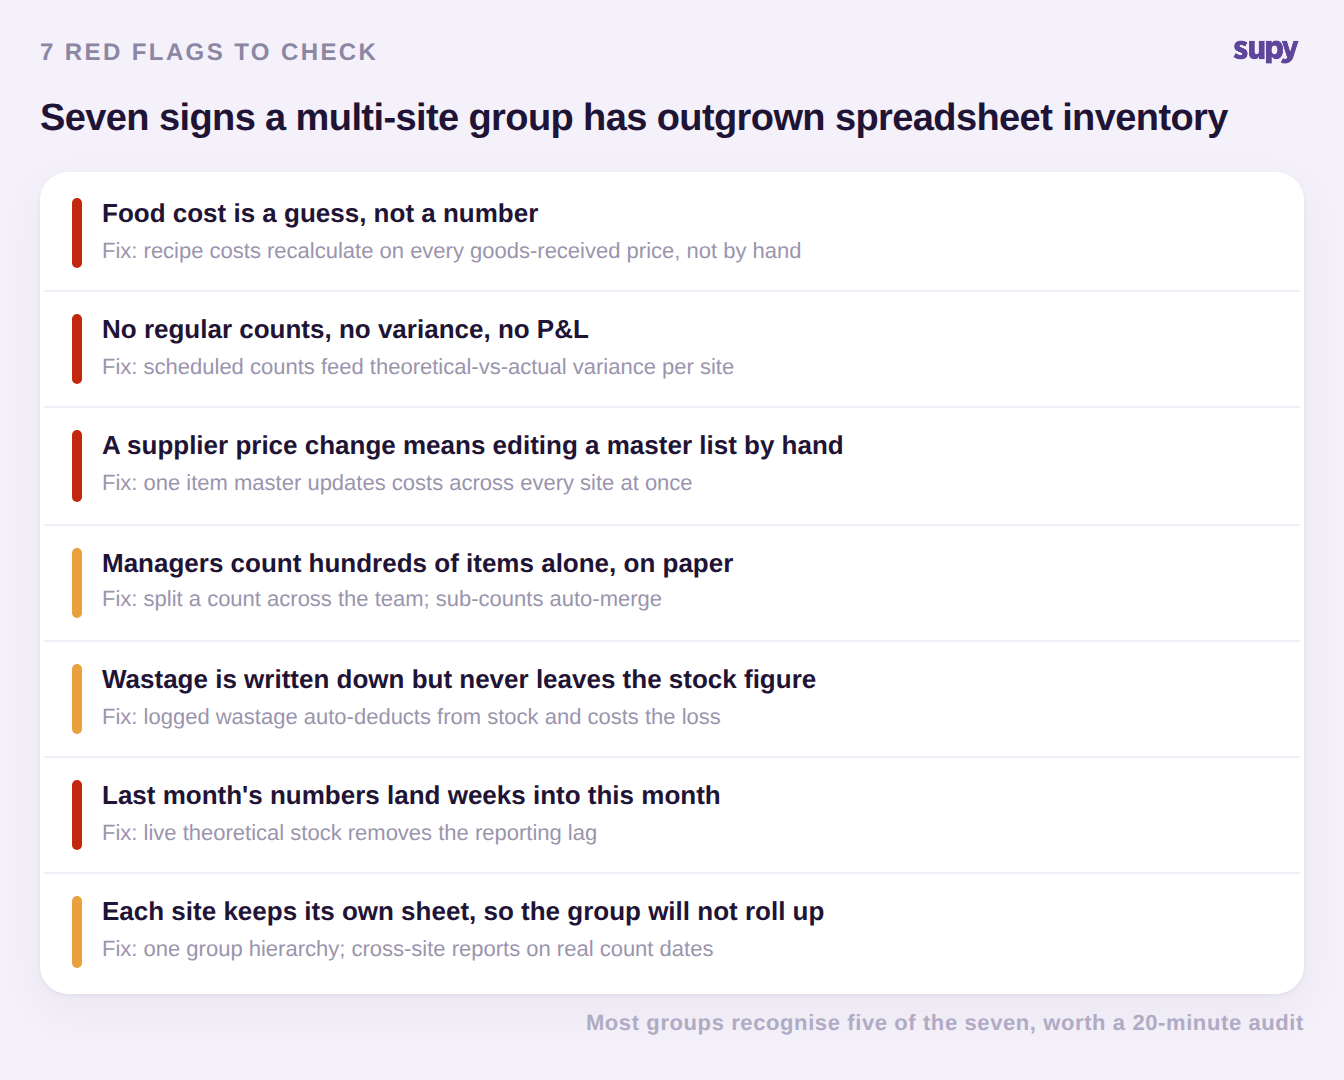
1. تكلفة الغذاء تخمين لا رقم. لا تتغير قائمة أسعار المكوّنات الرئيسية إلا حين يتذكر أحدهم إدخال سعر مورّد جديد، فتصبح تكاليف الوصفات خاطئة في اللحظة التي تصل فيها شحنة بسعر مختلف. الحل هو نظام يُعيد احتساب كل وصفة على أساس سعر استلام البضاعة الفعلي، بحيث تعكس تكلفة الغذاء ما دفعته فعلاً هذا الأسبوع لا ما دفعته آخر مرة عُدِّل فيها الجدول. إن أردت معرفة وضعك الراهن بسرعة، يمنحك حاسبة تكلفة الغذاء الرقم في دقائق.
2. لا توجد جردات منتظمة ولا تباين ولا قائمة أرباح وخسائر تثق بها. تشعر المجموعات في هذا الوضع بأن الأموال تتسرب لكنها لا تملك بيانات تحدد موضع التسرب. الحل هو جدول جردة دورية لكل موقع يُغذّي تقرير التباين بين المخزون النظري والفعلي، بحيث يصبح التسرب المشتبه به بنداً محدداً في موقع محدد بدلاً من مجرد حدس.
3. تغيير سعر المورّد يعني تعديل قائمة رئيسية يدوياً. حين تحتفظ كل علامة تجارية أو كيان بنسخته الخاصة من الكتالوج، يتحول تغيير سعر واحد إلى عشرات التعديلات اليدوية التي لا تكتمل أبداً. الحل هو قائمة أصناف رئيسية موحدة مشتركة على مستوى المجموعة، يحمل فيها كل مكوّن رموز المورّد وأحجام التعبئة والتكلفة مرة واحدة ويتحدث في كل مكان في آنٍ واحد. وهذه أيضاً البيانات الأجدر بالتنظيف قبل أي انتقال؛ اقرأ في مدونة سوبي: كيفية ترتيب بيانات قائمة الأصناف الرئيسية.
4. يجري المديرون جردات مئات الأصناف بمفردهم على الورق. حين يمشي موظف واحد بقائمة ورقية ليجرد من 300 إلى 400 صنف كل أسبوعين، تكون الجردات بطيئة ومتأخرة وسهلة التلاعب. الحل هو جردة يمكن توزيعها على الفريق، حيث يقتصر كل شخص على قسمه ويتم دمج الجردات الجزئية تلقائياً، بحيث تأخذ الجردة الكاملة جزءاً يسيراً من الوقت وكل بند موثق باسم من أجراه.
5. يُسجَّل الهدر لكنه لا يغادر أبداً رقم المخزون. سجل الهدر الذي لا يُخصم من المخزون مجرد يوميات لا أداة رقابة. الحل هو تسجيل الهدر صنفاً وسبباً في ثوانٍ، بحيث يُخصم كل إدخال من المخزون ويُحتسب الخسارة بسعر اليوم، فيظل رقم المخزون وأثر التكلفة كلاهما دقيقاً.
6. أرقام الشهر الماضي تصل في منتصف هذا الشهر. حين يستغرق الأمر ستة أسابيع لتصبح تكلفة البضاعة المباعة في فترة ما مرئية، يكون الشهر قد ضاع قبل أن يتمكن أحد من التصرف. الحل هو مخزون نظري يُحدَّث باستمرار من كل استلام بضاعة وكل مبيعة، مما يُزيل تأخير التقارير كلياً.
7. كل فرع يحتفظ بجدوله الخاص فلا تستطيع المجموعة التجميع. الأنماط المختلفة والعادات المختلفة لكل موقع تجعل الحصول على رؤية على مستوى المجموعة مستحيلاً دون يوم كامل من النسخ واللصق. الحل هو هيكل مجموعة واحد مع تقارير متقاطعة بين الفروع مرتبطة بتواريخ جردات المخزون الفعلية، بحيث يكون التجميع مجرد فلتر لا مشروعاً.
ما الذي يتغير يوم التحول عن جداول البيانات
الهدف من ترك جداول البيانات ليس الحصول على ملفات أكثر تنظيماً، بل أن تبدأ الأرقام في وصف العمليات كما هي في الوقت الفعلي. شيئان يقومان بالعمل الأكبر: قائمة أصناف رئيسية يشاركها جميع الفروع، ورقم مخزون نظري يتحدث عند كل استلام بضاعة وكل بيعة وصفة. معاً، يُحوّلان تأخير التقارير الممتد ستة أسابيع إلى عرض فوري لليوم ذاته.
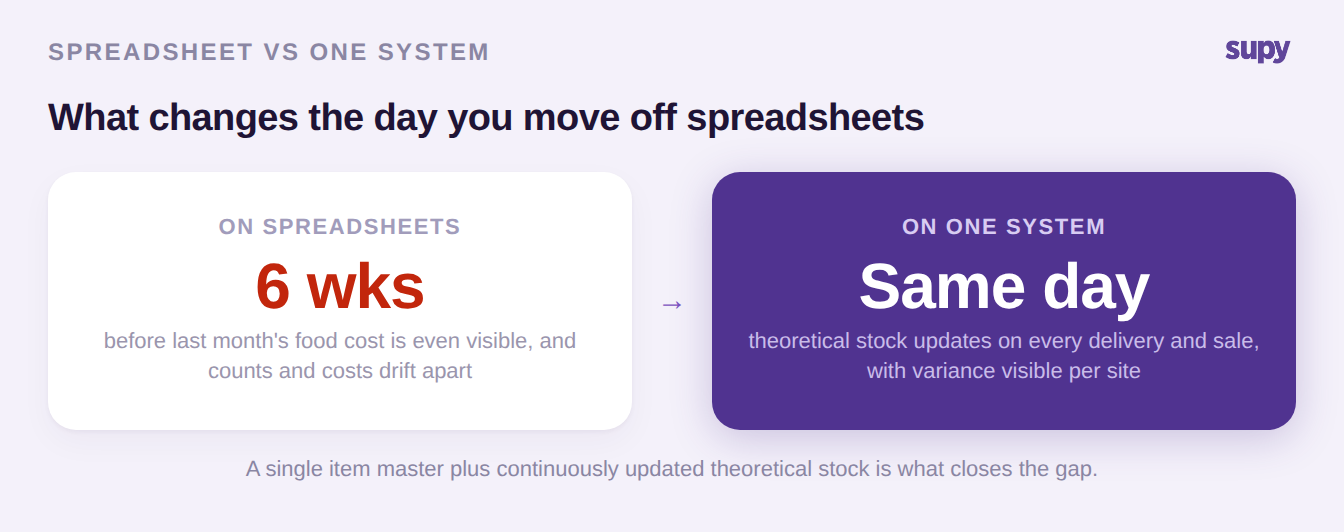
على هذا الأساس، تحل بقية العلامات من تلقاء نفسها. يُقاس التباين مقارنةً بالاستخدام المتوقع الفعلي لا بجدول بيانات متقادم، فيشير الفارق في التكلفة إلى مكوّن محدد في موقع محدد. تُجدوَل الجردات لكل فرع وتُوزَّع على الفريق. يُخصم الهدر المسجل في الميدان من المخزون تلقائياً ويُحتسب الخسارة. ولأن كل علامة تجارية أو كيان يقع في نقطة بيعه ضمن هيكل المجموعة الواحد، تسير التكاملات مع نقاط البيع والمحاسبة لكل موقع على حدة، ويبقى التقرير المتقاطع على بُعد فلتر واحد. منصة إدارة المخزون المتخصصة للمطاعم هي ما يحمل كل ذلك عوضاً عن جدول بيانات أكبر حجماً.
كيف تنتقل دون تعطيل العمل
الخطر في الانتقال ليس في البرنامج، بل في الإطلاق على مستوى المنشأة بالكامل مع كتالوج بيانات غير نظيف. تجنب ذلك بإثبات الإعداد في موقع نموذجي أولاً، وتنظيف قائمة الأصناف الرئيسية وتصنيفات المحاسبة قبل كل إطلاق، والبدء بالفروع المملوكة قبل الامتيازات حيث يجب كسب القبول لا فرضه.
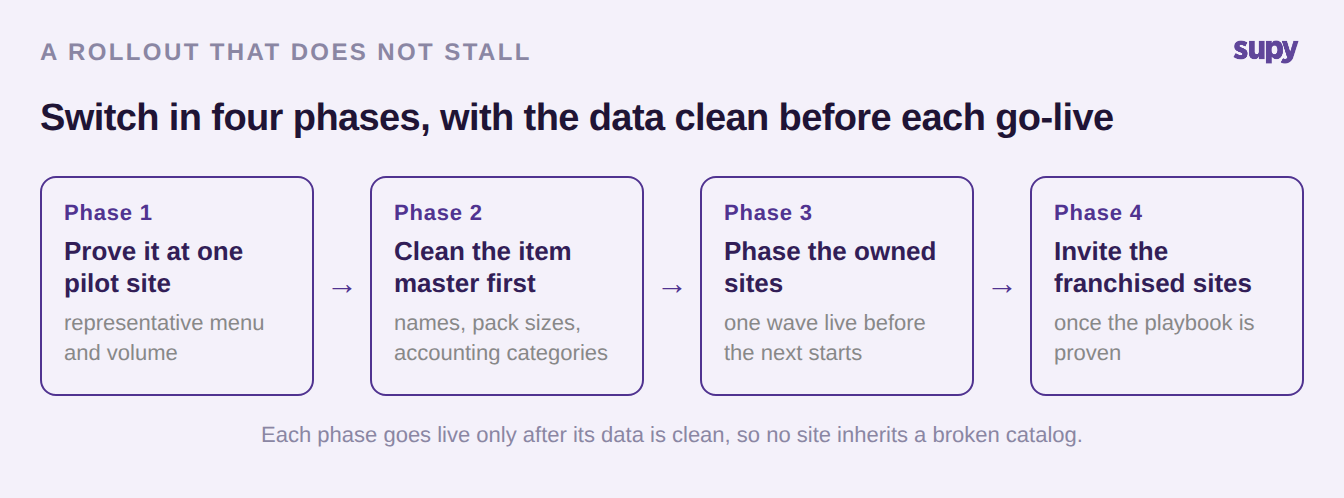
بهذه الطريقة، يصبح تحضير البيانات الذي كان يجعل جداول البيانات مرهقة مهمة تُنجز مرة واحدة لكل موقع، ويرث كل موقع جديد كتالوجاً نظيفاً بدلاً من ثغرات فريق آخر.
تدقيق سريع بنفسك: راجع العلامات السبع وضع إشارة على ما يحدث الآن. إن كنت قادراً على معالجة علامة واحدة فقط هذا الربع، ابدأ بقائمة الأصناف الرئيسية الموحدة، لأن العلامة 1 والعلامة 3 والعلامة 7 تعود جميعها إلى عدم امتلاكها، ومعالجتها تُزيل ثلاث مشكلات دفعة واحدة.