.jpg)


Manual vs Automated Inventory Variance Tracking: Where Spreadsheets Stop Working for Multi-Site Restaurants
What Inventory Variance Tracking Actually Measures
Every restaurant that tracks inventory variance is trying to answer one question: how much stock should we have used, versus how much we actually used, and what is the gap costing us? Answering it with a spreadsheet or with dedicated software does not change the question. It changes how fast you get the answer, how reliable that answer is, and whether it still works when you go from one kitchen to four. That is the real manual-versus-automated decision, and it is worth making deliberately rather than by default.
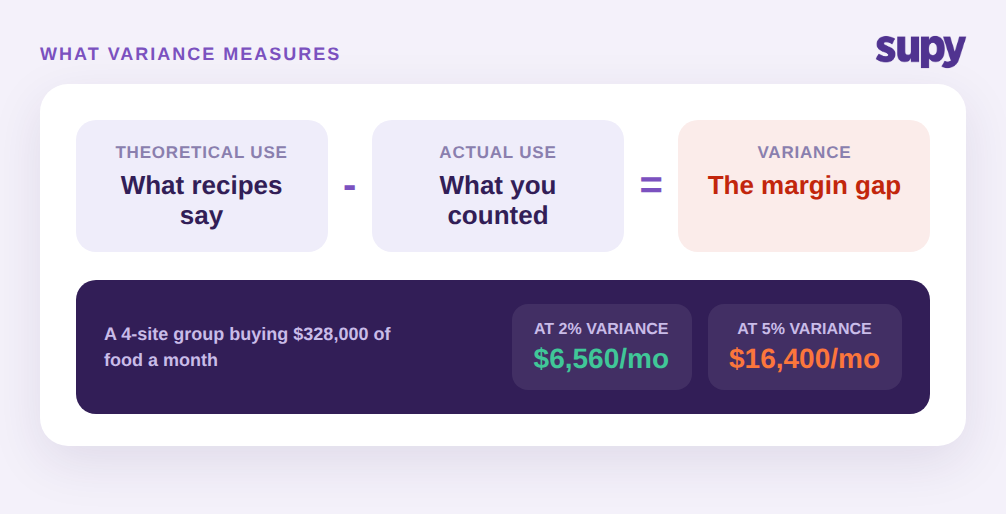
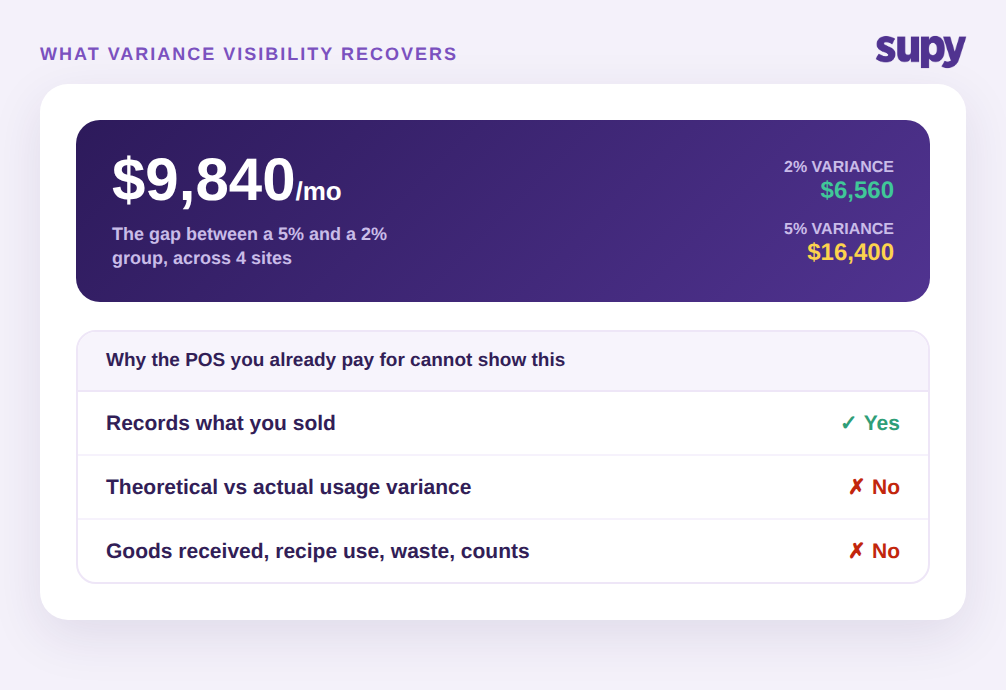
Variance tracking compares two figures. The theoretical figure is what your recipes say you should have consumed, given what you sold. The actual figure is what a physical count says you really consumed. Subtract one from the other and you get variance, usually expressed in units and in money, and often as a percentage of purchases. A group buying $328,000 of food a month across four sites and running a 2 percent variance is losing about $6,560 a month to spoilage, over-portioning, theft, and miscounts. At 5 percent that same group is losing $16,400. The roughly $9,840 difference is what better tracking is really about.
The mechanics are the same whether you use a spreadsheet or software, but both depend on one thing: a reliable baseline. You need a trustworthy record of stock in (goods received), stock out (recipe consumption tied to sales), purchases, and returns. Without that record there is no theoretical figure to measure against, and variance simply cannot be computed. One three-location group described its inventory as scattered across supplier chats and email, with no unified view of what came in, what went out, or what was returned. That group could count its shelves all day and still not know its variance, because it had nothing to compare the count to.
This is the part operators underestimate. Variance is not a report you generate at the end; it is the output of a chain that has to hold together every single day. If a delivery is received but never logged, if a recipe yield is wrong, if a return is handled over the phone and never recorded, the theoretical figure drifts from reality and the variance number inherits every one of those small errors. The tracking method you choose is really a question of how well that chain survives the pressure of a busy service across several sites.
Where Manual Spreadsheet Tracking Still Holds Up
Manual tracking is not wrong. For a single location with a few hundred active items and one person who owns the numbers, a spreadsheet can work well. If you receive goods carefully, keep recipe quantities current, and count on a consistent weekly schedule, the arithmetic is honest and cheap. Many strong operators started exactly here, and there is no reason to buy software to solve a problem you do not yet have.
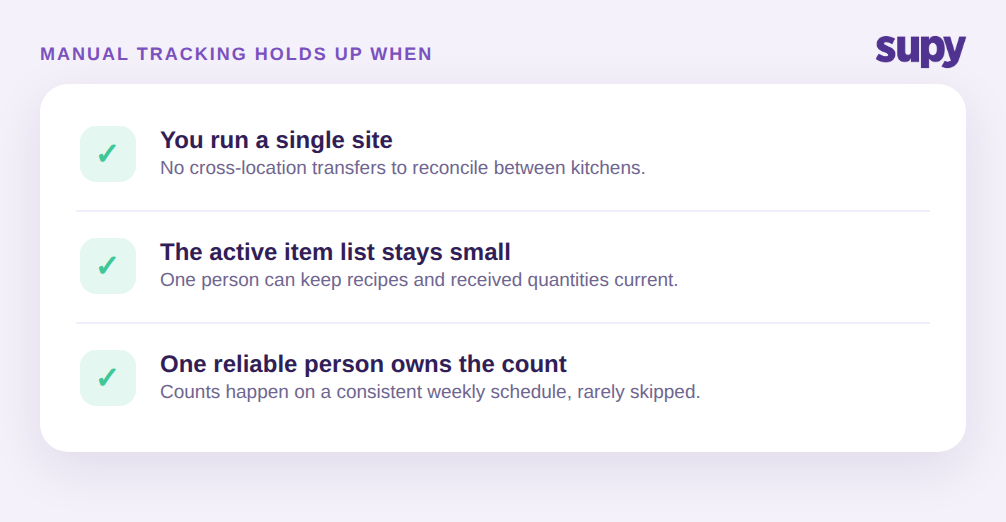
Manual tracking holds up when three conditions are true at once. First, the item count is small enough that one person can keep recipes and received quantities current without falling behind. Second, there is a single site, so there is no cross-location transfer to reconcile. Third, the person who maintains the sheet is consistent and rarely absent, because the whole model lives in their head and their formulas. Break any one of those conditions and the cracks start to show. Most multi-site groups break all three at the same time.
Where Manual Tracking Breaks Across Multiple Sites
The failure modes are specific, and operators describe them the same way again and again.
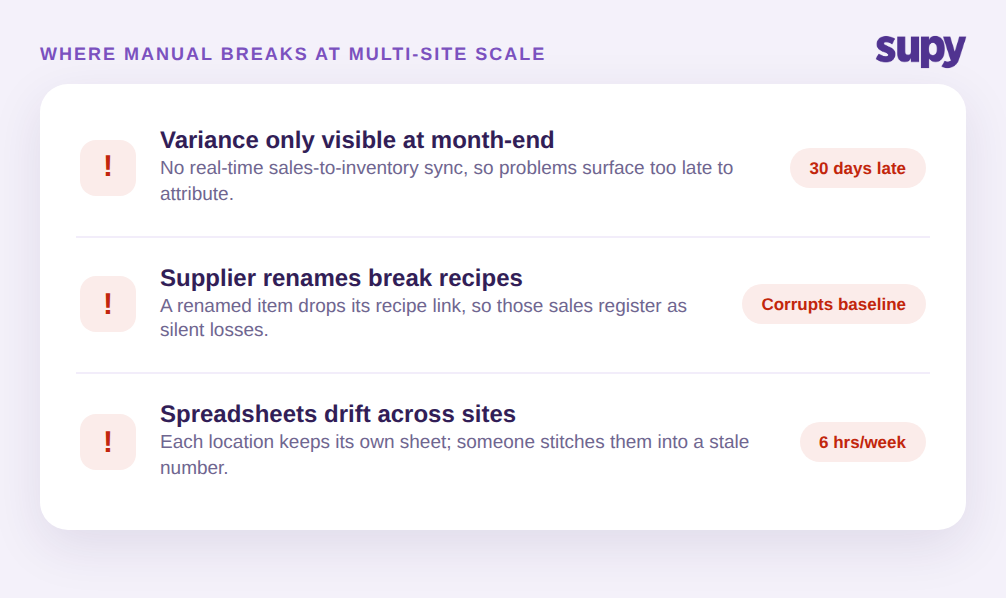
The first is timing. With no real-time link between sales and inventory, consumption variance is only visible at month-end. One four-location group's operations manager could only check stock-consumption variance once a month, which means a problem that started on the first is found on the thirtieth, thirty days too late to attribute to a shift, a supplier, or a dish. By then the trail is cold.
The second is data integrity. In the same group, when a supplier renamed an item, the recipe component linked to the old name silently disappeared, so those sales stopped depleting stock and registered as losses. A single rename quietly corrupts the theoretical figure, and the variance report inherits the error without flagging it.
The third is scale itself. A four-location group whose owner ran all inventory, weekly counts, goods receipt, and cost of goods sold in custom Excel found theoretical-versus-actual analysis practically impossible once item counts and sites grew. Every site keeps its own sheet, versions drift, and someone spends hours each week stitching them together into a number that is already stale when it lands. This is the point where measuring theoretical vs actual food cost variance by hand stops being a discipline and starts being a full-time job that still produces a figure nobody fully trusts.
How Automated Variance Tracking Works
Automated tracking changes one thing that fixes most of the failures above: the theoretical baseline maintains itself. Instead of rebuilding the expected-usage number by hand each period, the system keeps theoretical stock continuously current from every event that moves inventory.
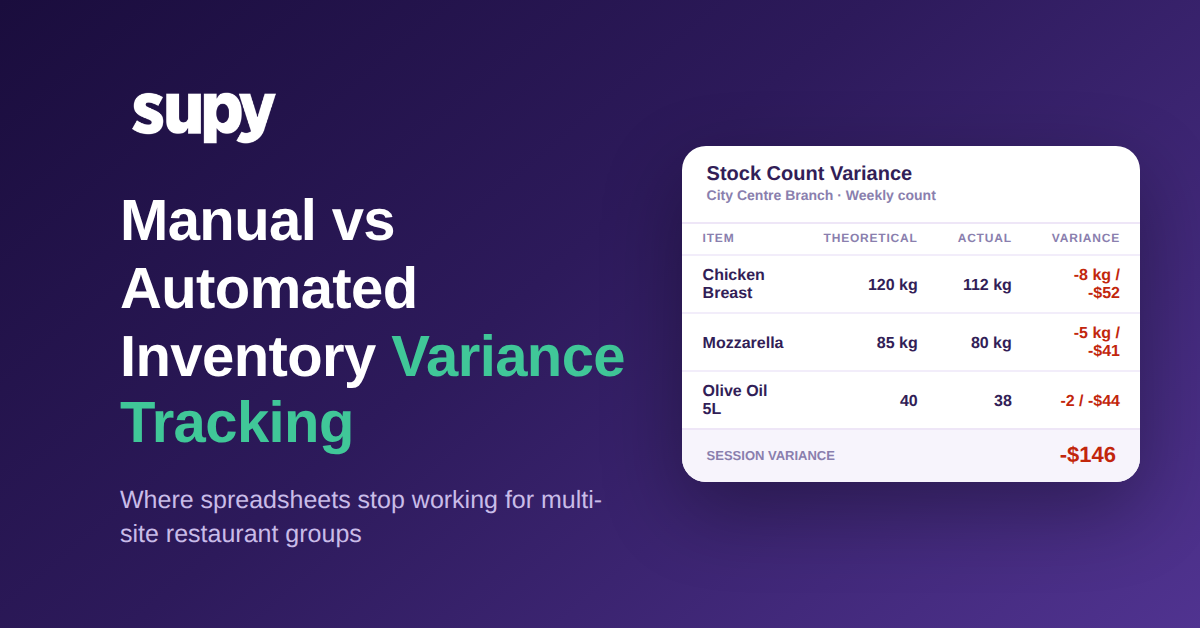
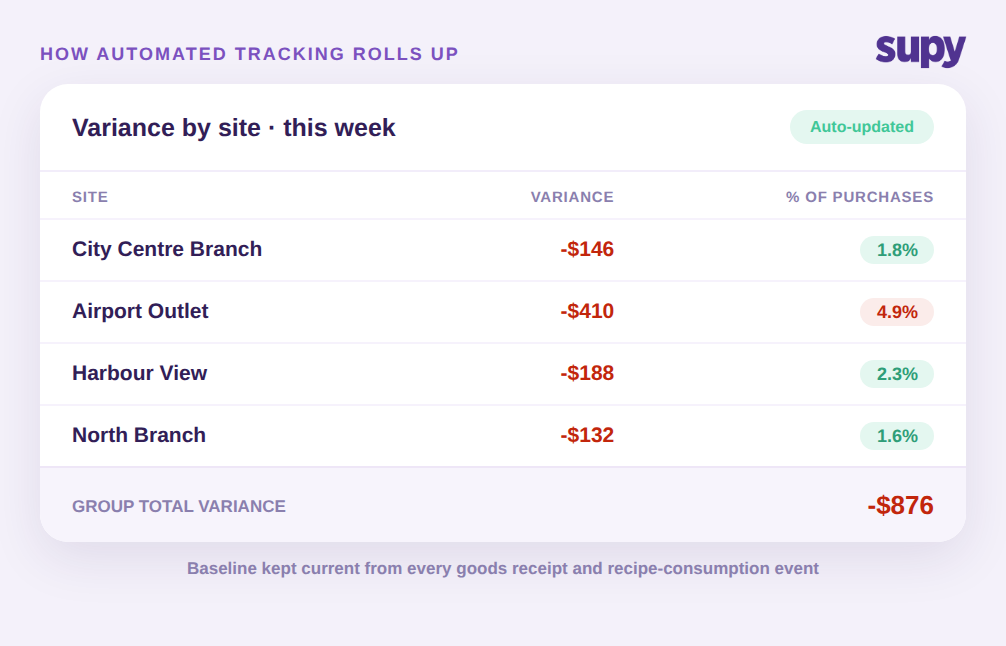
In practice that means three mechanisms working together. First, live stock visibility keeps theoretical stock up to date from every goods-receipt and every recipe-consumption event, with no manual sync, so the expected figure at count time reflects real activity rather than a stale opening number typed in weeks ago. Second, after a physical count, variance is calculated automatically against those expected system quantities and surfaced as a per-item report on web and mobile, so a manager can drill into the exact items that moved, rather than eyeball a wall of spreadsheet rows. A count session might show chicken breast down 8 kg and $52, mozzarella down 5 kg and $41, and a session total of about $146, each line traceable to a specific item.
Third, variance totals across every counted item roll up into a per-session summary, and those summaries roll up across sites, so a group operator gets a fast read on the financial impact at each location without totalling any sheets. Instead of four spreadsheets and a fifth to combine them, there is one view: City Centre Branch at 1.8 percent, Airport Outlet at 4.9 percent, Harbour View at 2.3 percent, and the group total in one place. That single view is what tells an operator, at a glance, which site to look at first this week.
The supplier-rename problem also goes away, because ingredients are managed as base items with supplier names linked underneath, so a rename updates the link instead of breaking the recipe. The count itself gets faster too, with reusable templates in shelf order and parallel counting, where several people count different sections at once and the results merge with attribution. Operators report this cuts count time by more than half, which matters because a count that is quick and consistent is a count that actually happens on schedule, and the schedule is what keeps the baseline honest. None of this removes the physical count. It removes the manual reconstruction of the number you are counting against.
The Cost Question: What Variance Visibility Actually Recovers
The objection is fair and it comes up early. One seven-location group's head of sales raised pricing before a full demo, comparing the cost of a dedicated variance system directly against the point-of-sale system they already pay for and asking what the difference really buys. It is the right question, and the answer is not a feature list.
A point-of-sale system tells you what you sold. It does not tell you what you should have used versus what you actually used, because it never sees goods received, recipe consumption, waste, or a physical count. That is a different data layer, and it is the layer variance lives in. So the comparison is not software versus POS. It is the recoverable margin in that $9,840-a-month gap between a 5 percent and a 2 percent group, against the cost of the tool that surfaces it. When variance is visible per item, per session, and per site within days instead of at month-end, the discrepancies become attributable, and attributable discrepancies are the ones you can actually close. The recovered points of food cost are the return, and for a multi-site group they usually dwarf the subscription.
There is a softer cost too. The manual model depends on one person and their formulas. When automated tracking owns the baseline, the number survives a resignation, an absence, and a bad week, which for a growing group is worth as much as the margin.
The decision comes down to a short, honest rule. Choose manual spreadsheet tracking when you run a single site with a manageable item list, count on a consistent schedule, and have one reliable person who owns the numbers. It is cheap, it is transparent, and it works until you outgrow it. Choose automated variance tracking when you operate more than one location, share suppliers or a central kitchen across sites, need variance visible in days rather than at month-end, or find that keeping recipes and counts current by hand has become a job in itself.
The clearest signal that you have crossed the line is simple to check: if your last variance number arrived weeks after the period it described, or if you could not fully explain it when it did, your baseline is no longer keeping up with your operation. That is the moment the method, not the effort, becomes the limiting factor. The first move is to pick one recent count and try to attribute its top three variance lines to a specific site, shift, or dish. If you can, your current method is holding. If you cannot, that is your answer. If you want to ground the concept first, our guide to restaurant inventory variance analysis walks through how the theoretical-versus-actual gap is isolated before you decide how to track it.