.jpg)


The Operator’s Guide to Reading a Restaurant P&L Like a Pro
.avif)
We sat down with Travis Fish - Group Operations Director at Comptoir Libanais and founder of Ops Club - to break down how he reads a P&L, and how he uses it to build sharper, more financially aware teams.
Most restaurant teams aren’t taught how to read a P&L.
Not properly.
You might get handed one once a month, glance at the bottom line, see if GP went down or labour went up, and move on.
But if you're running multiple sites - or scaling fast - that won’t cut it.
Because a P&L tells you what actually happened - not what you hoped would happen.
And if you’re not reading it properly, you’re flying blind.
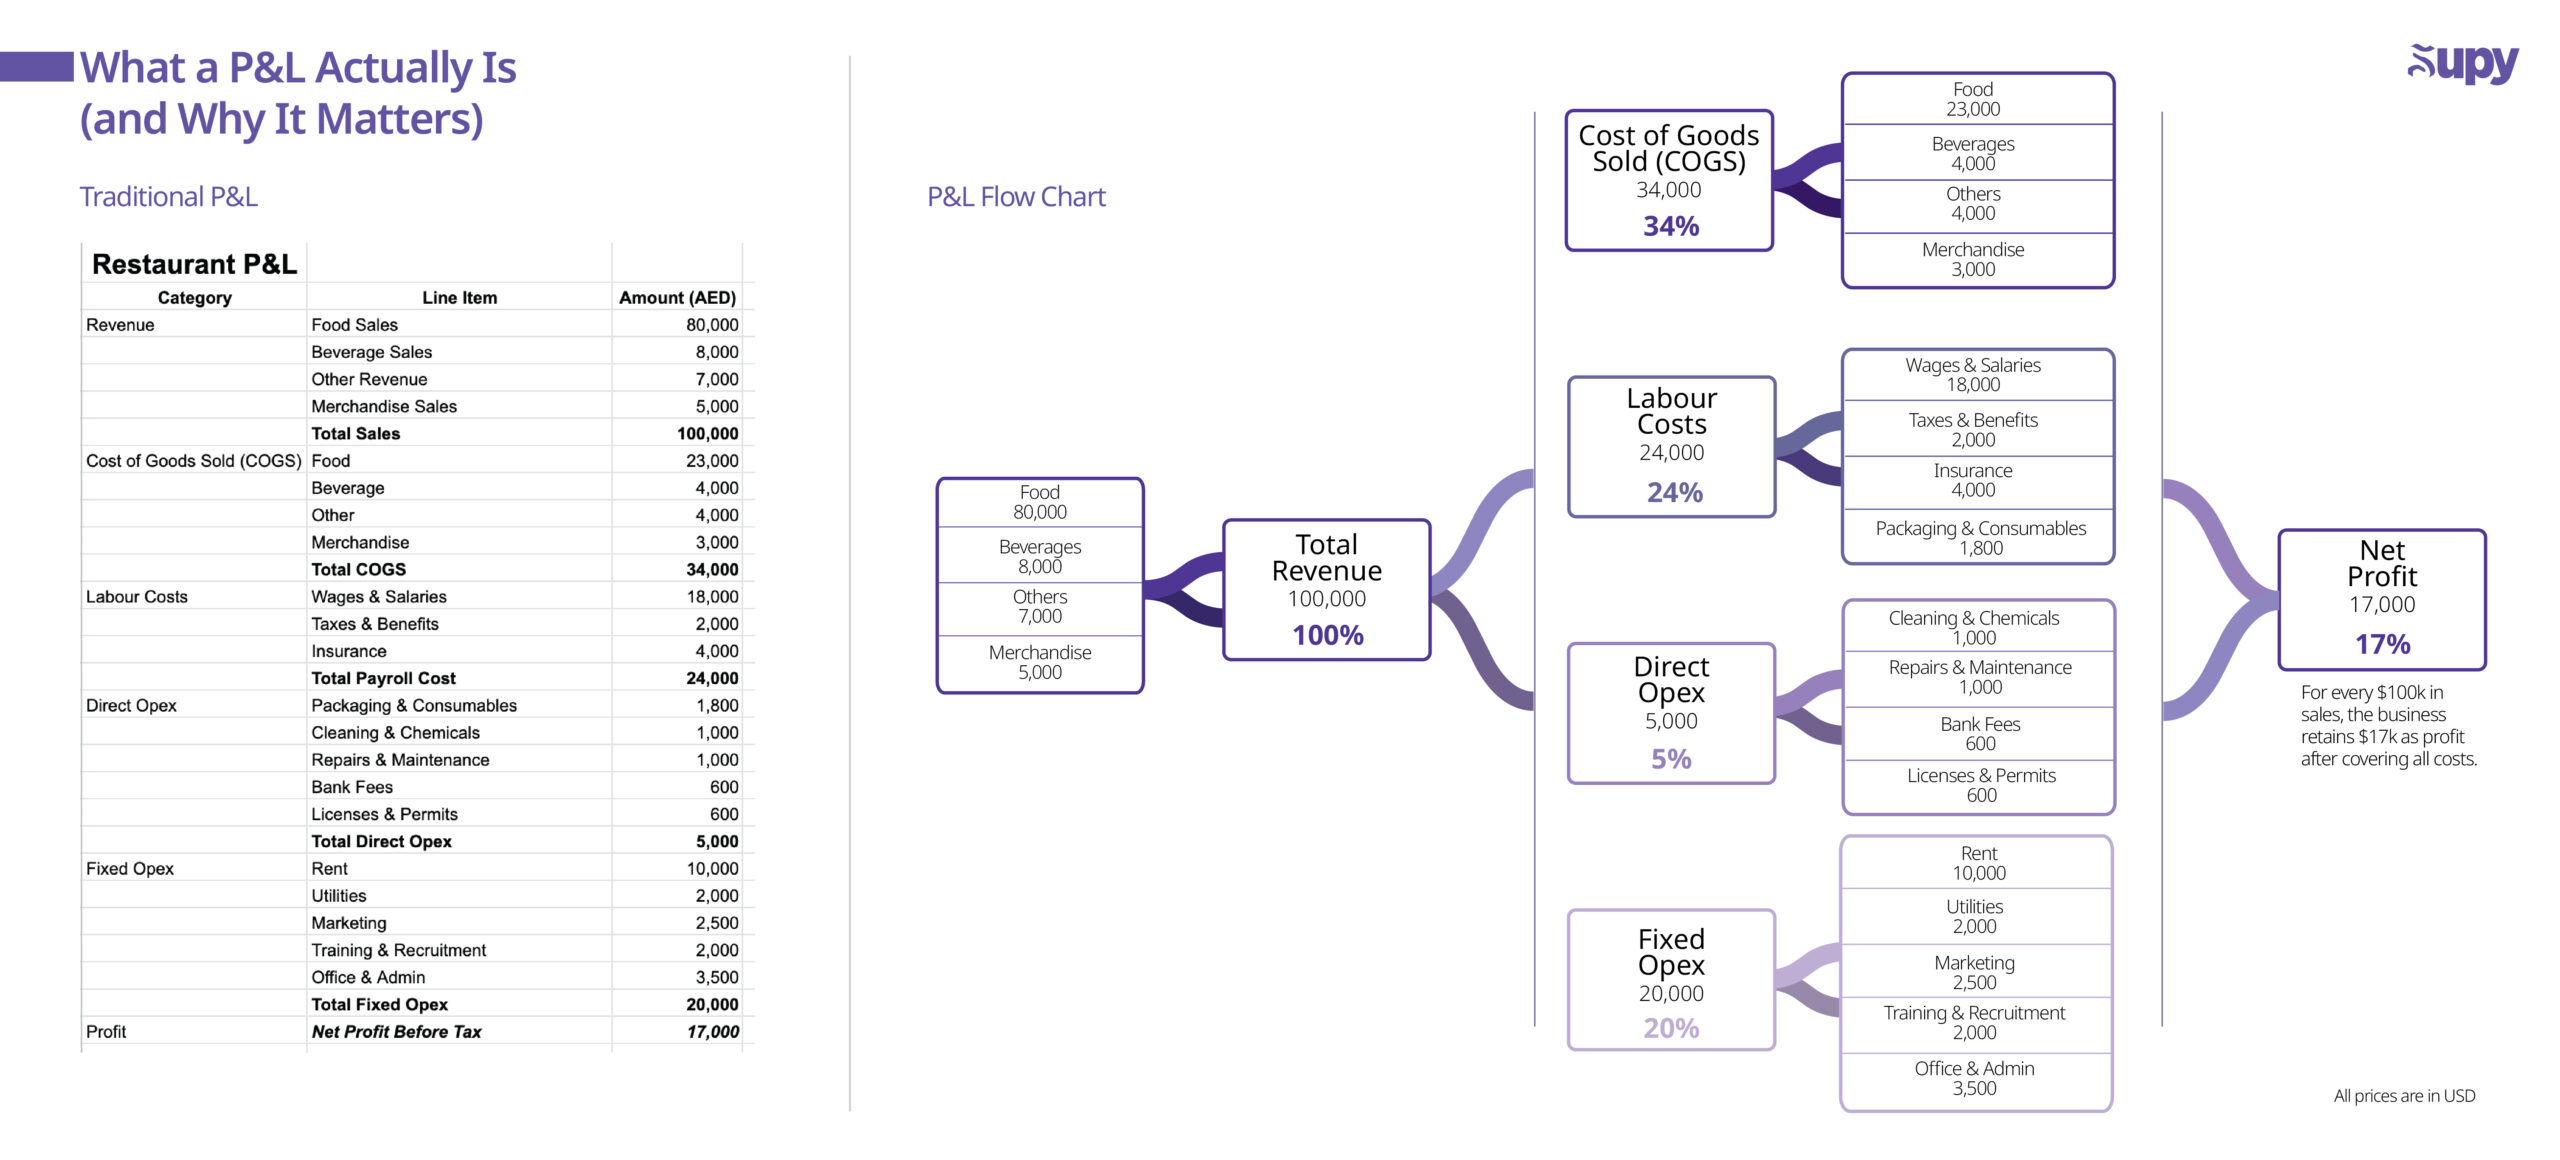
What a P&L Actually Is (and Why It Matters)
In simple terms, a Profit & Loss Statement shows you where your money came in - and where it went.
It’s like an autopsy report for the last month.
Sales are at the top. Profit is at the bottom. And in between are all the decisions, habits, and costs that got you there.
You’ll usually see:
- Sales
- COGS (Cost of Goods Sold)
- Labour Costs
- Operating Costs (aka Controllables)
- Fixed Costs
- Net Profit or EBITDA
If you’re seeing one for the first time, it might look like a finance tool.
But once you start digging into the “why” behind the numbers - not just what changed, but what caused it - it becomes one of the most valuable tools an operator can use.
What it tells you depends on your role:
- For a GM, it helps you connect what happened during the week to how the site performed overall.
- For a multi-site operator, it’s how you coach teams, spot patterns, and make smarter calls across your area.
- For a finance or leadership team, it’s the foundation for decisions around growth, spend, and risk.
You don’t need to be a numbers person. But you do need to know what the numbers are telling you.
The Funnel: What 100% Really Means
Travis teaches his teams to view the P&L like a funnel.
Revenue flows downward - and profit leaks out at every layer.
Here’s how he maps it out in manager meetings:
- Sales (100%)
All revenue from food, drink, other sales channels - maybe tickets orevents too. - COGS (~25%)
Food, drink, and buying the products you sell(disposables, packaging, and waste are all controllables) - Labour (~33–34%)
Wages, NI, pensions, holiday pay, overtime and all staff costs. - Controllables (~15%)
Cleaning materials, bin bags, paper, printer rolls, admin tools and utilities - Fixed Costs (~15–20%) ideally lower here!
Rent, rates, insurance, service charge etc - EBITDA / Net Profit (what’s left)
Often 10%, sometimes only single digits after everything is removed!
“You do £10k on a Saturday and people think they’ve smashed it,” Travis says.
“But by the time you’ve taken out COGS, labour, rent, chemicals, card fees… you could be left with £1k, even just £500, maybe.”
Once teams understand this breakdown, every decision - portioning, rotas, ordering - takes on new weight.
It’s Not Just a Report - It’s a Behaviour Readout
Here’s how Travis sees it:
“If something moves in the P&L - COGS, labour, waste - it’s because someone did something differently. And your job is to figure out what changed.”
A spike in labour? That’s probably a rota decision.
COGS jumps? Maybe the spec’s slipped. Or you’re over-ordering. Or you’ve got a waste issue no one’s raised.
None of it’s random. And if you treat the P&L like a tick-box exercise, you’ll miss the root cause every time.
What to Look For: Red Flags and Green Flags
Travis doesn’t obsess over every number. But he knows what to zoom in on.
Red Flags
- COGS spike without menu or volume change
→ Over-portioning, delivery issues, or training gaps - Labour over 35% without trade to justify it
→ Weak rota planning or lack of flex, higher team turnover etc - Rising OpEx over time
→ Packaging, cleaning, admin spend not being tracked and managed forensically - Unexplained discounts, voids, or comps
→ Possible integrity or process issues - The same rota every week
→ Rigid, lazy, and blind to actual trade
Green Flags
- Stable COGS and labour
→ Solid systems, consistent spec, strong execution - Labour bump during launches or training
→ Strategic spend that improves the future - Managers who explain variances without excuses
→ Ownership mindset - Actions tied to outcomes
→ Track, test, adjust - then share what worked
Common Pitfalls to Avoid
Even experienced operators fall into these traps:
1. Only looking at the bottom line
That’s the result. But the useful stuff is in the layers above.
2. Thinking it’s “for finance”
If your GMs don’t think the P&L is theirs to own, your team won’t take the right kind of responsibility.
3. Reviewing too late
A P&L is monthly. But most of the damage happens during the week. You want to spot issues before they show up on the report - not after.
“By the time it hits the P&L, it’s already happened. The question is - did you see it coming?”
Using the P&L as a Teaching Tool
This is where the P&L becomes a coaching tool, not just a scoreboard.
Here’s how to use it in practice:
- Draw the funnel. A whiteboard sketch lands better than a spreadsheet
- Use sticky phrases. “30% COGS = 30p of every £1” - it clicks
- Stick to one lever. If labour’s out this month, go deep there
- Explain the ‘why.’ Why bin bags matter. Why portioning matters. Why over-polishing glassware adds up
“You’re not turning chefs into accountants. You’re helping them see how their day-to-day affects the big picture.”
The Operator’s Checklist: 5 Questions to Ask Each Month
This is the rhythm that operators like Travis follow when reviewing P&Ls with GMs or site leaders.
But it’s not about ticking boxes - it’s about building a habit of curiosity and accountability.
1. Where did we land?
Start with the final net profit or EBITDA line - but treat it like a headline, not the story.
Did we hit target? Great. But how did we get there?
Missed it? Then don’t just stop at the loss - go find out what tipped it.
Don’t rush this part. Sit in the number for a minute.
2. What changed vs. last month?
Instead of jumping to blame or excuses, start by scanning for shifts - up or down.
- Is COGS creeping up?
- Did labour suddenly improve?
- Are voids getting more frequent?
You’re looking for movement. Because movement means something changed - and that’s worth understanding.
3. Why did it change?
This is where the conversation turns into coaching.
Make your GM explain the story behind the shift:
- Was labour up because of an event that didn’t deliver sales? How could/should we have flexed this?
- Did COGS spike because of poor spec adherence during a busy week?
- Did a new supplier switch cause rework or delay? Something we need to take back to the centre.
The key here isn’t to catch people out. It’s to train them to think operationally, not just financially.
4. What are we doing about it?
Every number needs a next step.
That might mean:
- Changing how prep lists are written
- Adjusting FOH staffing by half an hour on slow days
- Moving audits from monthly to weekly
If there’s no action, there’s no progress. And vague answers like “we’ll keep an eye on it” don’t count.
5. Who else needs to know?
Don’t let the insight stay trapped between two people.
If the kitchen team helped bring COGS down - tell them why that matters.
If FOH overspent on labour - show them the gap, and the fix.
If an area manager learned something useful at one site - cascade it to others.
Good operators use their P&L reviews to make the whole team sharper, not just the manager.
“If you do that every month - just ask those five questions and go one layer deeper each time - you’ll build better operators. Guaranteed.” - Travis Fish
Final Word: Curiosity Beats Complexity
You don’t need to be a finance whiz to read a P&L well.
But you do need to care.
To ask one layer deeper.
To help your team understand how their actions show up in the numbers.
Because the best operators don’t just read the P&L.
They use it to build better behaviours - and better businesses.
Want to Go Deeper?
If this resonated:
- Join Ops Club - a free, no-BS community run by Travis. It’s where operators swap real-world advice, solve operational headaches, and share what actually works - from cost control to team culture.
- Book a Demo with Supy - Our inventory and procurement software is built specifically for multi-site restaurant groups. It gives you live visibility into margins, waste, supplier spend and more - without the spreadsheet chaos.
Different tools, same mission: helping operators run better, more profitable hospitality businesses.
Restaurant P&L Glossary
Sales
The total revenue a site brings in – including food, drink, service charge, events, and more.
Always shown as 100% on a P&L so you can compare everything else against it.
Cost of Goods Sold (COGS)
The cost of everything used to make and serve food or drink – including disposables and waste.
If you sell a burger for £10 and it costs £3.20 to make, that £3.20 is your COGS.
Labour Costs
All staff-related costs – wages, overtime, employer’s NI, pensions, and holiday accruals.
Operating Costs (OpEx)
Day-to-day costs to run the venue – cleaning supplies, uniforms, admin tools, bin bags, printer rolls.
Also known as “controllables” because you can actively manage them.
Fixed Costs
Costs that don’t change much from month to month, like rent, utilities, insurance, software, and head office overheads.
Controllables
Another term for your operating costs – the stuff you can control week to week, unlike rent or insurance.
Net Profit
What’s left at the very bottom of the funnel after every cost has been taken out.
A good operation might see 5 to 10 percent. Some months, it’s lower.
Gross Profit
What’s left after subtracting COGS from sales, before you take out labour, operating costs, or fixed costs.
P&L (Profit and Loss Statement)
A monthly report showing all revenue and costs.
Not just a finance tool. When used right, it’s a coaching tool for operators.
Variance
The difference between what you expected (budget or forecast) and what actually happened.
Every variance has a story – and that’s where the learning is.
Comps / Voids / Discounts
Revenue lost due to free items, voided transactions, or discounts.
Important to track, especially if the volume starts creeping up.
Overheads
High-level costs not tied to a single site or shift – includes rent, utilities, and head office salaries.
EBITDA
Earnings before interest, tax, depreciation, and amortisation.
Useful for investors and long-term planning, but not your day-to-day ops tool.