.jpg)


From Spreadsheets to Integrated Inventory: Why Real‑Time Systems Are Now Essential

In multi‑location restaurants, inventory is where profits can be protected or lost. Hours of delay between sales and stock updates turn into waste, rush orders and cash tied up on the shelf.
Real time inventory management gives finance and operations teams a single source of truth so decisions happen now, not next week. Data from Lightspeed shows that theft drives roughly three‑quarters of restaurant shrinkage.
t the same time, the average restaurant loses about 21% of food purchased to waste, and food costs typically represent 25-35 % of total spending. With rising food prices and global supply chain pressures, the cost of delay has never been higher.
By 2025 most restaurant operators recognise that technology is a competitive advantage, a Supy article reports that 76% of operators believe tech gives them an edge, yet only 13 % are satisfied with their current stack.
That gap represents opportunity. This guide shows the operational path from spreadsheet chaos to real‑time control and explains why integrated inventory is now the baseline for any group with growth ambitions.
What “Real‑Time Integrated Inventory” Actually Means
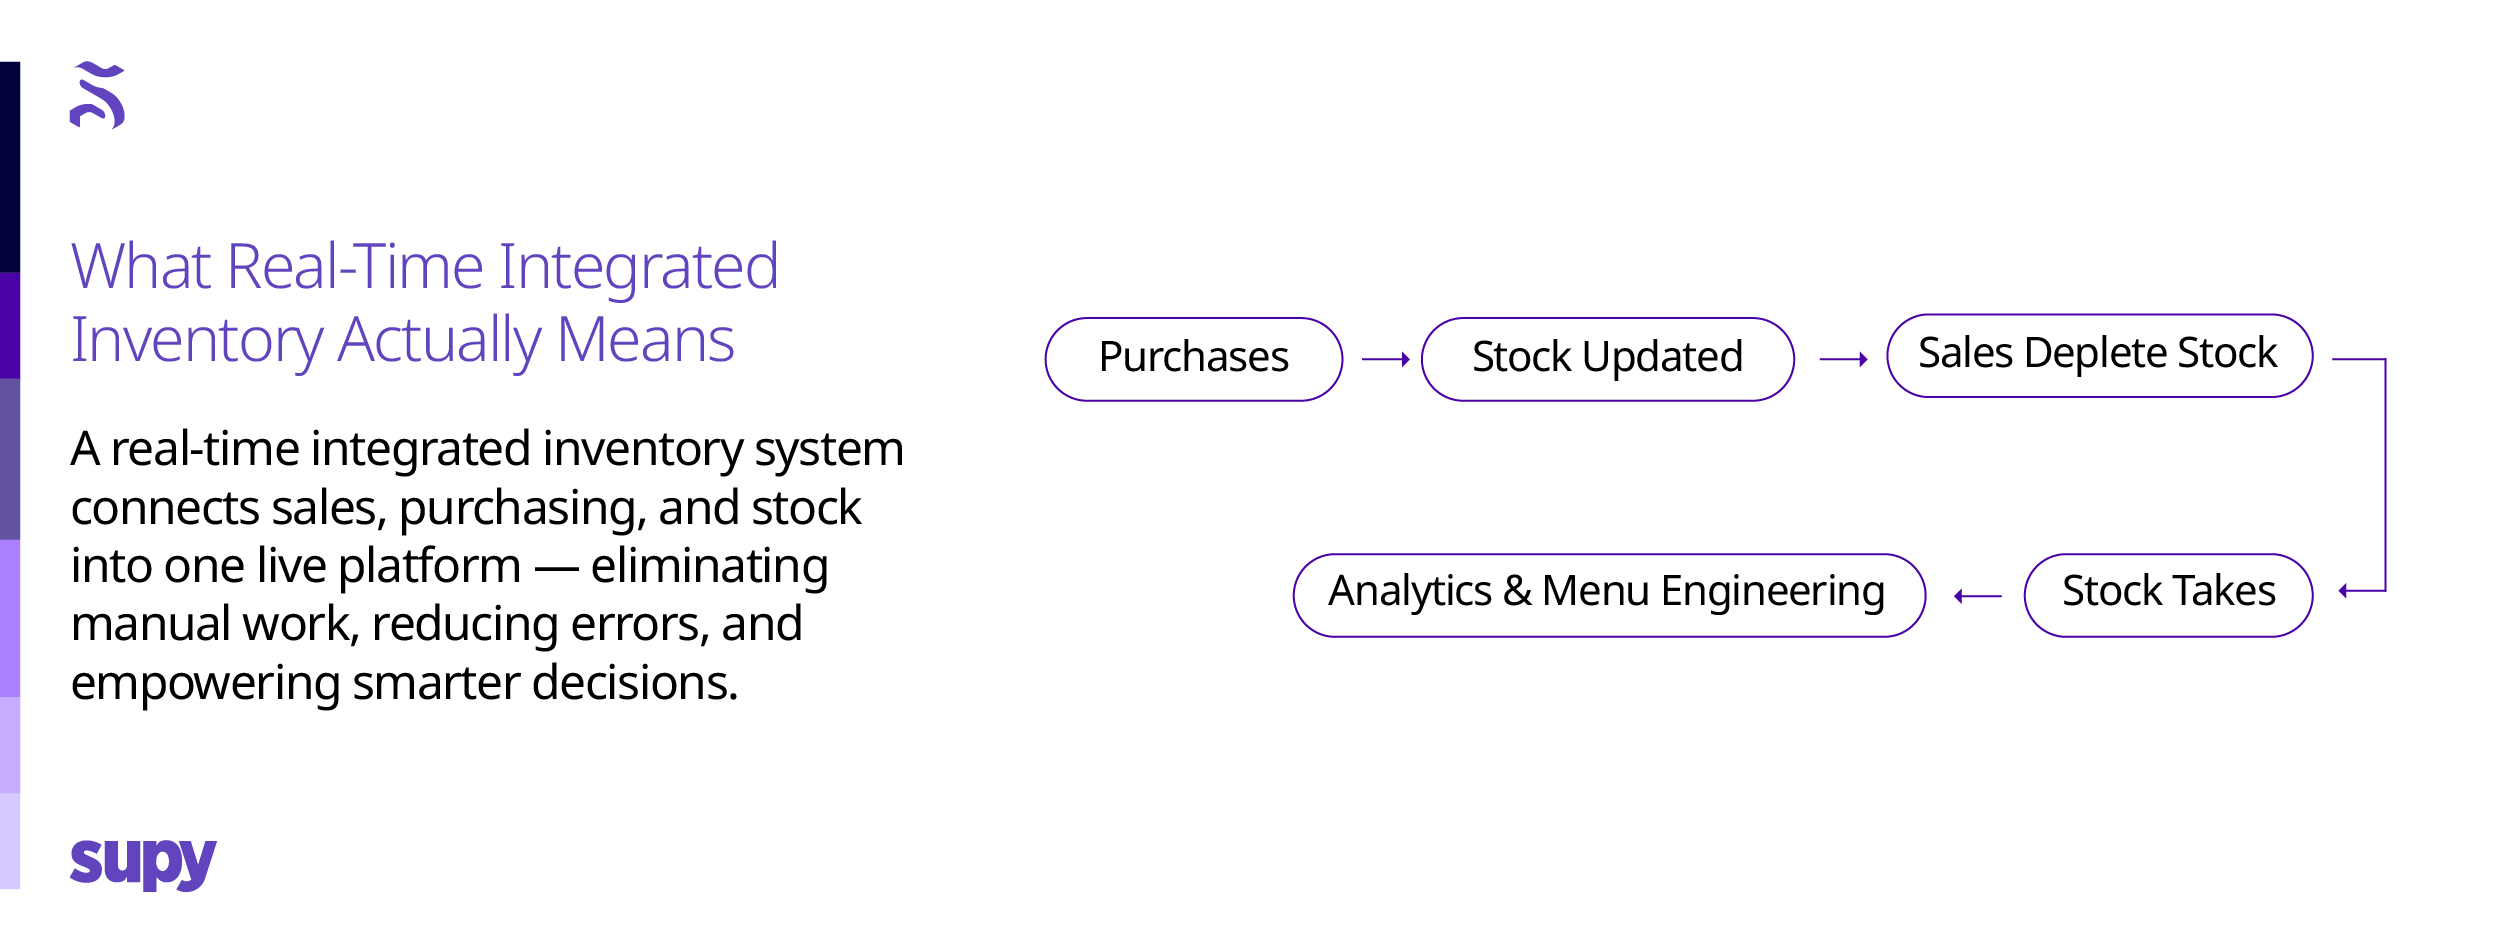
A real‑time integrated inventory system replaces silos with one operational backbone. All ingredients live in a unified ingredient master list with standard names, units and yields.
Live sales data flows directly from your POS, removing the need to copy numbers into a spreadsheet. Purchases are raised as purchase orders, converted to goods‑received notes (GRNs), and matched against invoices; with any variances automatically generating credit notes.
Receiving goods and stock counts update inventory quantities immediately, and POS sales data depletes inventory as guests place orders.
Not only that, but modern systems leverage artificial intelligence to forecast demand based on historical sales, seasonality, local events and even the weather, automation reduces human error and flags inconsistencies in real time and cloud‑based platforms allow managers to access data from any device.
This isn’t just a dashboard bolted on top of spreadsheets. It is the system that runs daily work – sending purchase orders, scanning invoices, counting stock, transferring between the central kitchen and outlets, and producing reports. When everything lives in one system, operators stop firefighting and start steering.
Why Spreadsheets Break at Scale
Spreadsheets served you well when you had a single location and a small team. They do not scale to multi‑unit operations for several reasons:
- Version drift: Each outlet maintains its own copy. No one knows which file is correct. This leads to duplicated work and decisions based on stale numbers.
- Manual entry: Staff type counts and invoices into cells. Errors compound, variances are missed and managers end up working overtime.
- Stale data: Sales and purchases reconcile weekly or monthly. By the time you spot a shortage or overstock, the damage is done.
- No audit trail: Spreadsheets do not track who changed what and when. Weak controls invite opportunistic shrinkage.
- Siloed outlets: Each general manager tweaks the sheet their own way. Consolidated reporting becomes impossible. Units, pack sizes and yields vary across branches.
- Hidden shrinkage and theft: Without immediate variance analysis, losses remain buried until month‑end. Theft alone accounts for around 75 % of shrinkage.
- Recipe and yield errors: Conversions and prep losses live in free‑text cells rather than a structured recipe database. Theoretical usage drifts from reality.
The bigger you get, the more these issues multiply. Lag eats margin. An integrated system eliminates lag by updating stock and cost as movements happen.
The Pillars of a Modern Real‑Time System
The best systems combine process discipline with technology. Below are the pillars that make real‑time inventory possible.
Unified Item Master and Recipes
One item, one code. Standard units, pack sizes and yields. Allergens stored at the source. Recipes deplete the correct ingredients in the right units, ensuring theoretical usage is accurate before the first plate is sold. Without a clean item master and recipe database, everything that follows will drift.
POS and Sales Sync
POS integration pushes sales data in near real time. Recipes tie each menu item to its ingredients. As customers order, the system depletes inventory instantly. Variance analysis is possible daily instead of monthly, and managers see what’s happening in each outlet at a glance.
Procurement and Supplier Management
Live catalogues hold approved prices and pack sizes. Preferred suppliers are assigned to each item, including lead times and currency settings. Purchase orders are raised against par and minimum levels rather than guesswork. When your catalog is digital, price drift is spotted quickly and over‑ordering declines.
Approvals, Permissions and Limits
Role‑based controls define who can do what. Spend thresholds prevent a junior buyer from ordering expensive items without approval. Multi‑step purchase approvals add a second set of eyes on high‑value categories. An audit trail shows every action.
Stock Counts with Barcode Scanning
Mobile devices or scanners turn counts into a few taps. Cycle counting spreads the work across the week to avoid closing the restaurant. Blind counts reduce bias. Variances are flagged immediately. Barcode stock counts also support expiry tracking and reduce human error.
Auto‑GRN and Invoice Matching
Goods‑received note automation converts purchase orders into GRNs with one tap. Invoices are scanned; the system matches line items and prices, flags mismatches and proposes credit notes. Finance gains clean data without re‑keying, and discrepancies are caught while they’re still small.
Central Kitchen and Warehouse
Requisitions flow from outlets to the central kitchen. Transfers are recorded both ways. Batch production calculates yields and rolls up costs automatically. Internal movements – from warehouse to outlet or outlet to outlet – are transparent and auditable.
Analytics and Menu Engineering
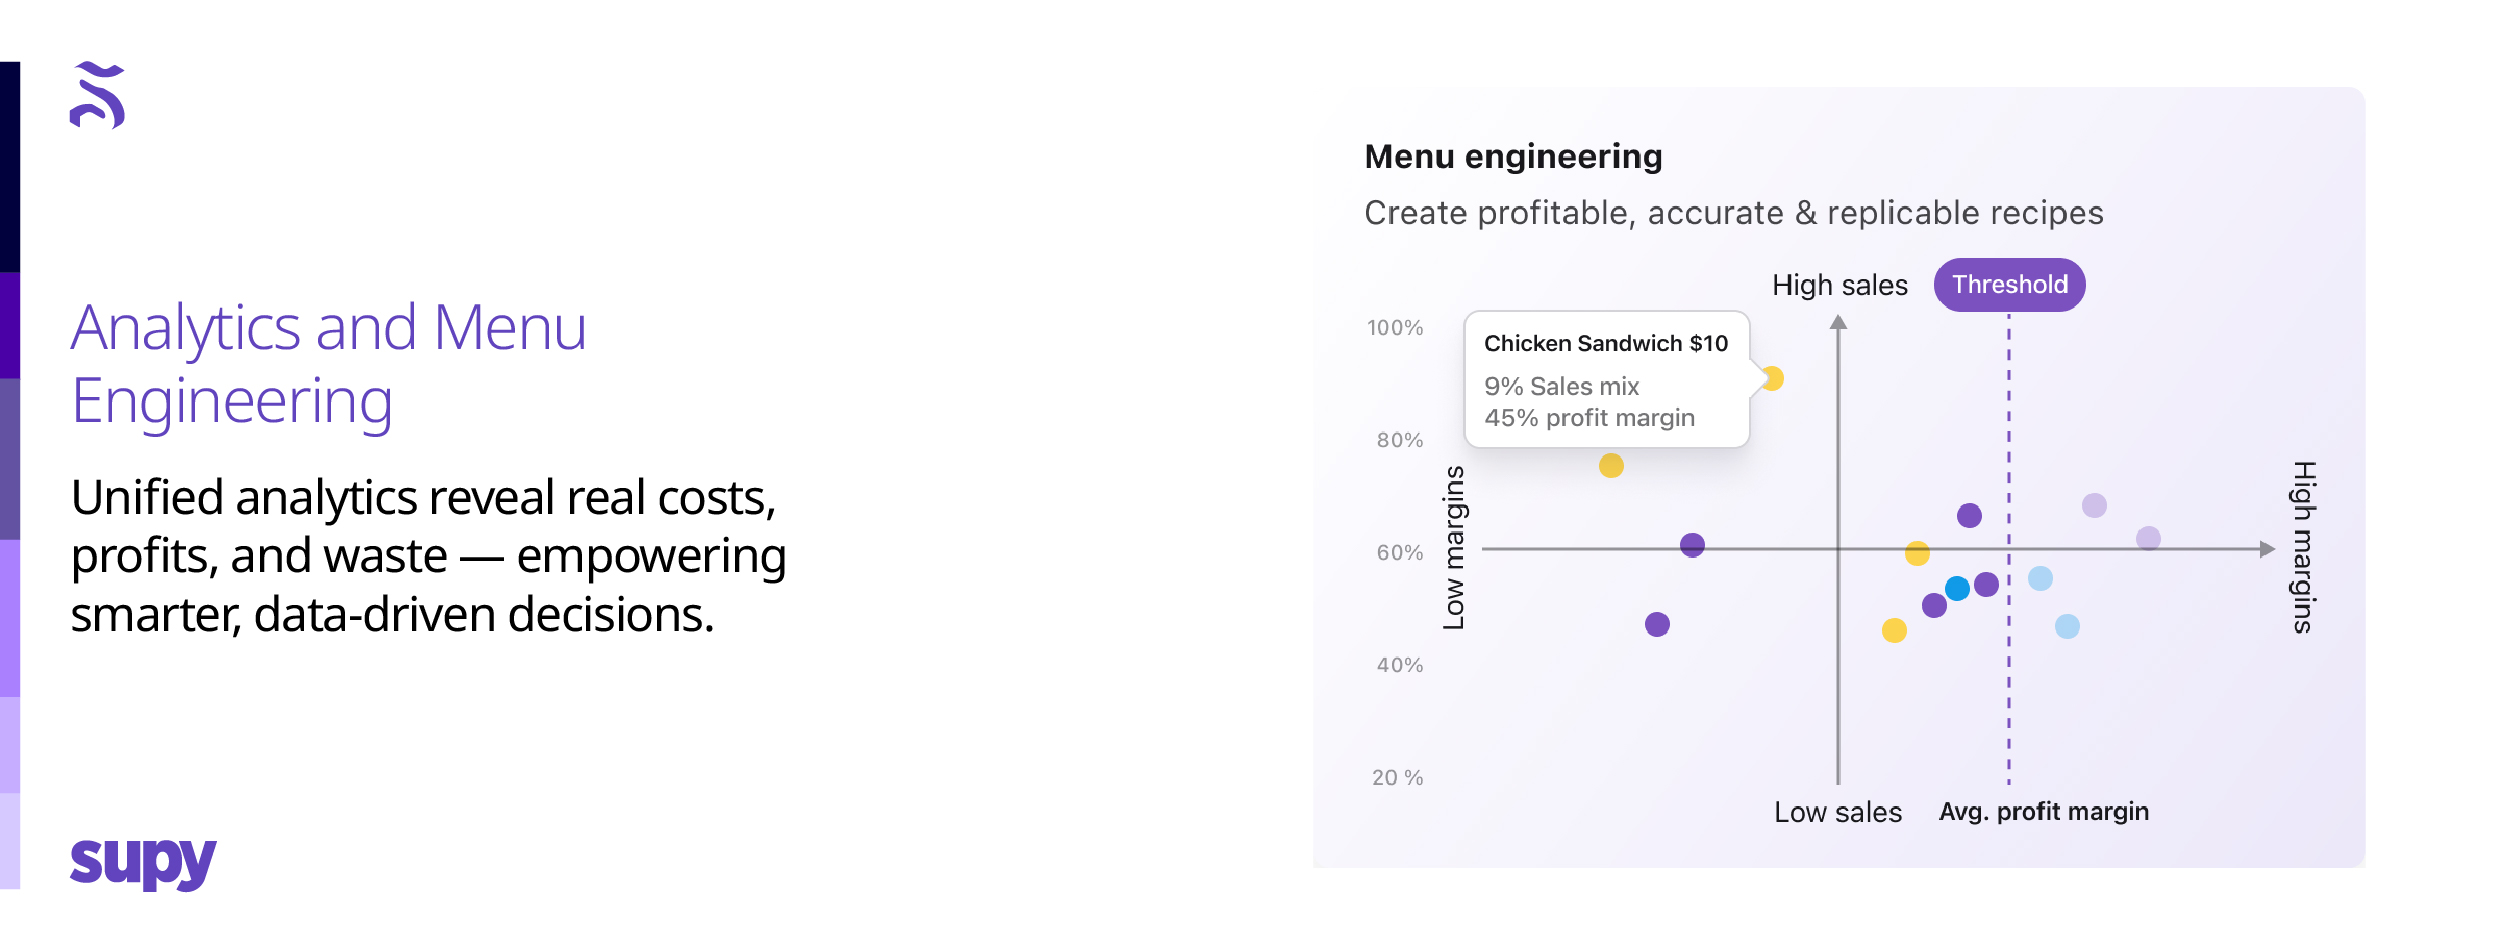
With a unified database, you can see food cost of goods sold (COGS) by outlet, item and category. The system compares theoretical usage to actual consumption to highlight variances and potential theft. Sales mix and contribution margin reports reveal which dishes drive profit and which drag it down. Dead stock and slow movers are identified before they expire. Data‑driven decision‑making becomes the norm.
Regional Settings and Compliance
Taxes, currencies, units of measure and local holidays vary across regions. A modern system handles multiple currencies, local tax rules and measurement systems. Allergen labelling and regulatory compliance are enforced across outlets.
AI & Automation
Artificial intelligence has moved from buzzword to necessity. In 2025 AI forecasting analyses historical sales, seasonal trends and variables like weather or local events. It suggests ordering adjustments in real time. Automation reduces human error and flags anomalies. A McKinsey study cited in a Supy blog found that AI‑based forecasting can reduce inventory errors by 20–50 %. Early adopters have reduced food waste by 15 % after implementing AI‑powered inventory. These tools are no longer optional. They are the difference between being reactive and proactive.
Before vs After: The Operational Delta
A real‑time system isn’t an abstract concept. The differences are tangible and immediate. The table below contrasts key areas before and after implementation. Long sentences are avoided; each cell uses short phrases to keep the focus on the change.
Implementation Roadmap That Actually Works
An integrated system isn’t installed overnight. A phased rollout allows teams to adjust while delivering quick wins. Below is a 90‑day plan that has worked for multi‑unit operators.
0–30 Days: Foundations
- Tidy your data. Normalise item names, units, suppliers and categories. Remove duplicates. Build a clean item master.
- Load recipes. Enter base recipes and yields. Assign allergens. Map menu items to recipes.
- Connect the POS. Map products to recipes and test live sales sync.
- Define storage areas. Create store room, freezer, cooler and bar sections in the system. Set par and minimum levels.
31–60 Days: Operational Control
- Go live with procurement. Use approved supplier catalogues and raise purchase orders digitally. Enforce price locks.
- Start barcode counts. Roll out mobile counts and cycle counting. Train staff to scan items instead of writing numbers.
- Enable Auto‑GRN and invoice scanning. Convert POs to GRNs on receipt. Scan invoices for automatic matching.
- Set up approvals. Configure spend thresholds and roles. Hold daily approval sessions until the team is comfortable.
- Begin weekly variance reviews. Schedule a 30‑minute meeting to discuss top variances and assign actions.
61–90 Days: Scale and Optimise
- Switch on central kitchen flows. Set up requisitions and transfers. Train production staff on batch yields and cost roll‑ups.
- Implement variance SLAs. Assign each outlet a target variance based on sales and hold managers accountable.
- Launch menu engineering cadence. Review contribution margin and menu mix every two weeks. Adjust pricing and recipes.
- Consolidate analytics. Build dashboards for COGS, waste, slow movers and top variances across outlets.
Change‑Management Tips
- Appoint a champion in each outlet and one at the head office to coordinate rollout.
• Start with two quick wins: barcode counts and Auto‑GRN. These save time immediately and win hearts.
• Hold weekly check‑ins to review progress and share learnings. Celebrate small wins.
• Keep the database clean. Discourage free‑text entries. Use drop‑down lists and strict naming conventions.
Cost–Benefit Snapshot
Investing in real‑time inventory is not just about saving time; it delivers measurable returns. Here is a conservative example for a UAE group with 10 outlets.
- Variance reduction. Acceptable inventory variance is 1–2 % of sales, and any variance above 3 % warrants action. Moving from monthly spreadsheets to real‑time control typically reduces food variance by 2 percentage points. If monthly food sales are AED 1.2 million, a 2 % improvement recovers AED 24,000 per month.
- Waste reduction. The average restaurant loses about 21 % of food purchased to wasteblog.stocktake-online.com. AI forecasting and barcode counts can reduce this by around 15 %old-site.supy.io. If monthly food purchases are AED 1.0 million, recapturing 15 % of waste equates to AED 15,000 per month.
- Shrinkage and theft. With theft causing ~75 % of shrinkagelightspeedhq.com, tighter controls and daily variance monitoring can halve this. For a group with AED 5,000 in monthly shrinkage, that’s AED 2,500 saved.
- Working capital. Par‑led ordering and faster stock turns free cash tied in slow movers. Reducing average on‑hand days by five days on AED 500,000 average inventory frees AED 8,000–10,000.
- Time saved. Auto‑GRN and invoice matching reduce admin by 40–60 hours per month across outlets. If labour costs average AED 30 per hour, that’s AED 1,200–1,800 in labour savings.
- Additional revenue via digital channels. Integrated systems allow direct online ordering. Restaurants with robust direct ordering see takeout profits up to 30 % higher than those relying solely on third‑party appsold-site.supy.io. Even a 10 % uplift on AED 300,000 monthly takeout sales is AED 30,000.
These benefits easily exceed the cost of modern inventory software. They compound as you scale.
Common Objections and Straight Answers
“My spreadsheets work fine.” They work until a manager leaves, a supplier changes pack sizes or a pandemic forces rapid changes. The risk isn’t that the sheet crashes; it’s the delay. Every day of delay compounds waste, shrinkage and lost sales. Integrated systems remove delay and catch problems while they’re still small.
“Team adoption will be hard.” Make the new system easier than the current one. Mobile counts remove clipboards. Auto‑GRN eliminates re‑keying. Role‑based approvals cut back‑and‑forth. Pilot one outlet, gather feedback and scale. Provide hands‑on training and appoint champions at each site. Change management is as important as the technology.
“Suppliers won’t play along.” Digital catalogues and price locks improve supplier relationships. Suppliers benefit from fewer disputes and faster payments. Auto‑GRN and credit notes incentivise accuracy. Good suppliers embrace systems that streamline communication.
Mini Case Snapshot (Anonymised)
An 11‑unit casual dining group in Dubai relied on spreadsheets for counts and purchasing. GRNs were paper‑based; invoices were keyed into a separate sheet. POS sales synced weekly. After implementing an integrated inventory platform, they rolled out barcode cycle counts and Auto‑GRN within 45 days. Food variance dropped from 5.8 % to 3.6 % within three months. Stock accuracy rose from 85 % to 98 %. Monthly admin time on counts and GRNs fell by 50 hours. Food waste reduced by 18 %. The combined savings exceeded the software subscription cost sixfold.
The Weekly Inventory Control Ritual
Consistency is key. Here’s a seven‑step checklist the operations team can follow every week to maintain control:
- Run par‑based purchase orders on Monday morning. Order items below par. Avoid buying above minimum levels unless there’s a promotion.
- Approve purchase orders by noon. Use role‑based limits. Flag unusual spends or price changes.
- Receive with Auto‑GRN and scan invoices. Resolve variances within 24 hours. Generate credit notes immediately.
- Cycle count two storage areas mid‑week. Use barcode or QR scanning. Perform blind counts on high‑value categories.
- Review theoretical vs actual usage on Wednesday. Investigate top variances. Add reasons and assign actions.
- Close supplier issues on Friday. Follow up on missing credit notes, late deliveries or quality problems.
- Publish a one‑page summary for the Monday ops meeting. Include COGS, waste percentage, variance by category and any red flags.
Related Resources


